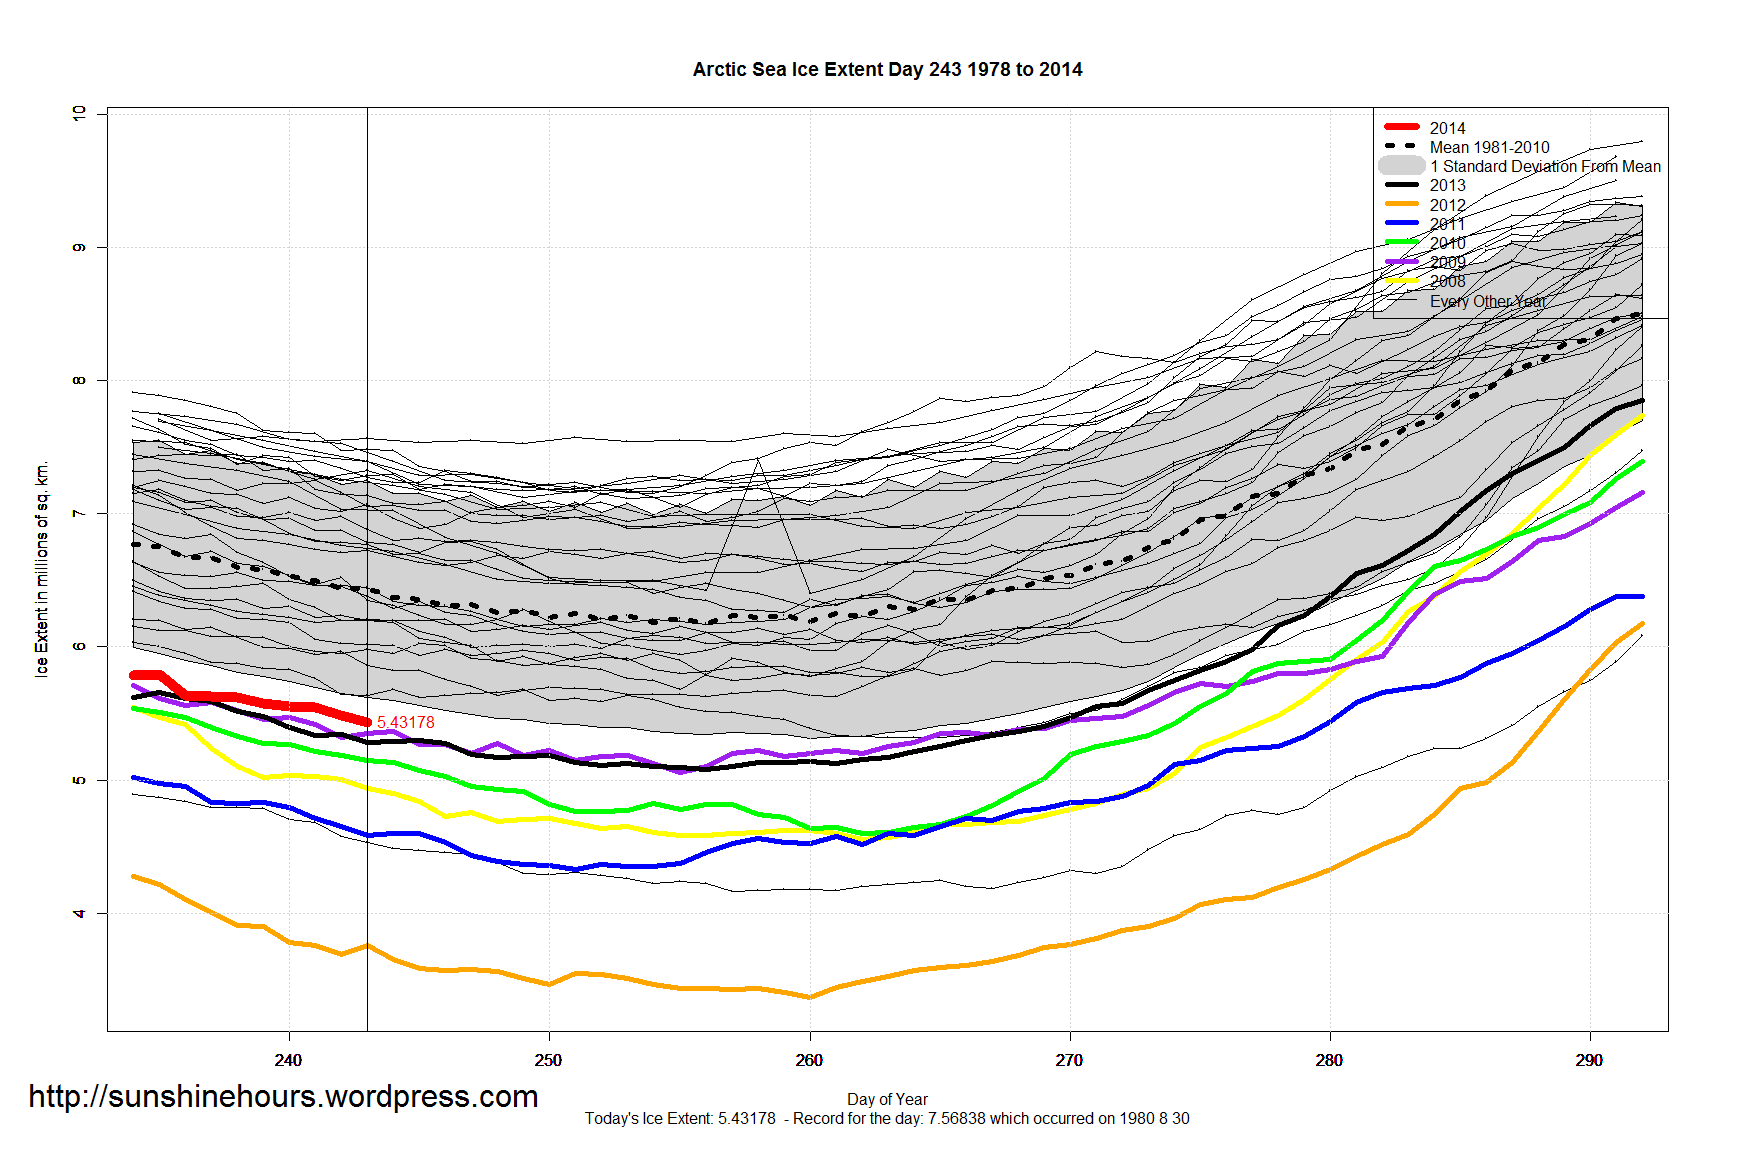
Arctic Sea Ice Extent Sep 01 2014 – -1,005,000 sq km below the 1981-2010 mean. Data for Day 243. Data here.
1.7 million sq km higher than 2012 for the same day. 1 million higher than 2011. 1 million higher than 2007 … etc etc

Arctic Sea Ice Extent Sep 01 2014 – -1,005,000 sq km below the 1981-2010 mean. Data for Day 243. Data here.
1.7 million sq km higher than 2012 for the same day. 1 million higher than 2011. 1 million higher than 2007 … etc etc
Aug 31 2014 MASIE Update – The data for day 241 us missing because of the data glitch on 30-Aug-2014. I have infilled with a guess using the formula (Day 240 + Day 242) / 2
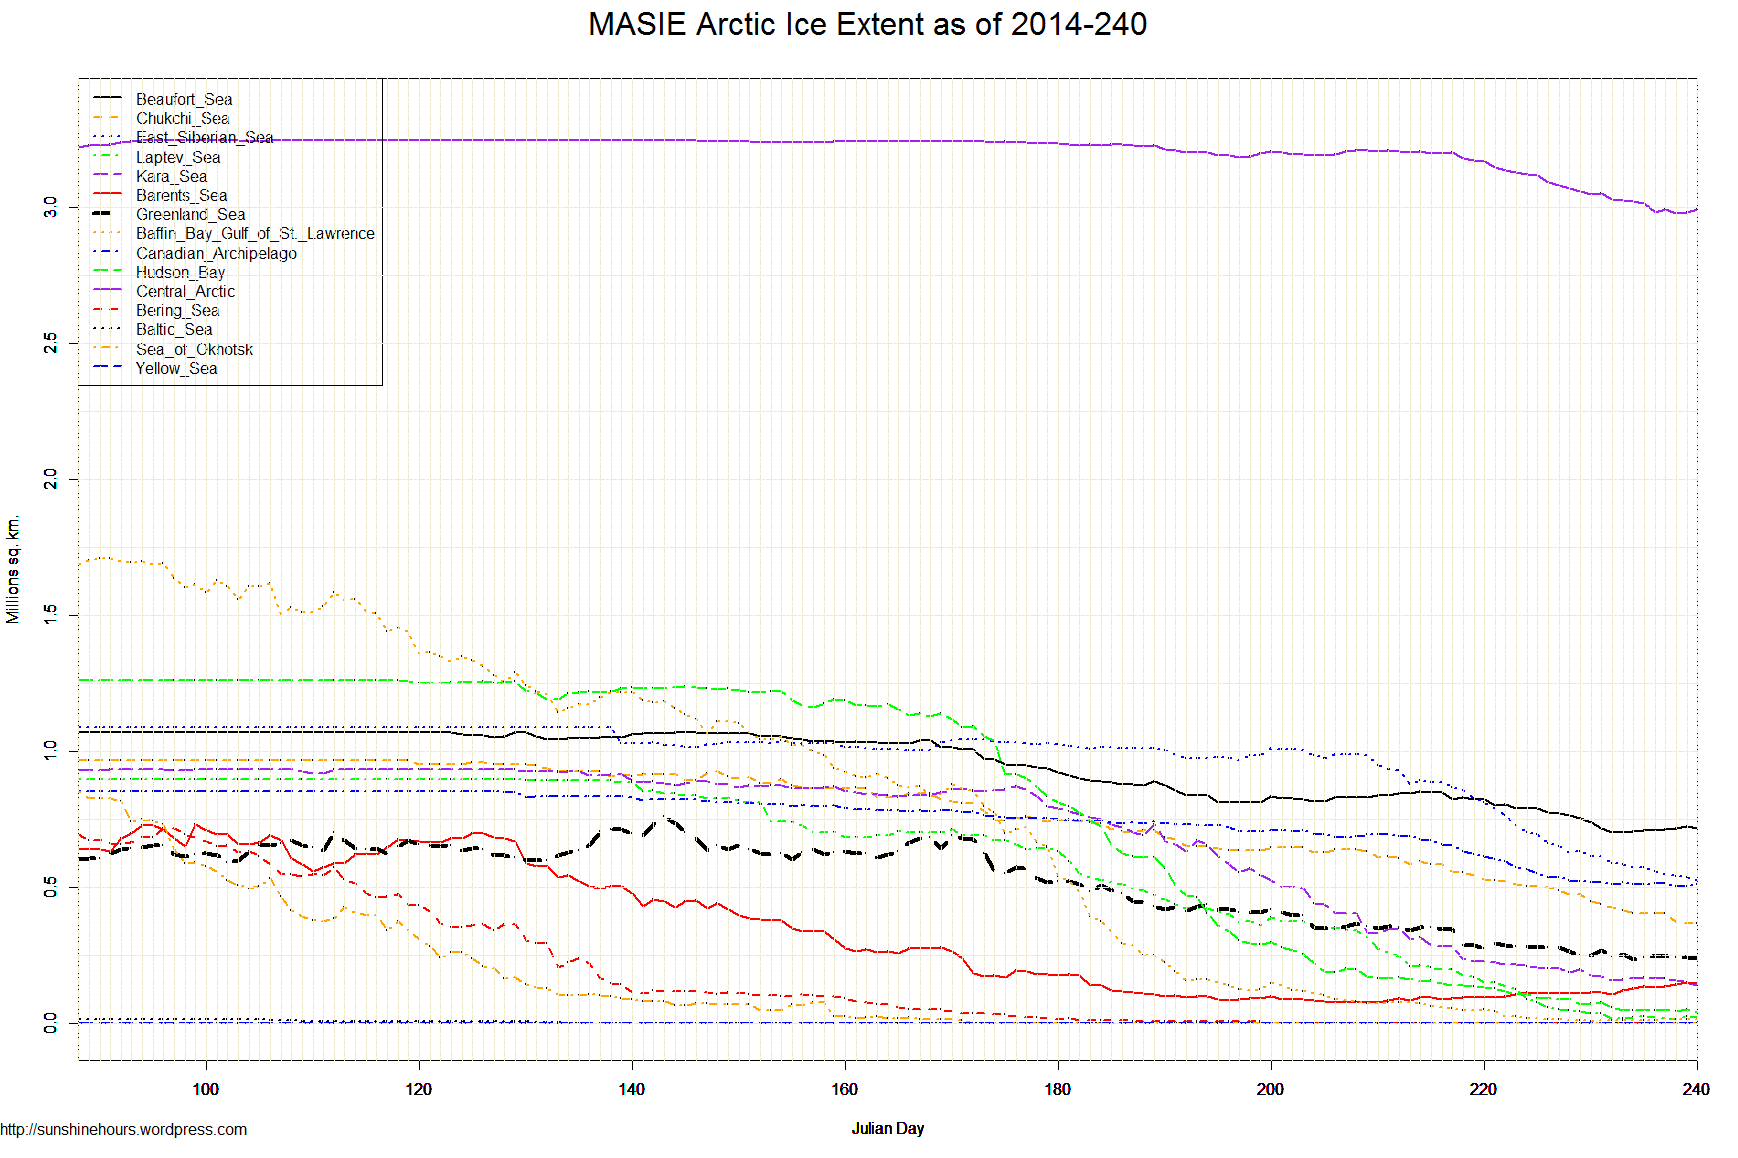
Data here. Click for bigger.


| Region | 155 days ago | End | Last 154 | Last 28 | Last 14 | Last 7 | Last 3 | Last 1 |
| Chukchi Sea | 966,006 | 322,273 | -643,733 | -273,253 | -152,628 | -82,580 | -47,546 | -23,560 |
| Greenland Sea | 603,416 | 214,362 | -389,053 | -137,668 | -52,481 | -30,460 | -28,937 | -11,800 |
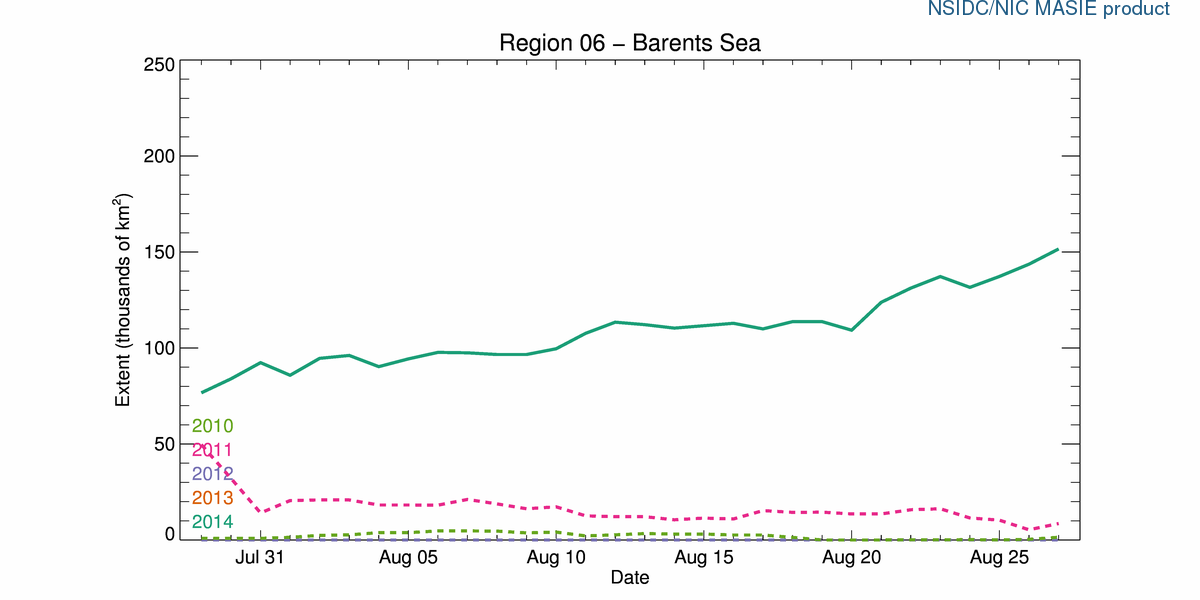
| Barents Sea | 645,917 | 125,481 | -520,436 | 30,863 | 12,611 | -11,729 | -26,084 | -10,339 |
| Kara Sea | 933,859 | 132,148 | -801,711 | -183,939 | -54,982 | -37,843 | -18,547 | -4,706 |
| Canadian Archipelago | 853,214 | 505,283 | -347,932 | -172,939 | -22,496 | -6,741 | -269 | -3,843 |
| Beaufort Sea | 1,070,445 | 717,347 | -353,098 | -136,302 | -46,463 | 6,076 | -5,861 | -972 |
| Hudson Bay | 1,260,903 | 41,866 | -1,219,037 | -113,002 | -45,855 | -8,017 | -9,579 | -397 |
| Bering Sea | 697,324 | 0 | -697,324 | 0 | 0 | 0 | 0 | 0 |
| Baltic Sea | 15,337 | 0 | -15,337 | 0 | 0 | 0 | 0 | 0 |
| Sea of Okhotsk | 853,240 | 0 | -853,240 | 0 | 0 | 0 | 0 | 0 |
| Yellow Sea | 0 | 0 | 0 | 0 | 0 | 0 | 0 | 0 |
| Baffin Bay Gulf of St. Lawrence | 1,688,530 | 14,462 | -1,674,068 | -58,086 | 1,865 | 4,220 | 18 | 9 |
| East Siberian Sea | 1,087,137 | 528,474 | -558,664 | -367,032 | -100,198 | -45,079 | -7,241 | 971 |
| Laptev Sea | 897,845 | 27,175 | -870,670 | -185,864 | -21,211 | 1,962 | 2,048 | 2,018 |
| Central Arctic | 3,221,921 | 3,010,793 | -211,128 | -194,195 | -58,087 | -3,742 | 29,060 | 9,700 |
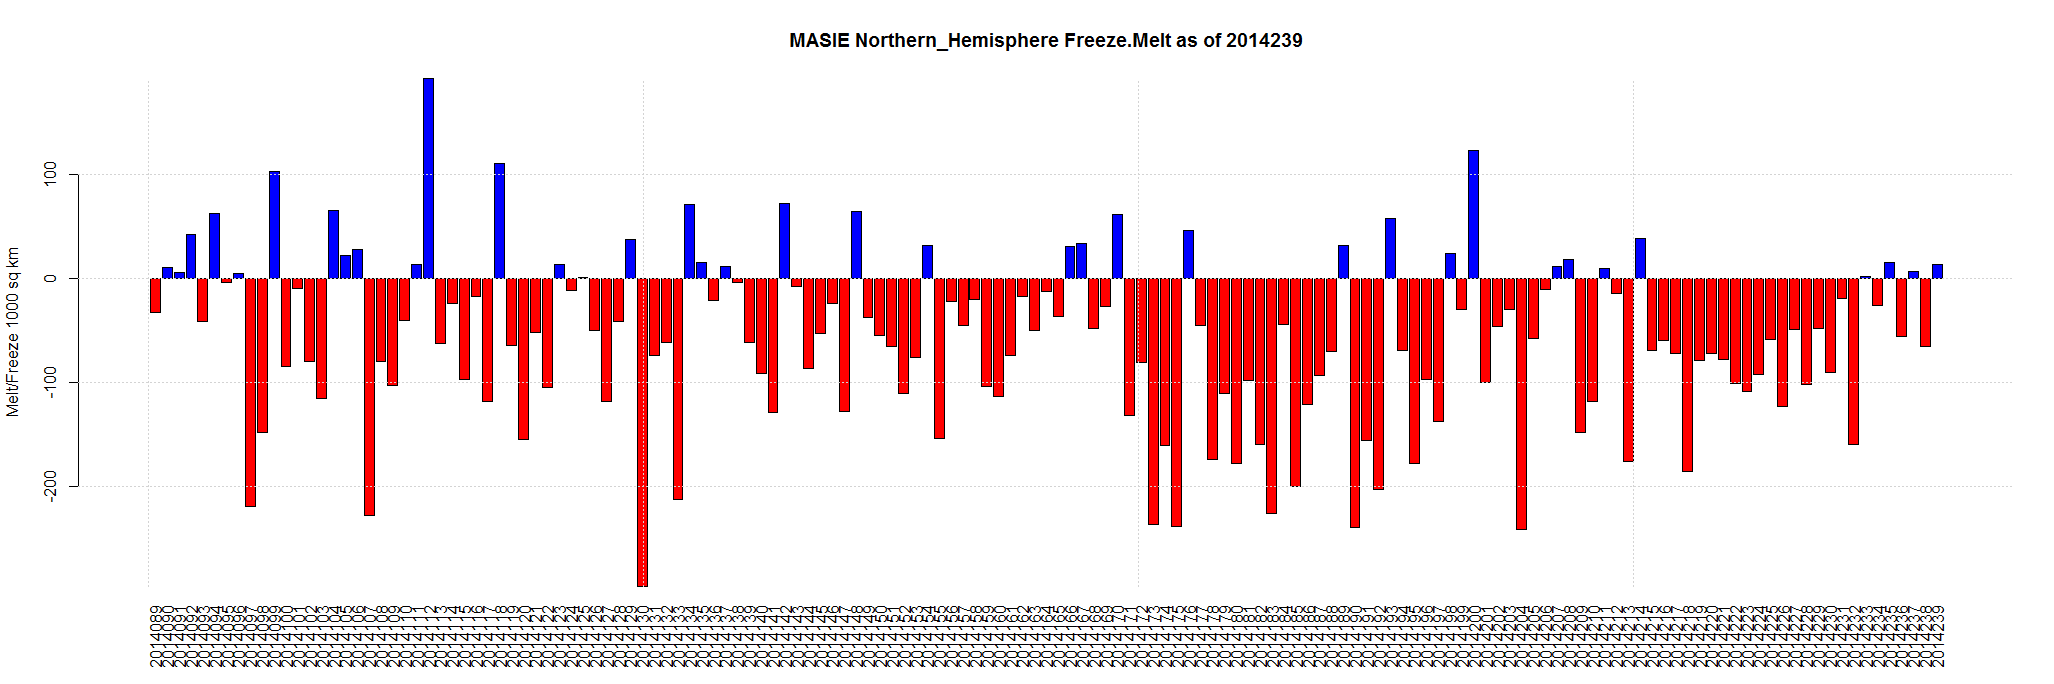
| Northern Hemisphere (Total) | 14,805,115 | 5,640,806 | -9,164,308 | -1,791,416 | -539,924 | -213,934 | -112,939 | -42,919 |
| NH (Average Loss per Day) | -59,125 | -63,979 | -38,566 | -30,562 | -37,646 | -42,919 |
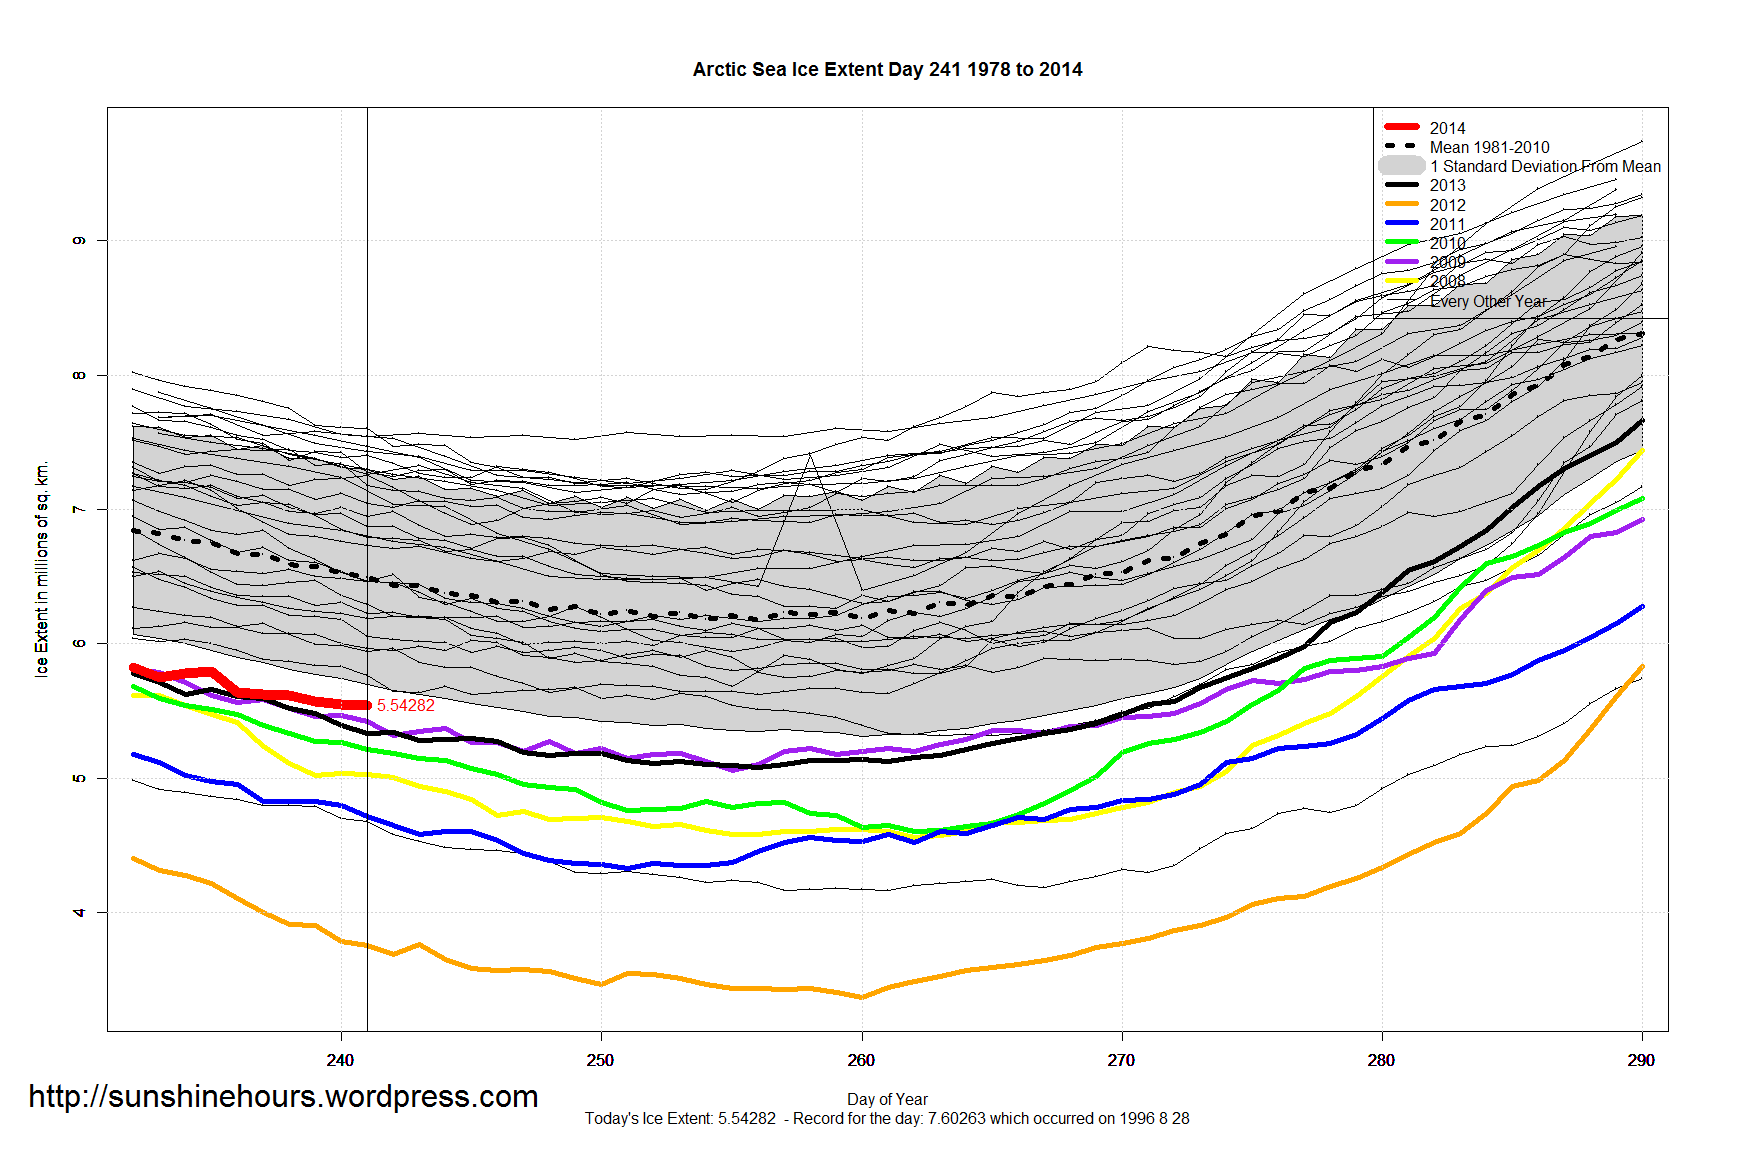
Arctic Sea Ice Extent Aug 30 2014 – -1,022,000 sq km below the 1981-2010 mean. Data for Day 241. Data here.

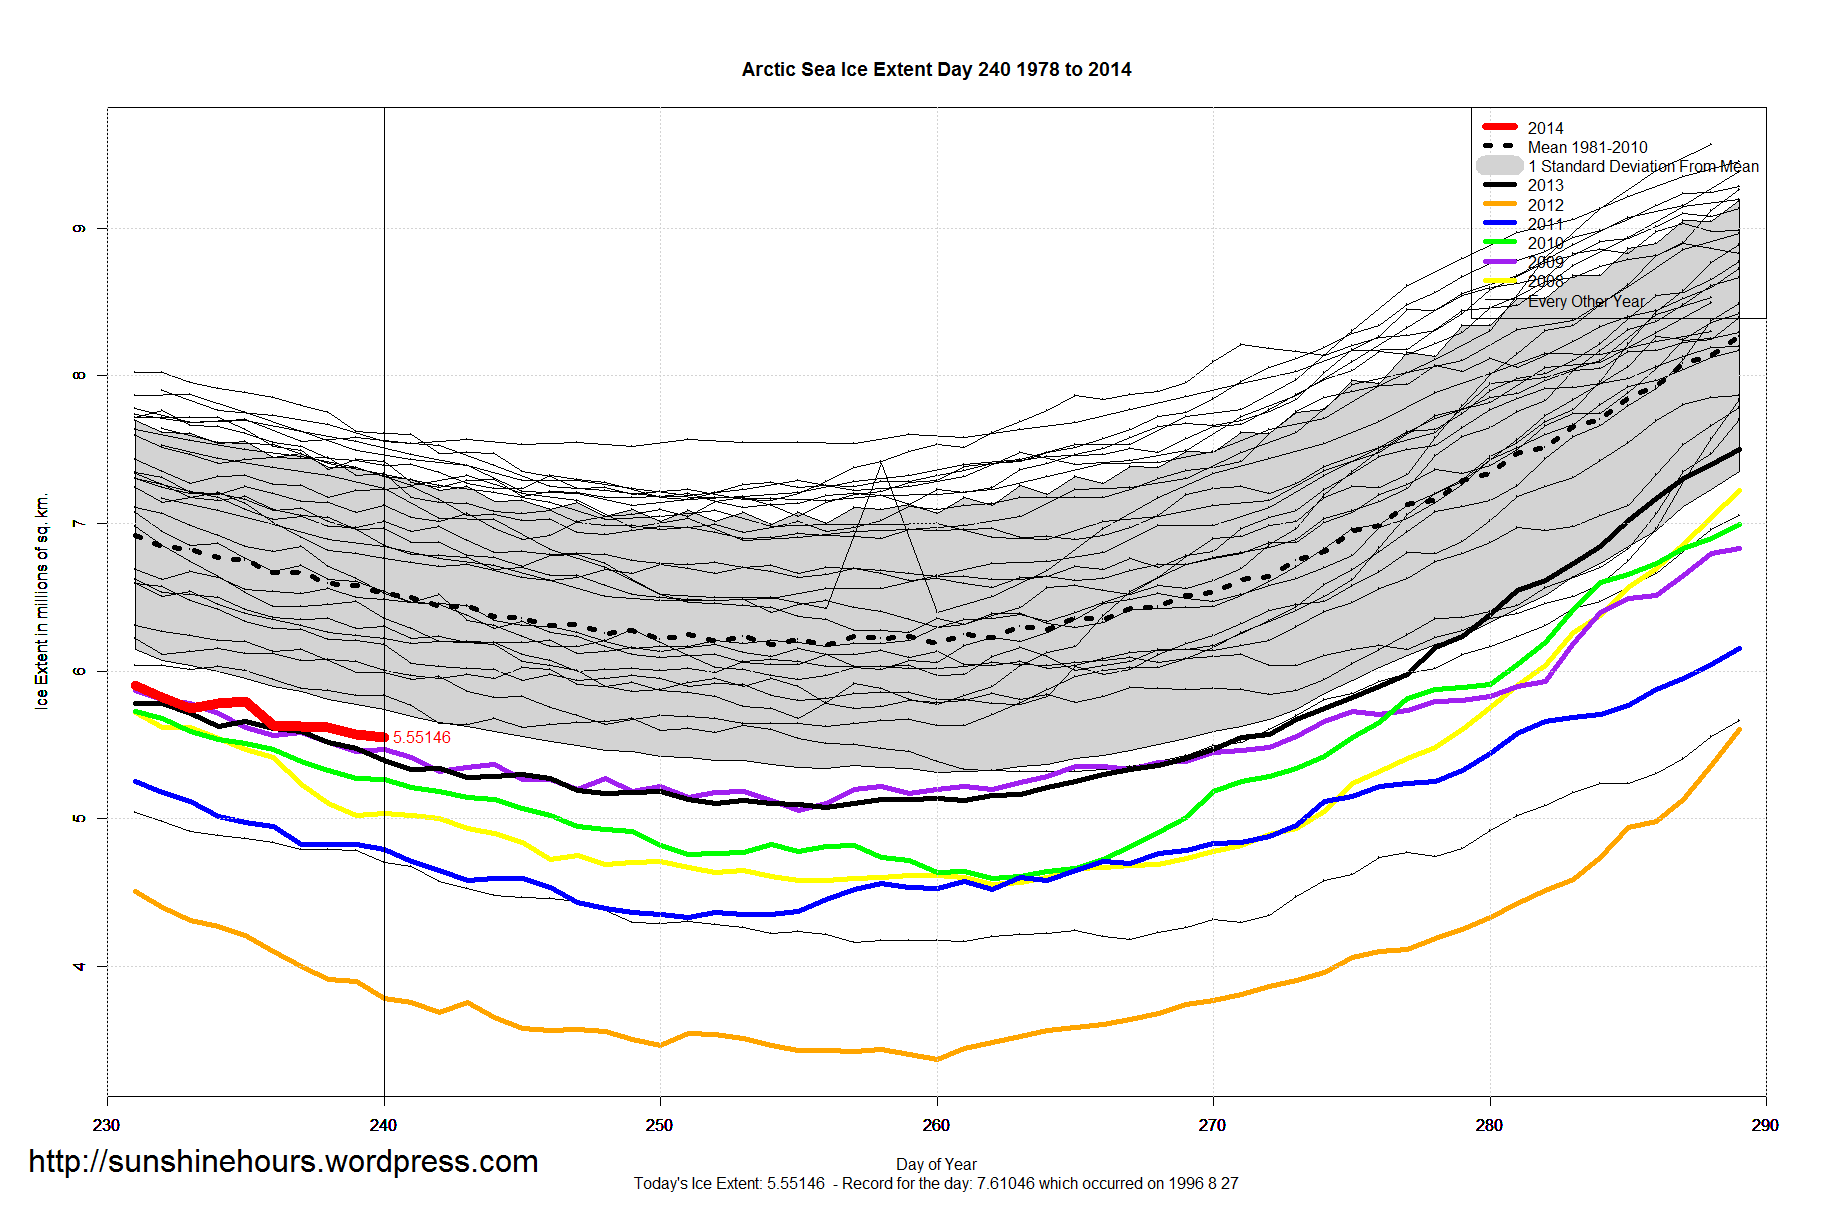
Arctic Sea Ice Extent Aug 29 2014 – -1,068,000 sq km below the 1981-2010 mean. Data for Day 240. Data here.

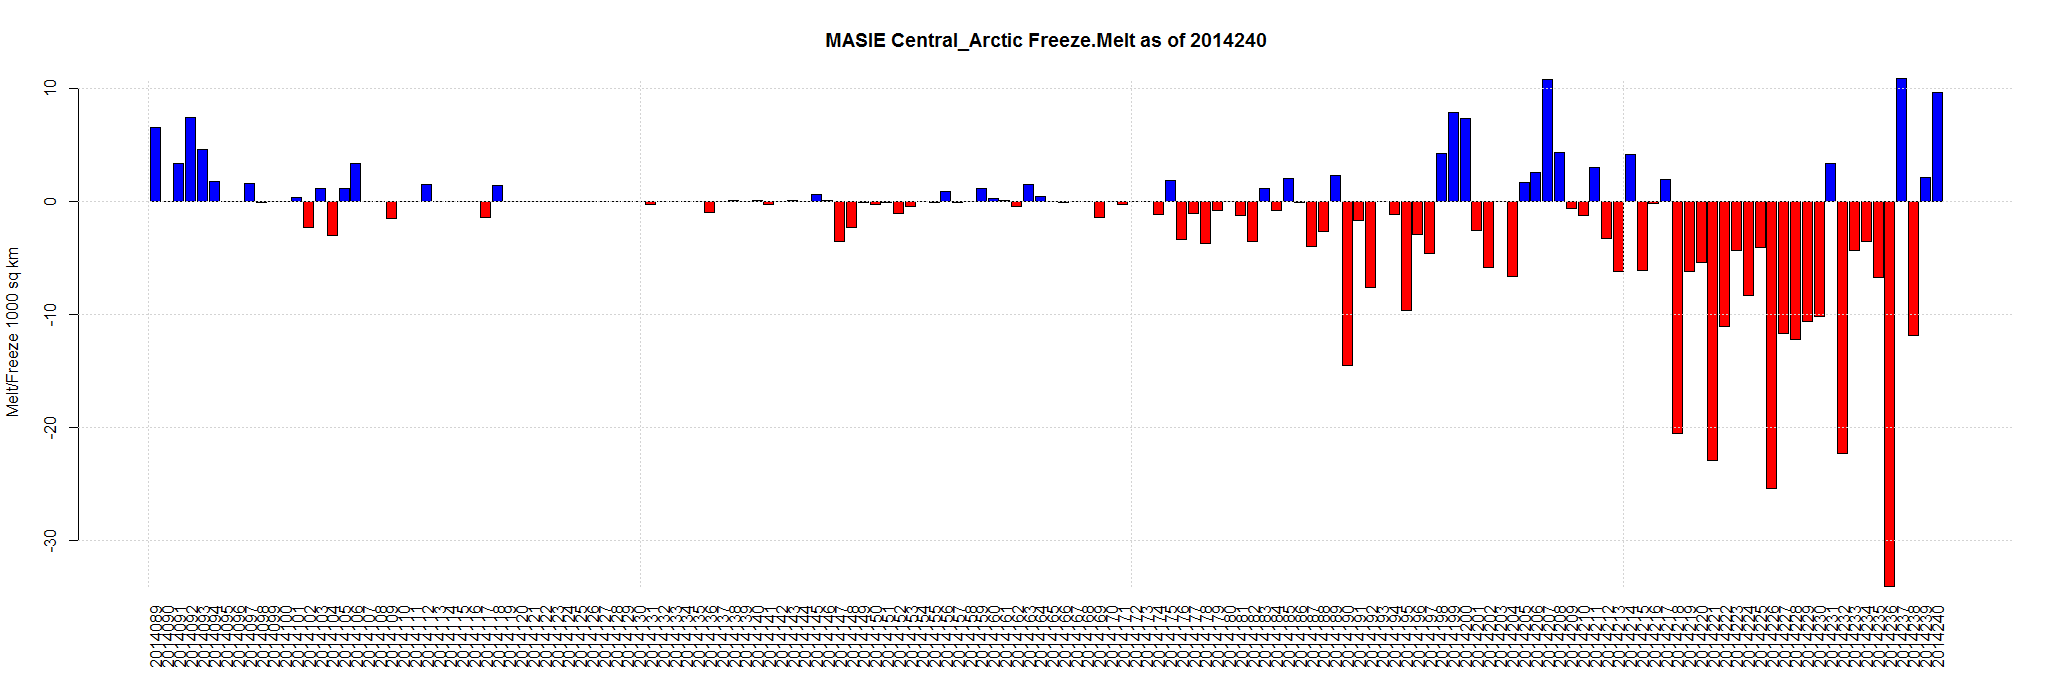
Aug 29 2014 MASIE Update – Smallish Melt – Central Arctic Up
Data here. Click for bigger.

| Region | 153 days ago | End | Last 152 | Last 28 | Last 14 | Last 7 | Last 3 | Last 1 |
| East Siberian Sea | 1,087,137 | 526,531 | -560,606 | -403,086 | -135,058 | -57,657 | -20,196 | -9,184 |
| Kara Sea | 933,859 | 141,560 | -792,300 | -208,394 | -61,807 | -19,750 | -22,995 | -9,136 |
| Hudson Bay | 1,260,903 | 42,660 | -1,218,243 | -126,611 | -50,283 | -7,223 | -7,078 | -8,785 |
| Barents Sea | 645,917 | 146,158 | -499,759 | 53,791 | 35,795 | 22,362 | 8,900 | -5,406 |
| Greenland Sea | 603,416 | 237,962 | -365,454 | -114,575 | -42,848 | -16,280 | -7,868 | -5,337 |
| Beaufort Sea | 1,070,445 | 719,292 | -351,153 | -127,641 | -57,714 | 14,690 | 7,173 | -3,917 |
| Laptev Sea | 897,845 | 23,140 | -874,705 | -224,482 | -37,409 | 4,939 | 3,417 | -1,987 |
| Chukchi Sea | 966,006 | 369,392 | -596,614 | -237,721 | -129,618 | -45,495 | -36,169 | -426 |
| Baffin Bay Gulf of St. Lawrence | 1,688,530 | 14,444 | -1,674,087 | -62,523 | -465 | 4,183 | -2,978 | 0 |
| Bering Sea | 697,324 | 0 | -697,324 | 0 | 0 | 0 | 0 | 0 |
| Baltic Sea | 15,337 | 0 | -15,337 | 0 | 0 | 0 | 0 | 0 |
| Sea of Okhotsk | 853,240 | 0 | -853,240 | 0 | 0 | 0 | 0 | 0 |
| Yellow Sea | 0 | 0 | 0 | 0 | 0 | 0 | 0 | 0 |
| Canadian Archipelago | 853,214 | 512,969 | -340,245 | -176,859 | -25,011 | -4,652 | -980 | 7,418 |
| Central Arctic | 3,221,921 | 2,991,393 | -230,528 | -215,618 | -101,321 | -33,385 | -7 | 9,660 |
| Northern Hemisphere (Total) | 14,805,115 | 5,726,644 | -9,078,471 | -1,843,719 | -605,737 | -138,268 | -78,780 | -27,101 |
| NH (Average Loss per Day) | -59,336 | -65,847 | -43,267 | -19,753 | -26,260 | -27,101 |
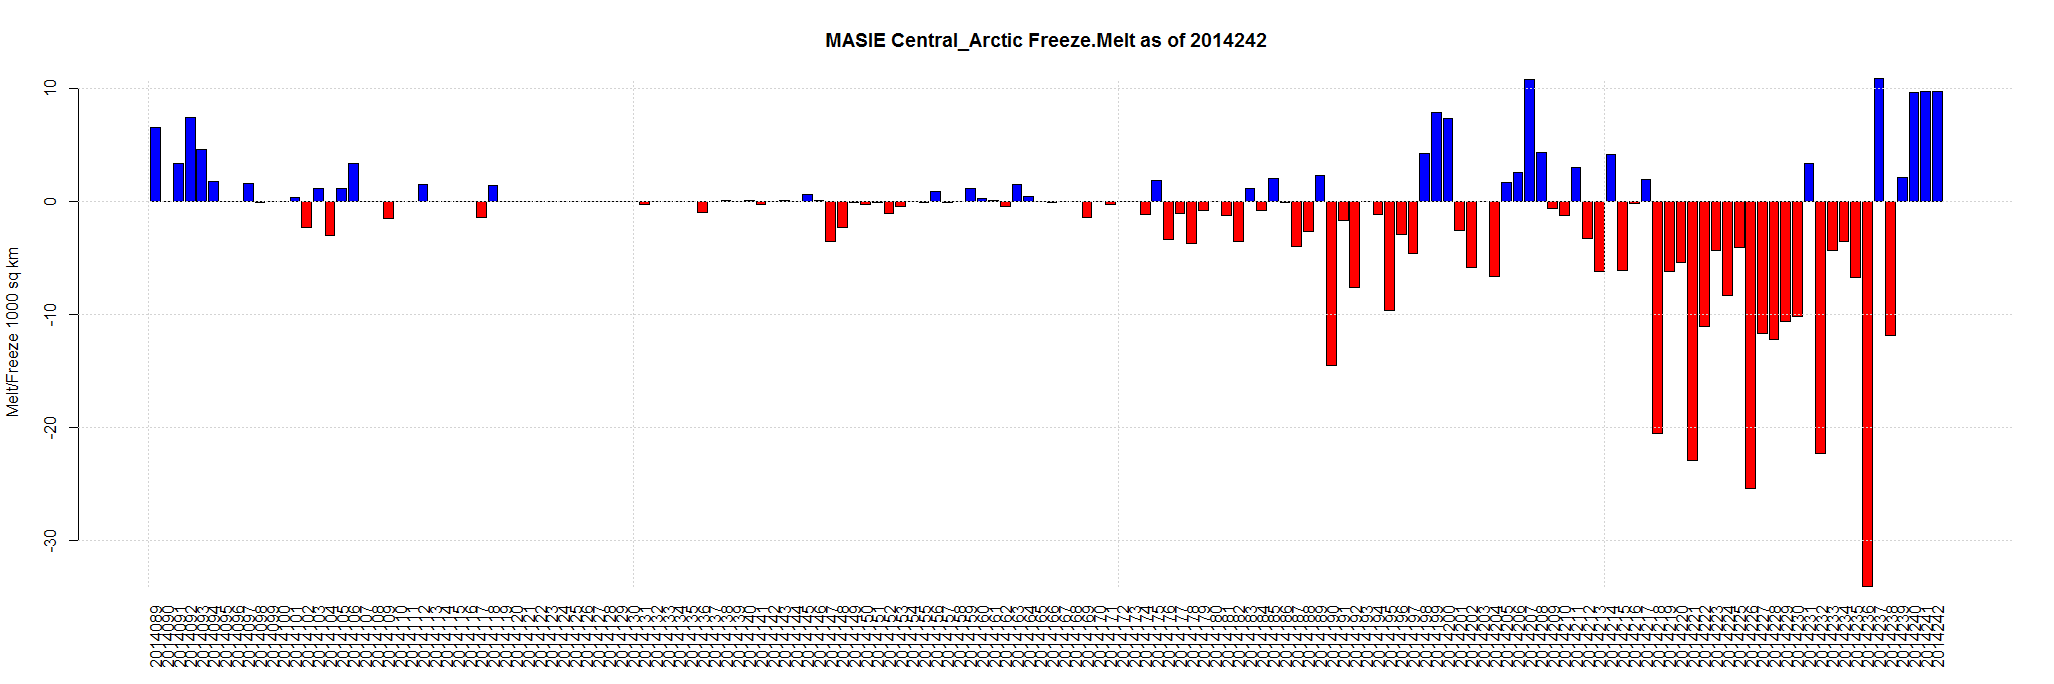
Aug 28 2014 MASIE Update – The last 7 days have been up and down. 6 regions gained over last day (see at bottom) and 5 of those have a positive change over 3 days.
Data here. Click for bigger.
See how bizarre the Barents Sea is compare to previous 4 years.:
| Region | 152 days ago | End | Last 151 | Last 28 | Last 14 | Last 7 | Last 3 | Last 1 |
| Kara Sea | 933,859 | 150,696 | -783,163 | -197,441 | -56,246 | -6,863 | -15,760 | -7,781 |
| East Siberian Sea | 1,087,137 | 535,715 | -551,422 | -399,480 | -160,613 | -52,800 | -24,345 | -5,451 |
| Chukchi Sea | 966,006 | 369,819 | -596,188 | -243,128 | -135,602 | -55,842 | -35,034 | -3,888 |
| Baffin Bay Gulf of St. Lawrence | 1,688,530 | 14,444 | -1,674,087 | -62,007 | -6,262 | 4,287 | 4,201 | -2,470 |
| Greenland Sea | 603,416 | 243,299 | -360,116 | -113,522 | -36,738 | -5,499 | -2,979 | -136 |
| Bering Sea | 697,324 | 0 | -697,324 | 0 | 0 | 0 | 0 | 0 |
| Baltic Sea | 15,337 | 0 | -15,337 | 0 | 0 | 0 | 0 | 0 |
| Sea of Okhotsk | 853,240 | 0 | -853,240 | 0 | 0 | 0 | 0 | 0 |
| Yellow Sea | 0 | 0 | 0 | 0 | 0 | 0 | 0 | 0 |
| Canadian Archipelago | 853,214 | 505,552 | -347,663 | -189,321 | -47,791 | -5,478 | -9,943 | 1,398 |
| Central Arctic | 3,221,921 | 2,981,734 | -240,188 | -228,505 | -136,325 | -47,407 | 1,203 | 2,145 |
| Beaufort Sea | 1,070,445 | 723,209 | -347,236 | -115,035 | -66,257 | 19,482 | 11,937 | 5,847 |
| Hudson Bay | 1,260,903 | 51,445 | -1,209,458 | -113,934 | -41,690 | -7,698 | 1,707 | 6,169 |
| Barents Sea | 645,917 | 151,565 | -494,353 | 67,628 | 39,410 | 42,304 | 19,985 | 7,908 |
| Laptev Sea | 897,845 | 25,126 | -872,718 | -236,263 | -53,555 | 6,063 | 3,703 | 9,965 |
| Northern Hemisphere (Total) | 14,805,115 | 5,753,745 | -9,051,370 | -1,831,007 | -701,669 | -109,452 | -45,325 | 13,705 |
| NH (Average Loss per Day) | -59,548 | -65,393 | -50,119 | -15,636 | -15,108 | 13,705 |
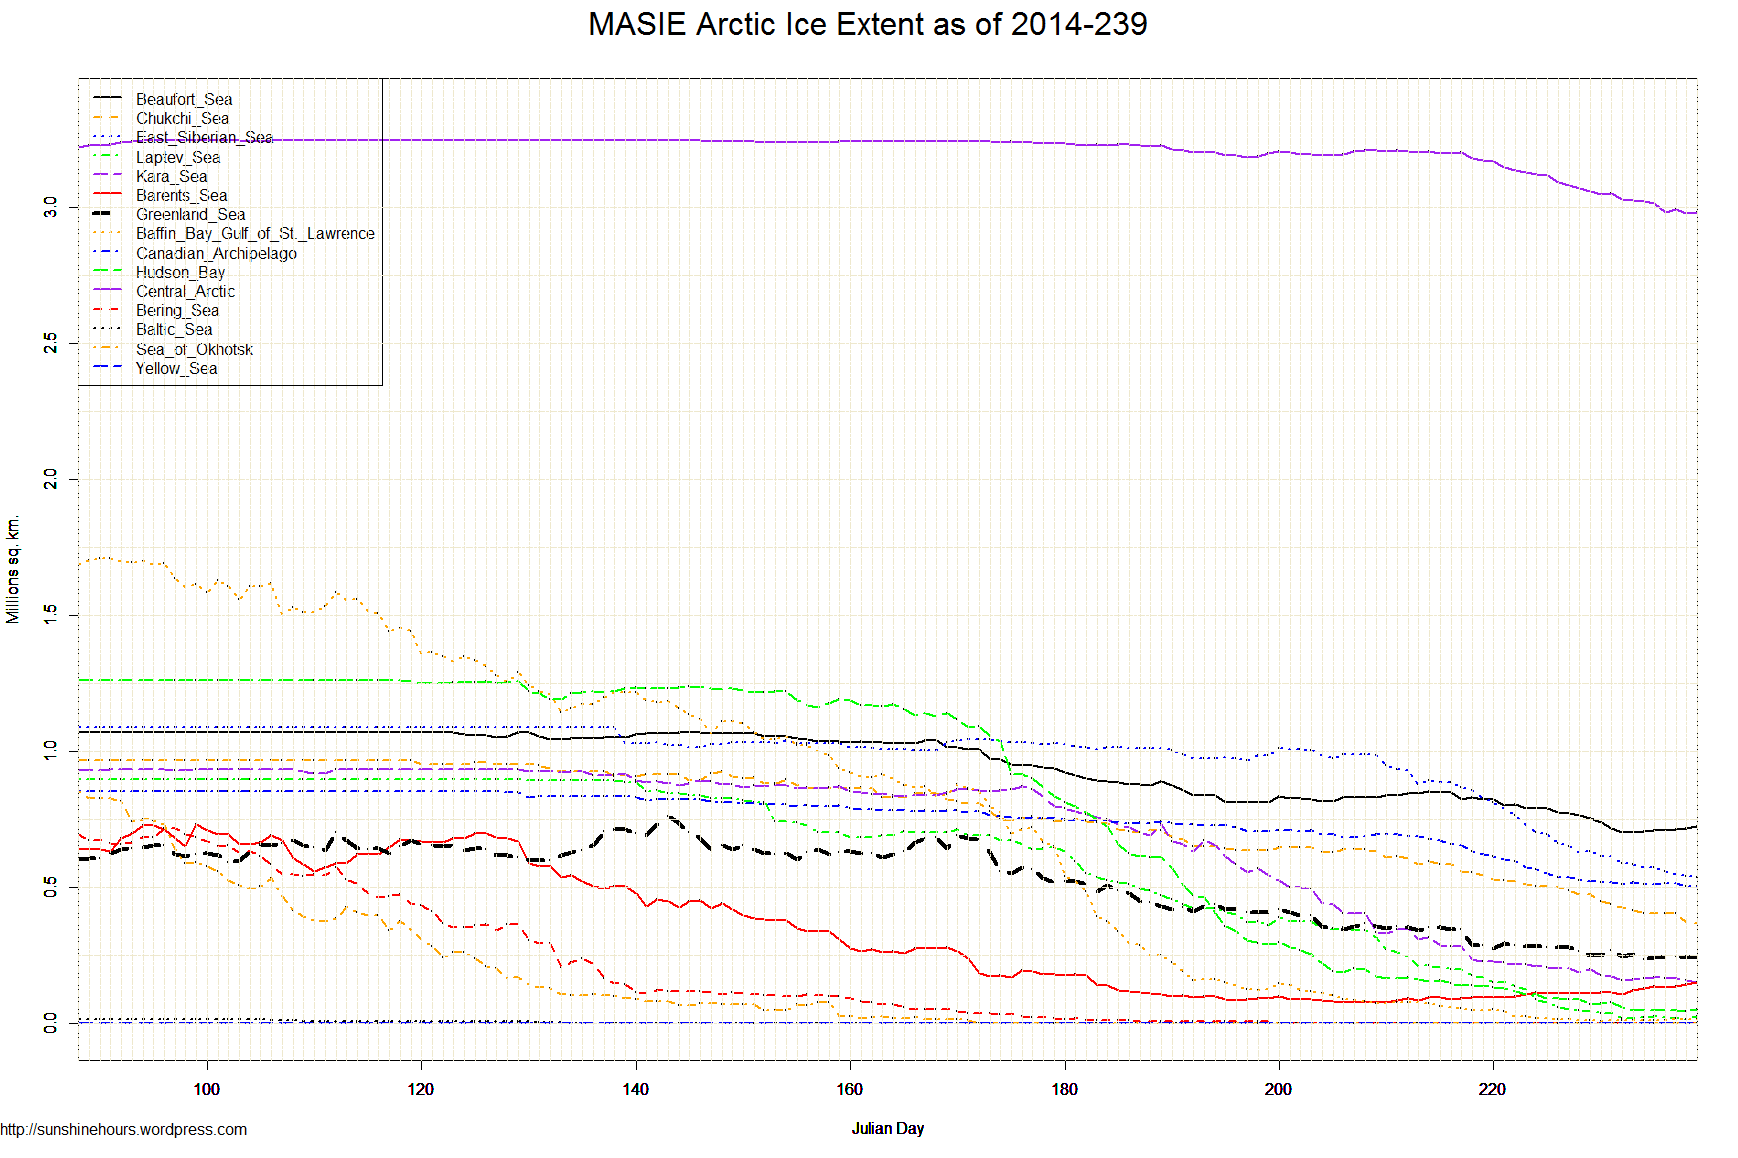
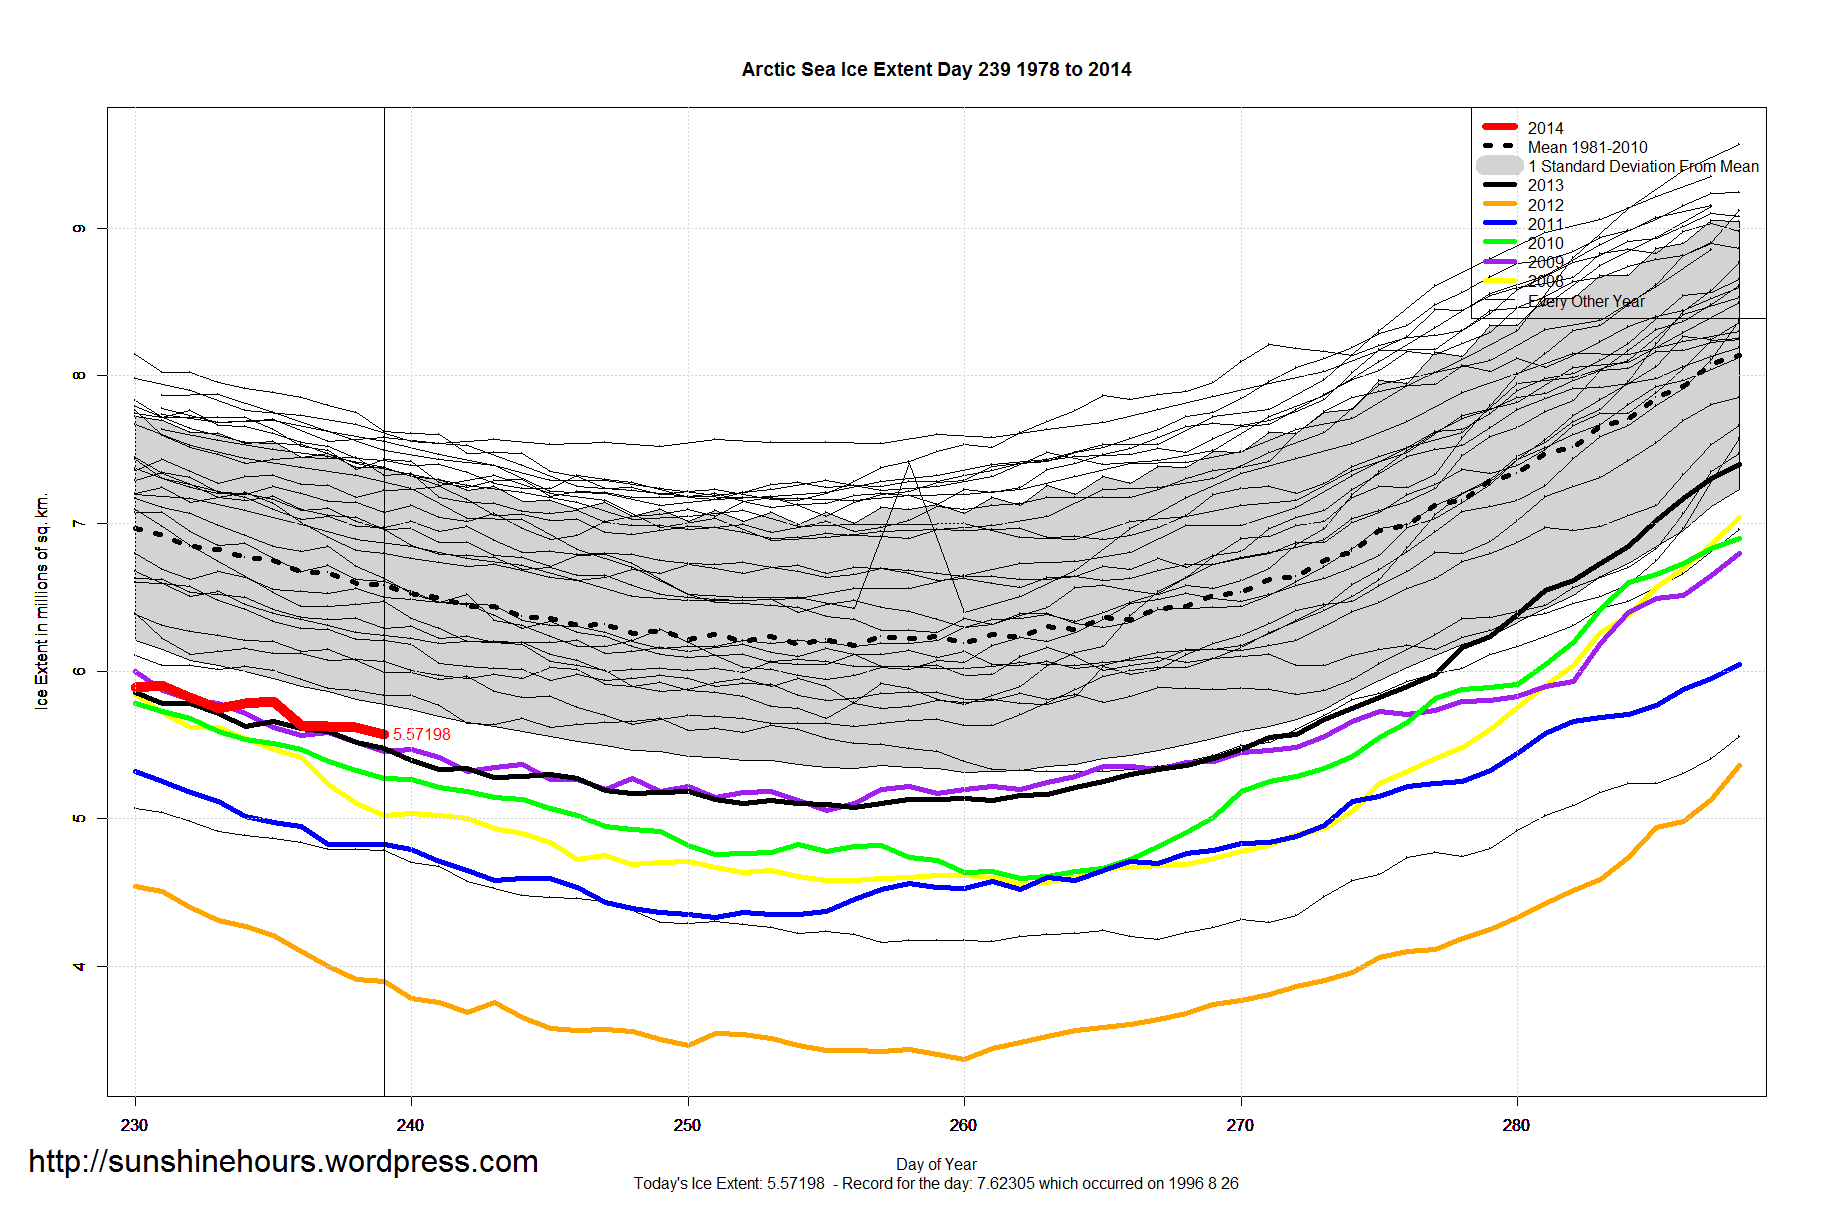
Arctic Sea Ice Extent Aug 28 2014 – -1,075,000 sq km below the 1981-2010 mean. Data for Day 239. Data here.
2006 was the last time Arctic Sea Ice Extent was higher for day 239.

Aug 25 2014 MASIE Update – Smallish Melt – Barents and Beaufort Increase
Data here. Click for bigger.

| Region | 151 days ago | End | Last 150 | Last 28 | Last 14 | Last 7 | Last 3 | Last 1 |
| Chukchi Sea | 966,006 | 373,707 | -592,300 | -237,929 | -131,714 | -63,872 | -31,146 | -31,854 |
| Central Arctic | 3,221,921 | 2,979,589 | -242,332 | -227,666 | -142,539 | -71,843 | -34,947 | -11,812 |
| Canadian Archipelago | 853,214 | 504,154 | -349,061 | -191,839 | -61,886 | -15,376 | -7,870 | -9,796 |
| Kara Sea | 933,859 | 158,477 | -775,382 | -171,979 | -53,037 | -15,174 | -11,515 | -6,078 |
| East Siberian Sea | 1,087,137 | 541,167 | -545,971 | -406,990 | -162,755 | -72,875 | -32,386 | -5,561 |
| Laptev Sea | 897,845 | 15,161 | -882,683 | -258,052 | -75,160 | -22,794 | -10,051 | -4,561 |
| Hudson Bay | 1,260,903 | 45,276 | -1,215,627 | -120,439 | -61,869 | -31,208 | -4,607 | -4,462 |
| Greenland Sea | 603,416 | 243,436 | -359,980 | -106,561 | -39,529 | -26,351 | -1,387 | -2,394 |
| Baffin Bay Gulf of St. Lawrence | 1,688,530 | 16,914 | -1,671,617 | -57,585 | -4,010 | 5,832 | 6,671 | -508 |
| Bering Sea | 697,324 | 0 | -697,324 | 0 | 0 | 0 | 0 | 0 |
| Baltic Sea | 15,337 | 0 | -15,337 | 0 | 0 | 0 | 0 | 0 |
| Sea of Okhotsk | 853,240 | 0 | -853,240 | 0 | 0 | 0 | 0 | 0 |
| Yellow Sea | 0 | 0 | 0 | 0 | 0 | 0 | 0 | 0 |
| Beaufort Sea | 1,070,445 | 717,362 | -353,083 | -122,652 | -72,103 | 1,370 | 6,090 | 5,243 |
| Barents Sea | 645,917 | 143,656 | -502,261 | 66,980 | 30,224 | 29,929 | 6,447 | 6,399 |
| Northern Hemisphere (Total) | 14,805,115 | 5,740,040 | -9,065,075 | -1,834,712 | -774,376 | -282,362 | -114,701 | -65,384 |
| NH (Average Loss per Day) | -60,034 | -65,525 | -55,313 | -40,337 | -38,234 | -65,384 |
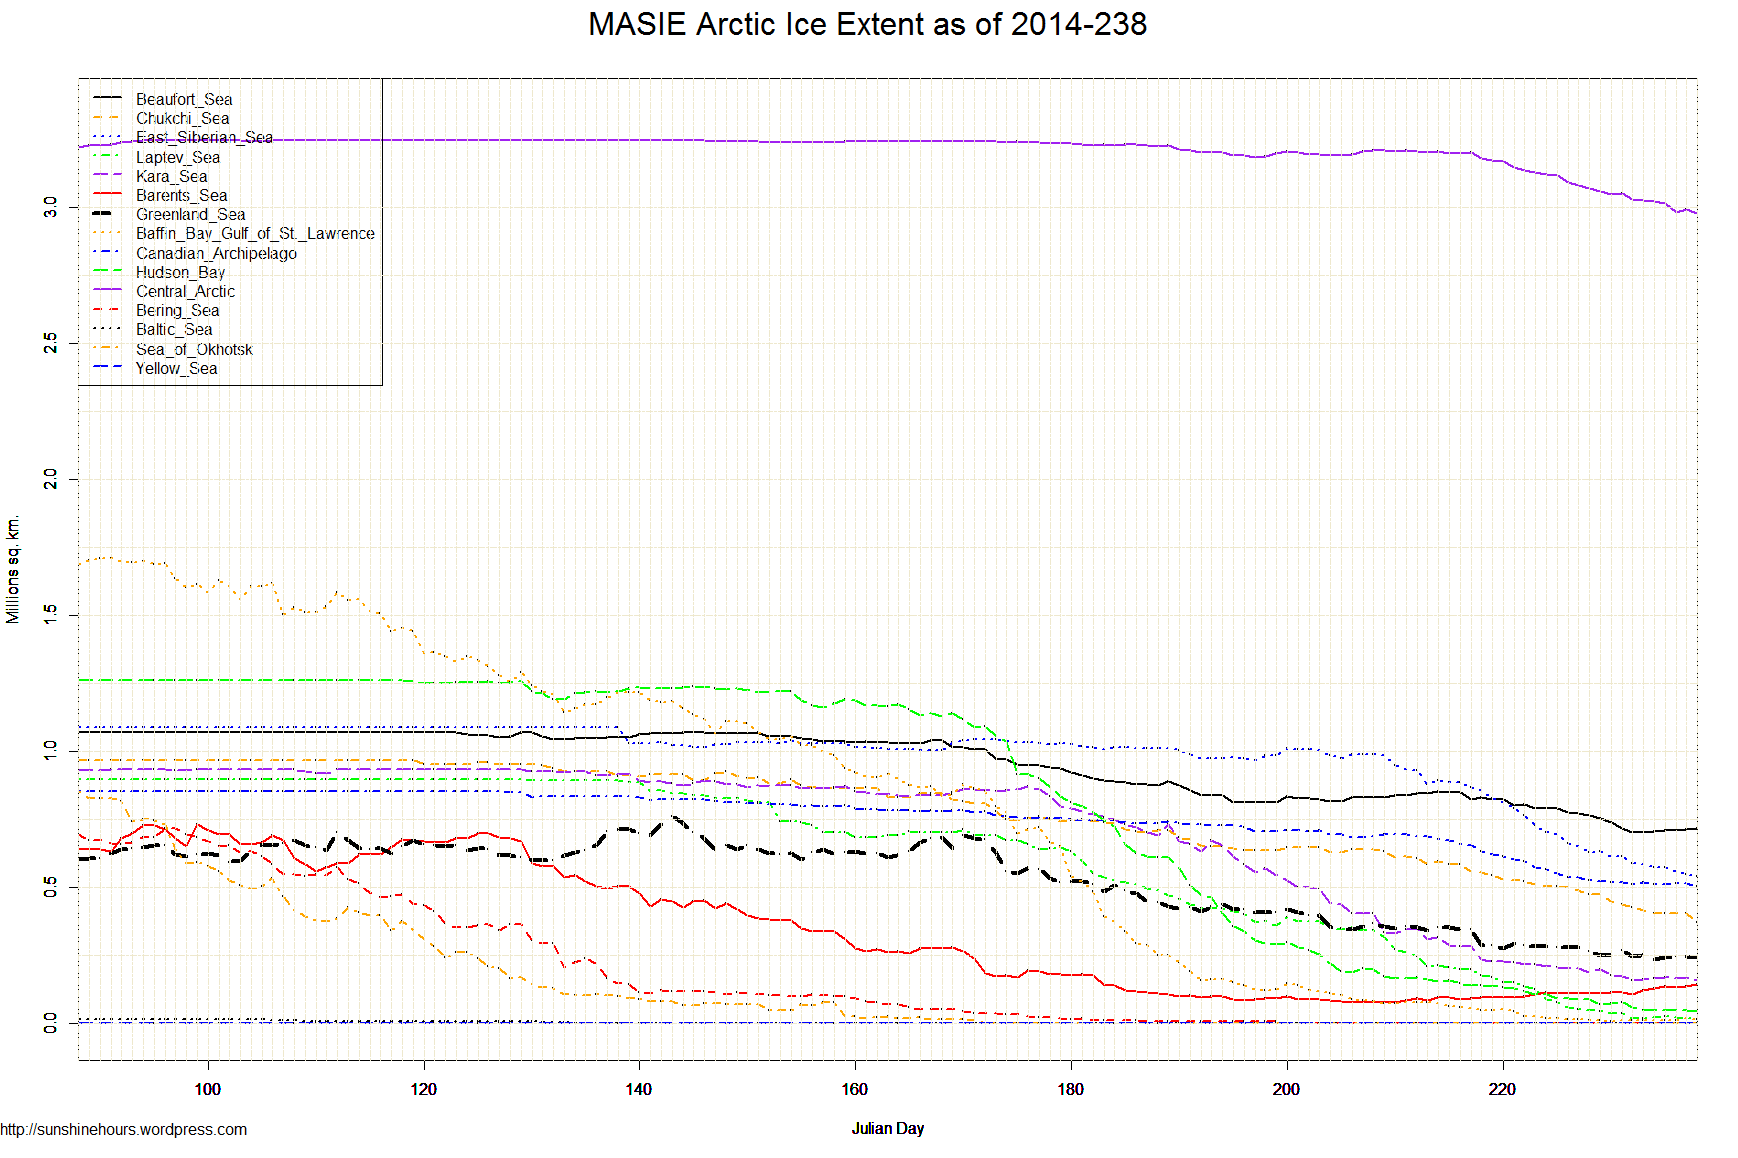
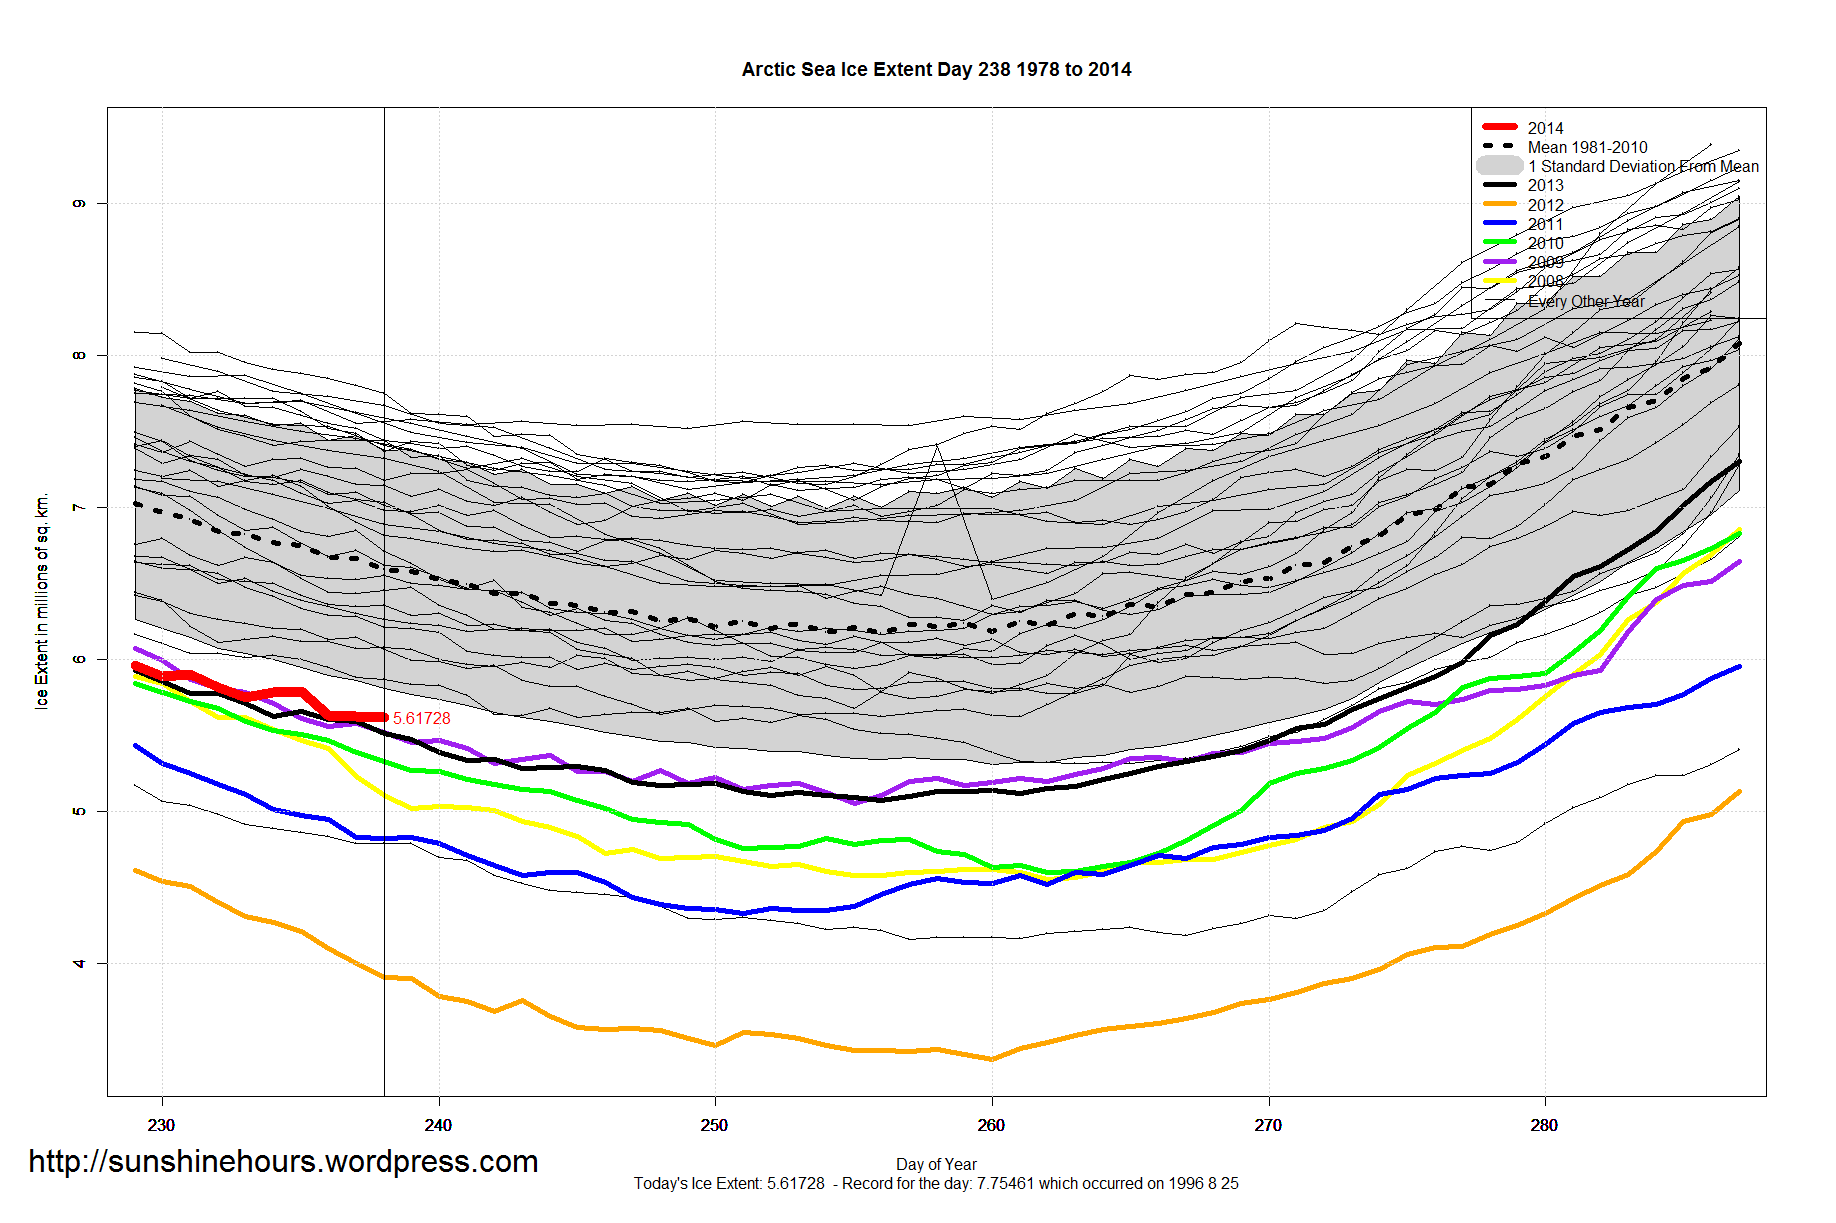
Arctic Sea Ice Extent Aug 27 2014 – -1,069,000 sq km below the 1981-2010 mean. Data for Day 238. Data here.
Drop of Only 18,000 Over Last 2 Days. 2014 seems to be most similar to 2009 and 2013.
2009’s minimum was 5.05488 million sq km on day 255
2013’s minimum was 5.07709 million sq km on day 256
But I’m not making a prediction.

