July 14 2014 MASIE Update – Hudson Bay Big Loser Over Last One Day
Data here.
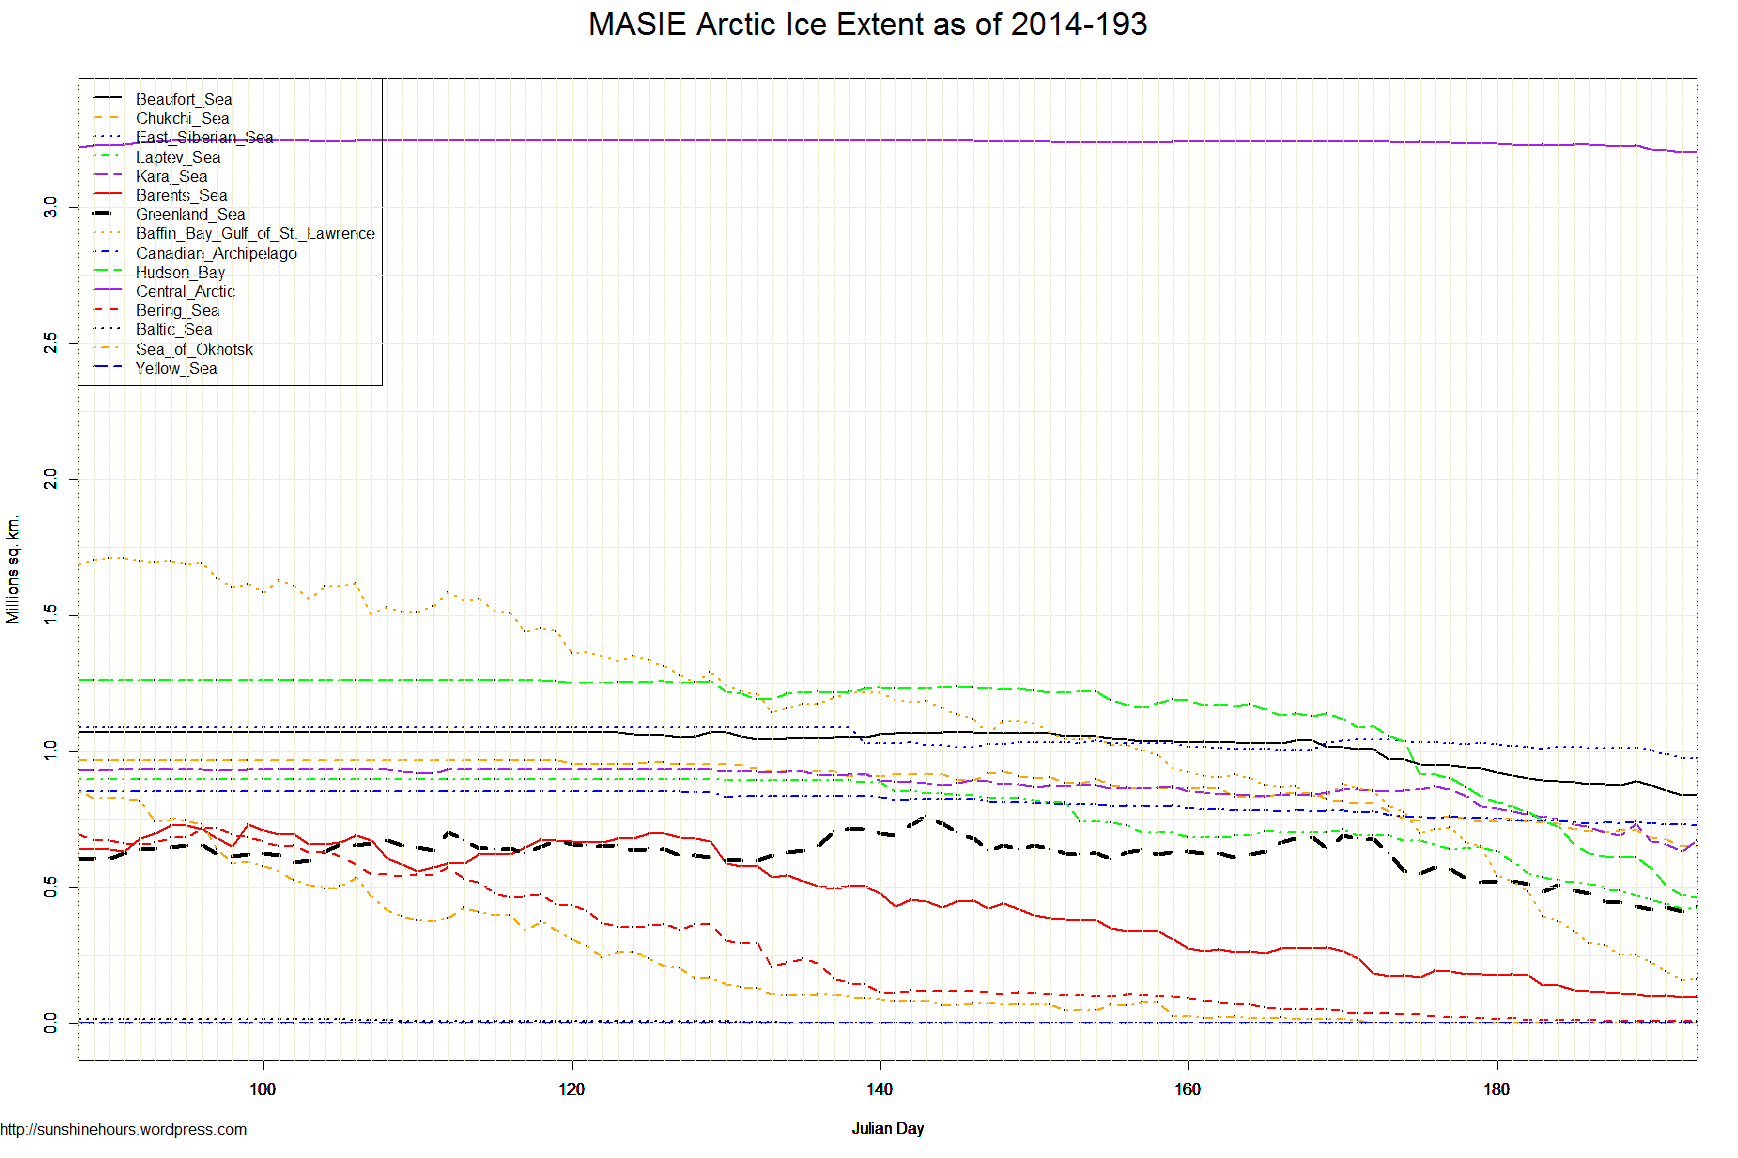
| Region | 107 days ago | End | Last 106 | Last 28 | Last 14 | Last 7 | Last 3 | Last 1 |
| Hudson Bay | 1,260,903 | 406,964 | -853,939 | -726,076 | -408,057 | -209,574 | -101,757 | -58,858 |
| Kara Sea | 933,859 | 655,411 | -278,448 | -184,594 | -136,631 | -47,591 | -3,513 | -16,365 |
| Central Arctic | 3,221,921 | 3,202,250 | -19,671 | -41,408 | -31,646 | -25,233 | -8,703 | -1,165 |
| Baffin Bay Gulf of St. Lawrence | 1,688,530 | 162,908 | -1,525,623 | -704,270 | -377,498 | -126,132 | -28,971 | -8 |
| Beaufort Sea | 1,070,445 | 840,590 | -229,855 | -189,821 | -84,172 | -39,002 | -18,467 | 0 |
| Chukchi Sea | 966,006 | 650,853 | -315,153 | -195,961 | -94,618 | -51,560 | -25,674 | 0 |
| East Siberian Sea | 1,087,137 | 973,657 | -113,480 | -31,696 | -53,766 | -36,889 | -15,979 | 0 |
| Barents Sea | 645,917 | 98,574 | -547,343 | -177,243 | -80,046 | -16,321 | -4,267 | 0 |
| Canadian Archipelago | 853,214 | 728,778 | -124,436 | -53,040 | -22,601 | -9,276 | -4,244 | 0 |
| Bering Sea | 697,324 | 8,658 | -688,665 | -44,140 | -6,858 | -753 | 685 | 0 |
| Baltic Sea | 15,337 | 0 | -15,337 | 0 | 0 | 0 | 0 | 0 |
| Sea of Okhotsk | 853,240 | 0 | -853,240 | -21,293 | 0 | 0 | 0 | 0 |
| Yellow Sea | 0 | 0 | 0 | 0 | 0 | 0 | 0 | 0 |
| Laptev Sea | 897,845 | 423,784 | -474,061 | -280,427 | -208,127 | -74,531 | -15,312 | 2,029 |
| Greenland Sea | 603,416 | 437,902 | -165,514 | -229,769 | -85,758 | -11,725 | 11,712 | 5,184 |
| Northern Hemisphere (Total) | 14,805,115 | 8,591,471 | -6,213,643 | -2,880,125 | -1,590,166 | -648,955 | -214,826 | -69,182 |
| NH (Average Loss per Day) | -58,071 | -102,862 | -113,583 | -92,708 | -71,609 | -69,182 |