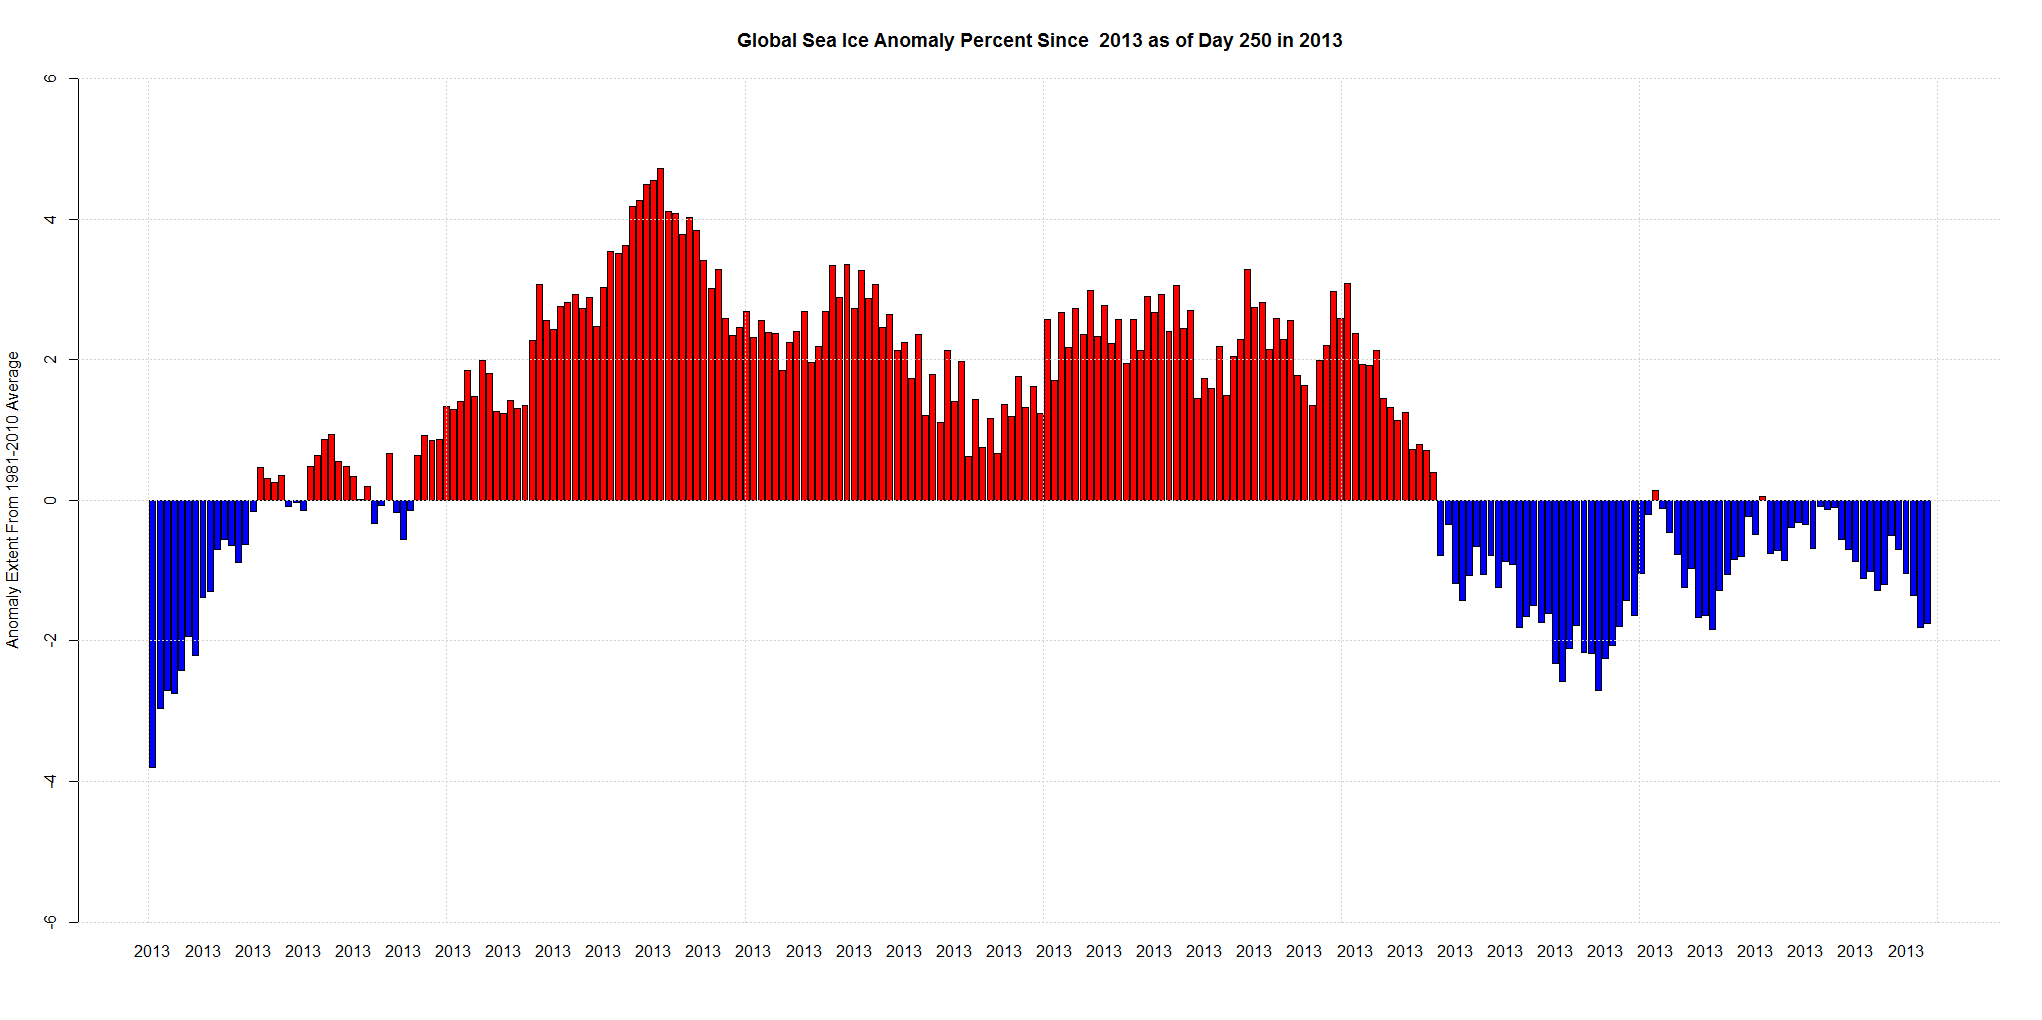
Right now the mean for the year for Global Sea Ice Anomaly percent is +0.9% above the 1981-2010 mean.
The anomaly have been over +4% earlier in the year and is now almost -2%.
Right now the mean for the year for Global Sea Ice Anomaly percent is +0.9% above the 1981-2010 mean.
The anomaly have been over +4% earlier in the year and is now almost -2%.
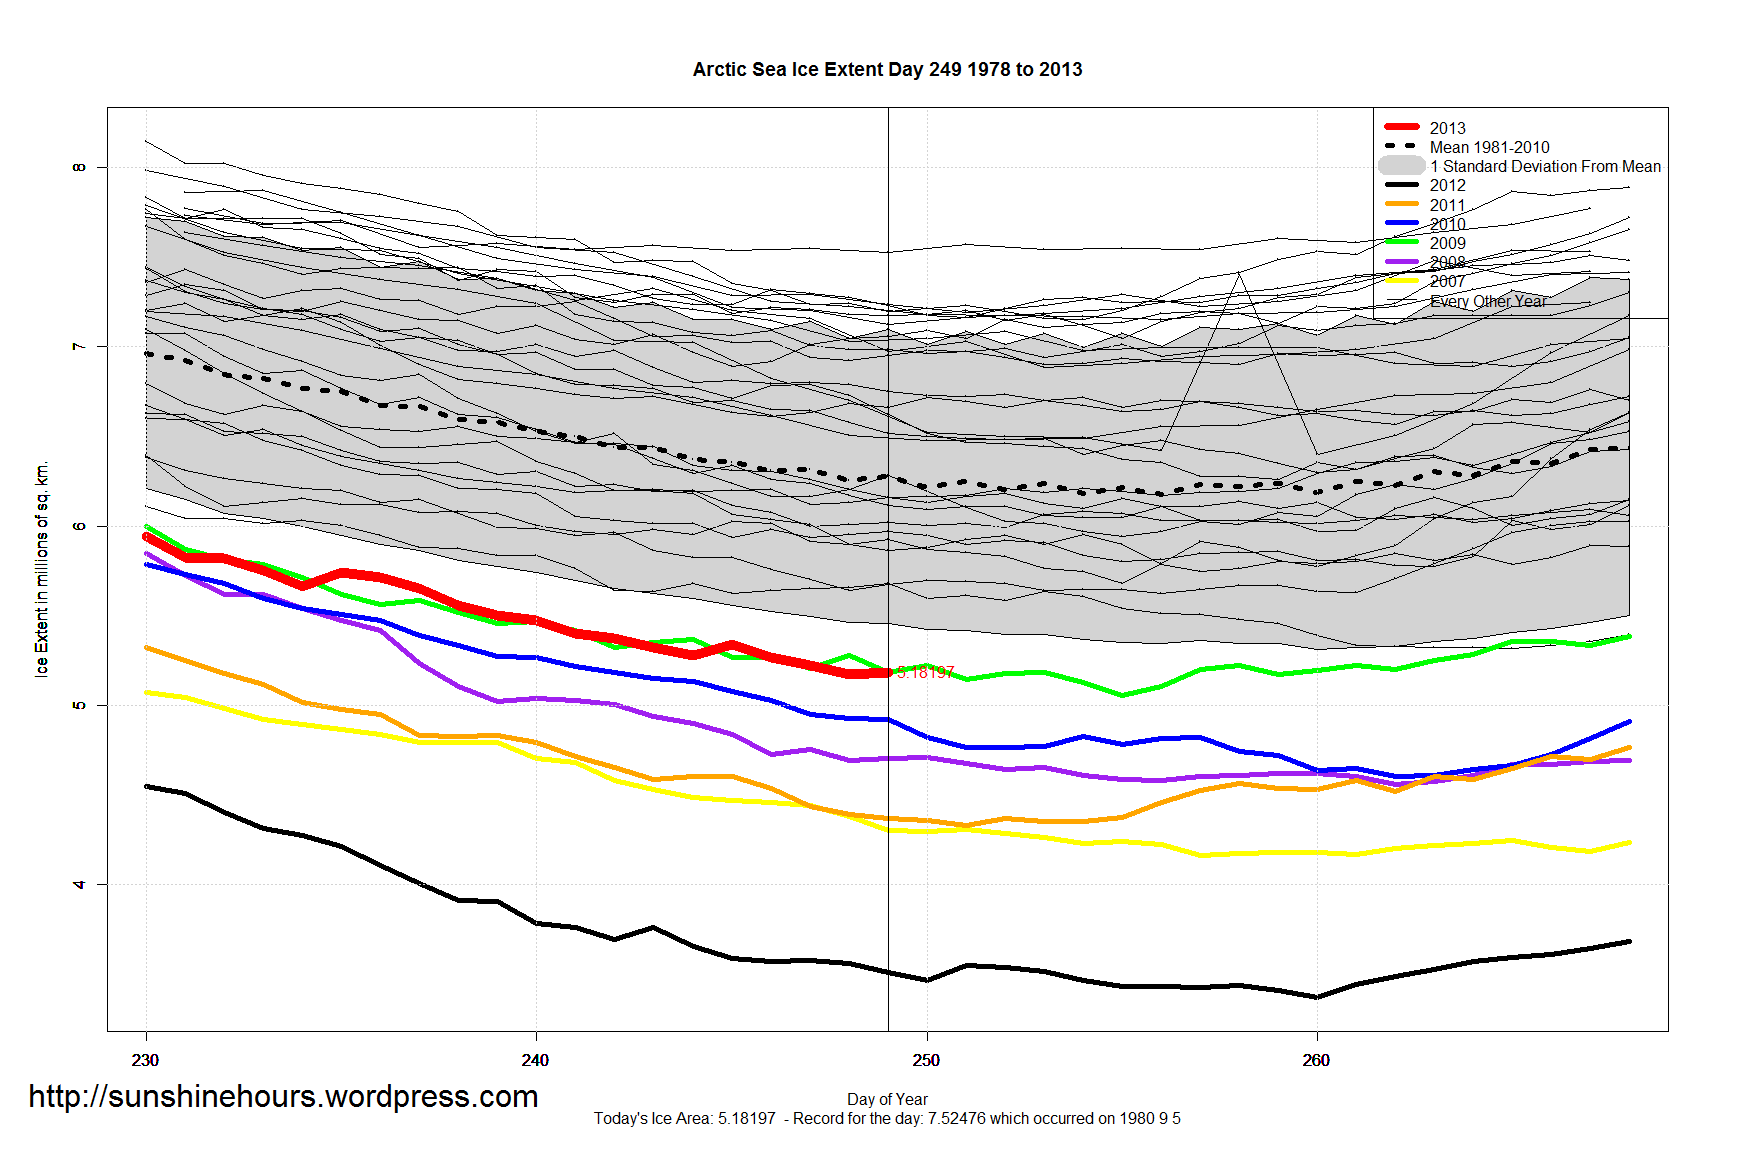
Arctic Sea Ice Extent increased for the 2nd day in a row. The increase was 19,270 sq km. Minimum is getting close. Yesterday was day 250. Day 248 is the lowest value for 2013.
If day 248 turned out to be the minimum, it would be tied for third earliest with 1994. 1987’s minimum was day 245. 1997’s was 246.


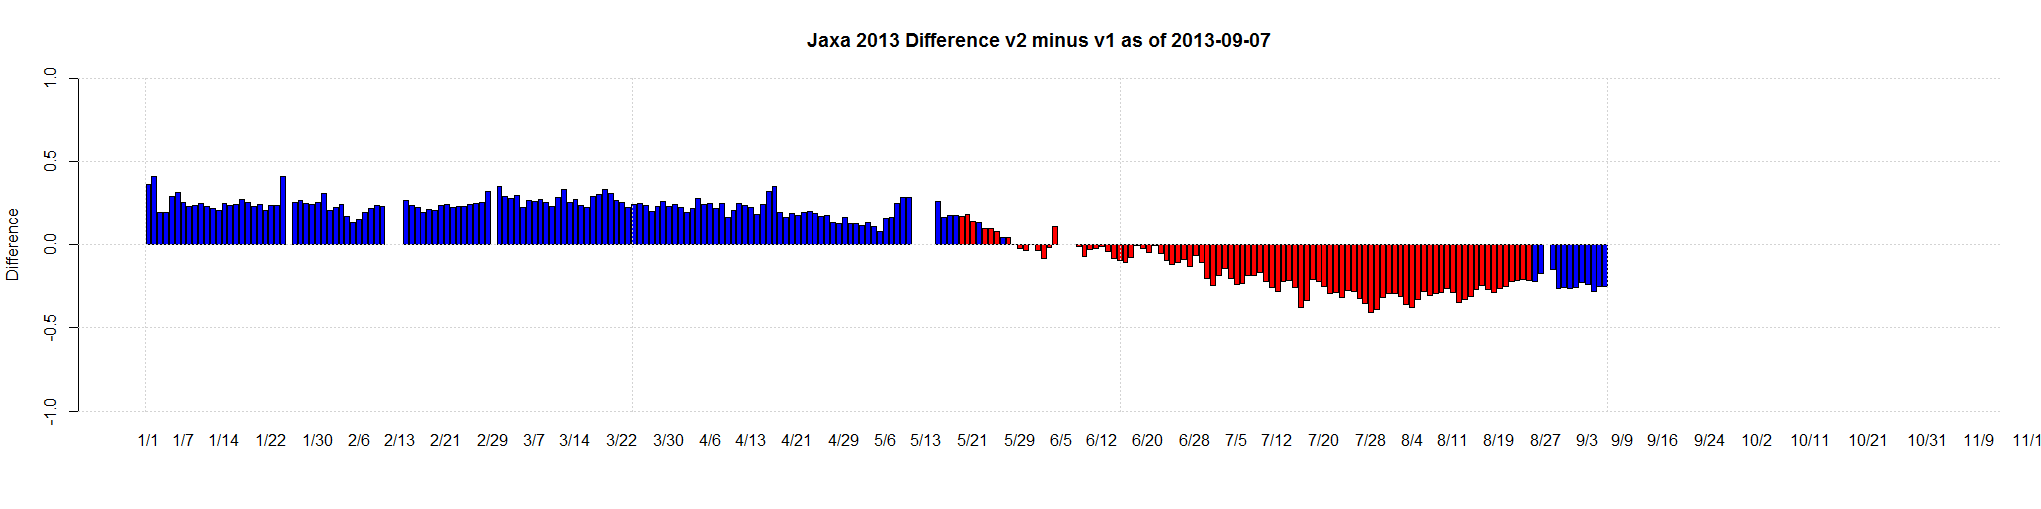
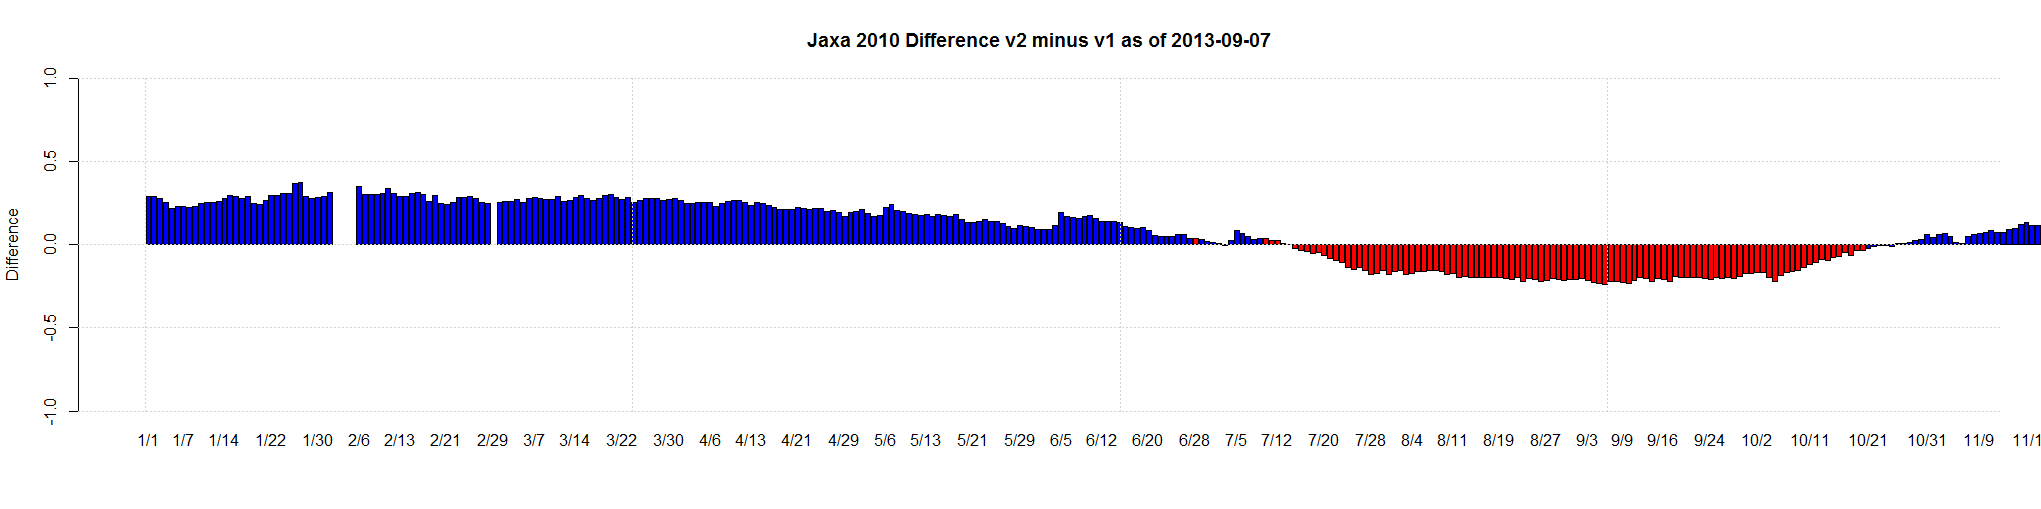
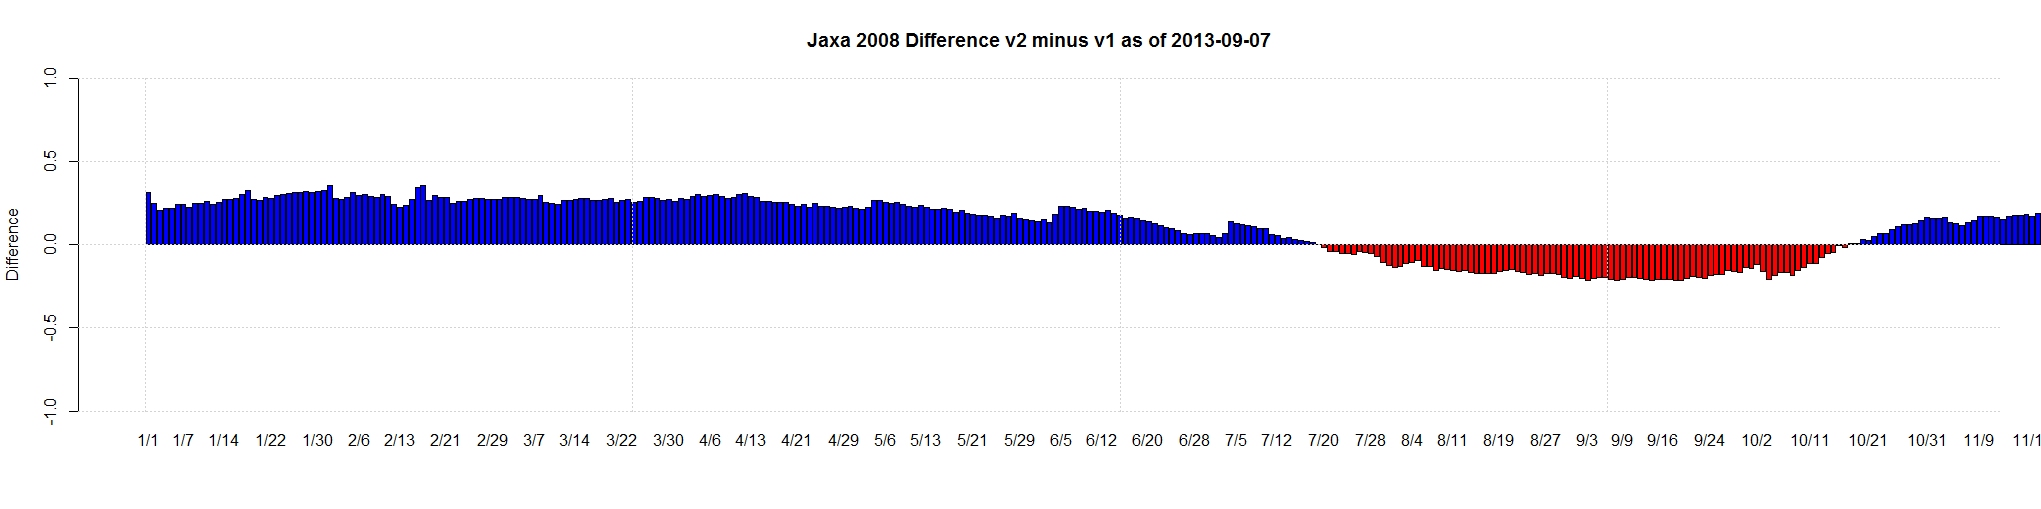
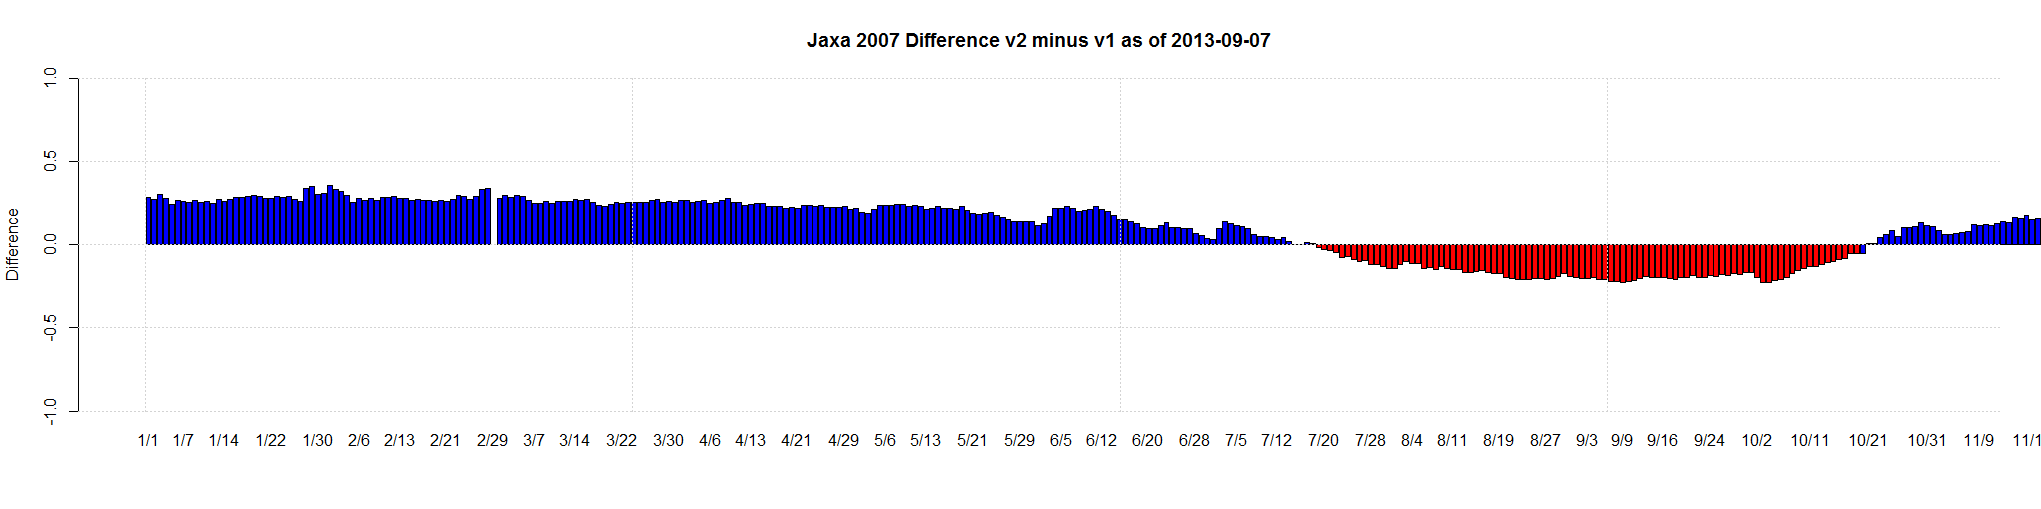
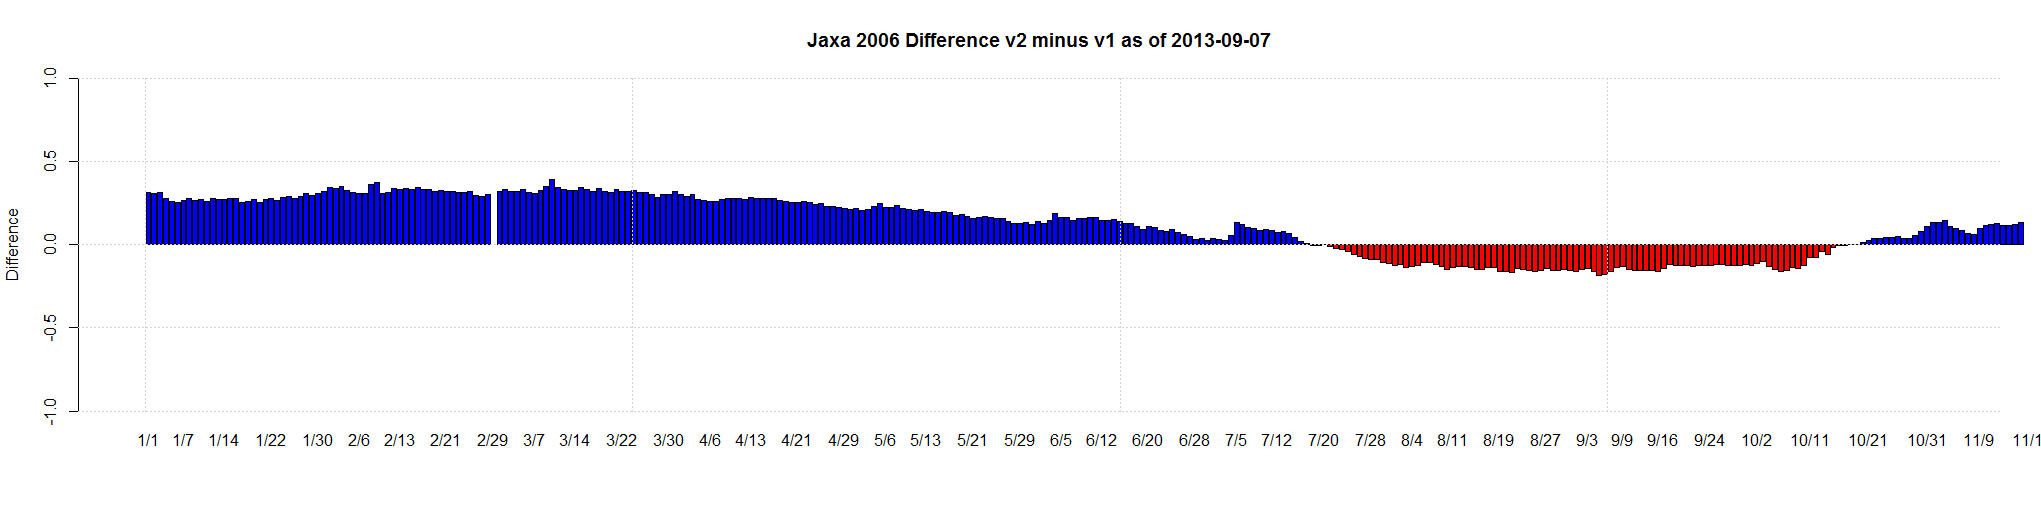
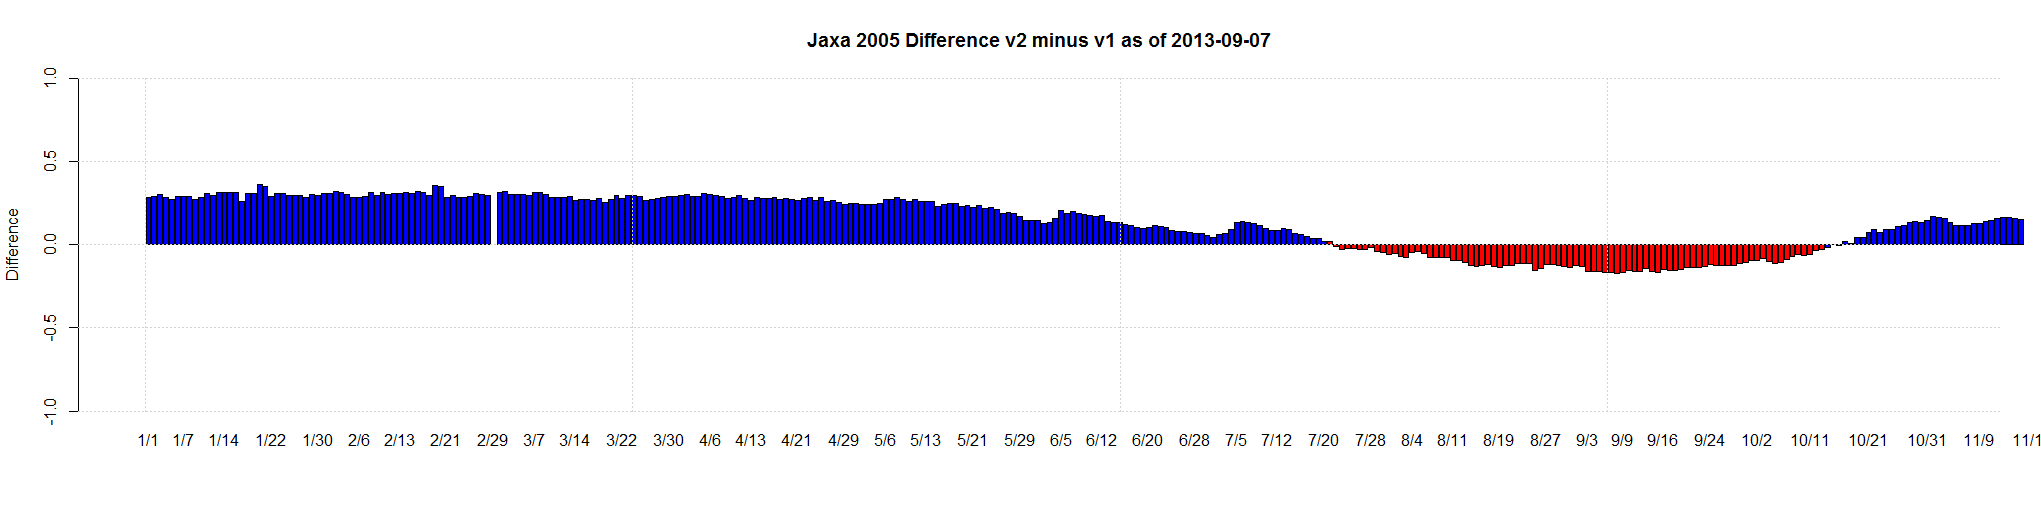
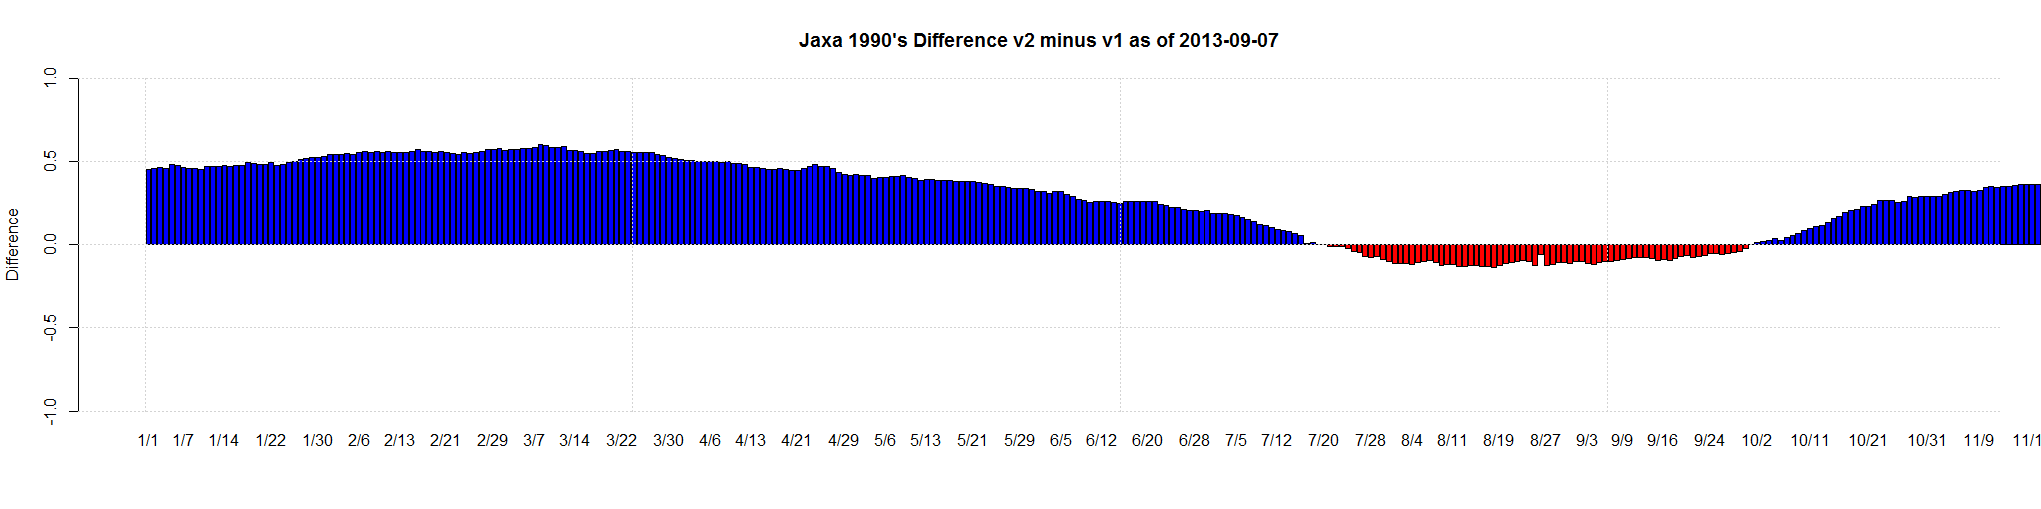
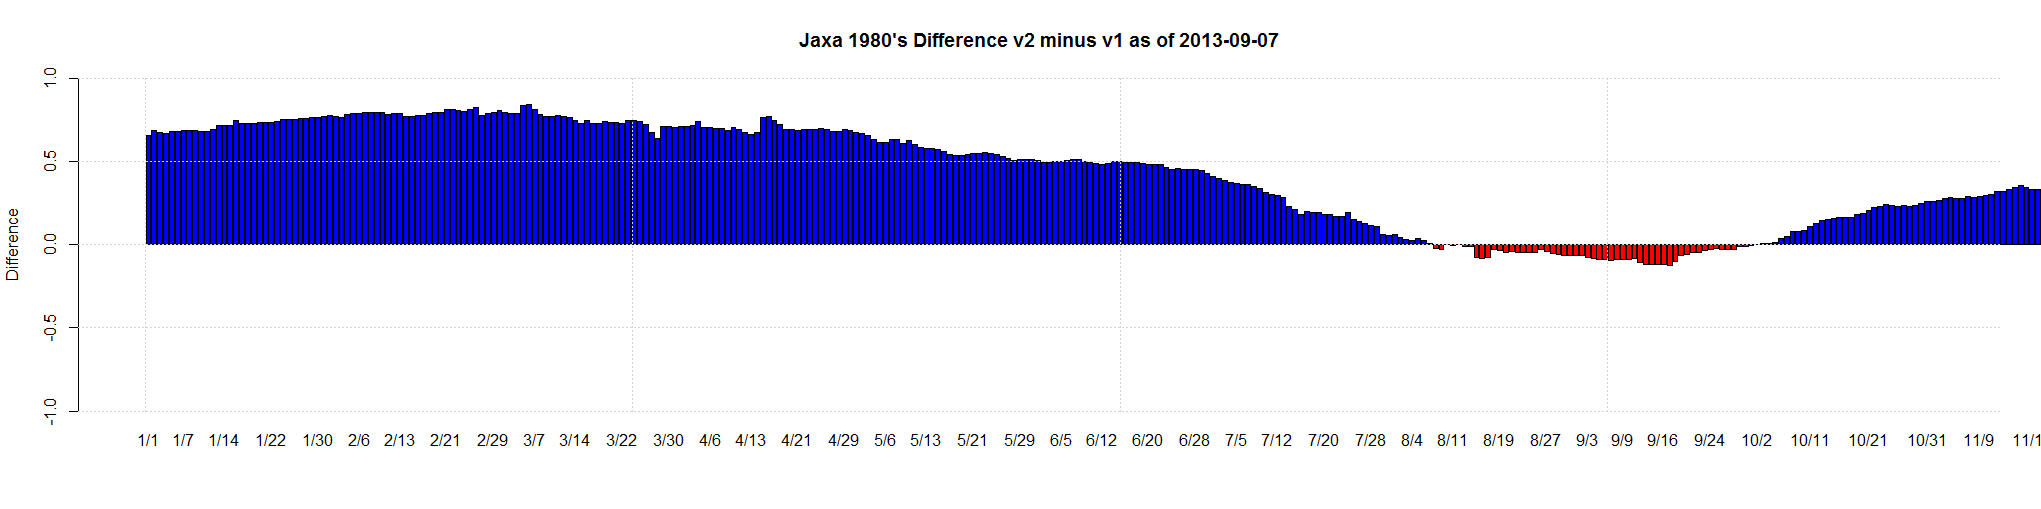
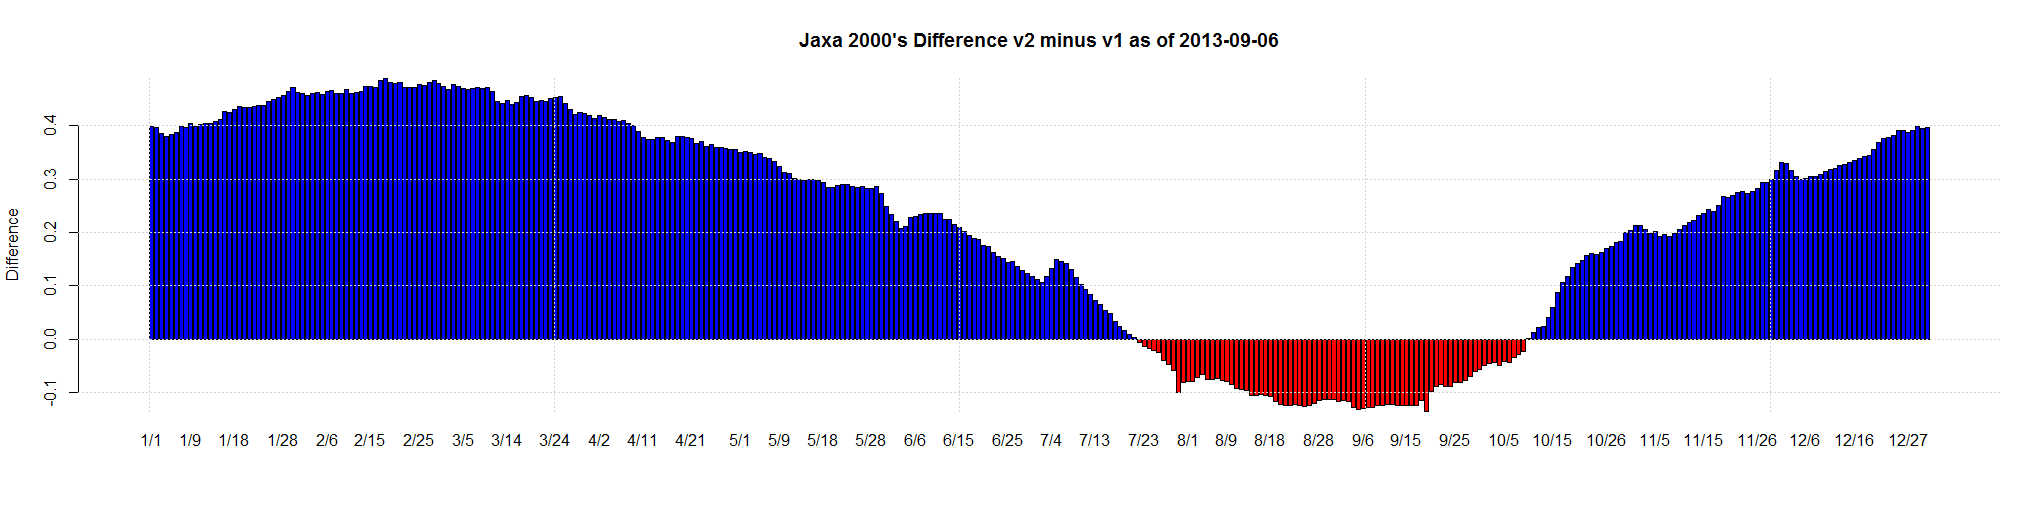
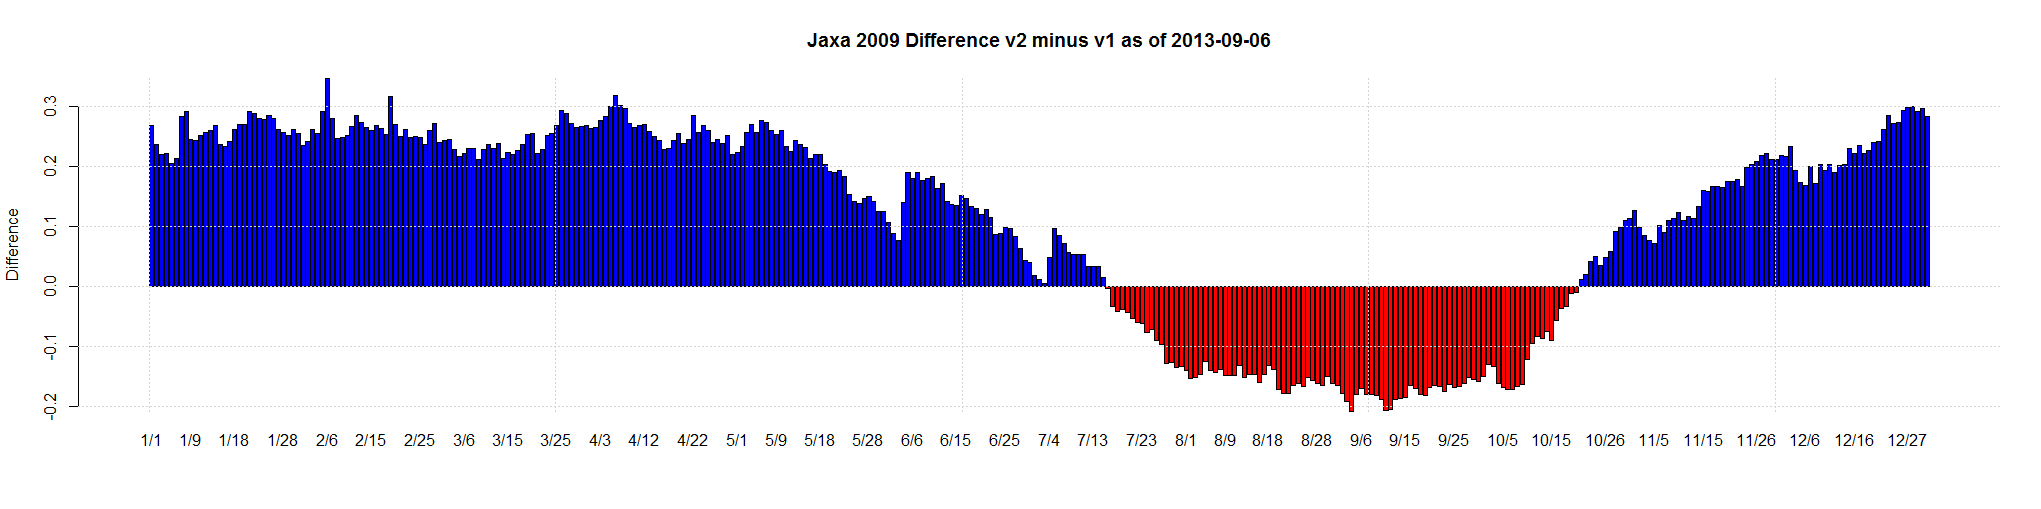
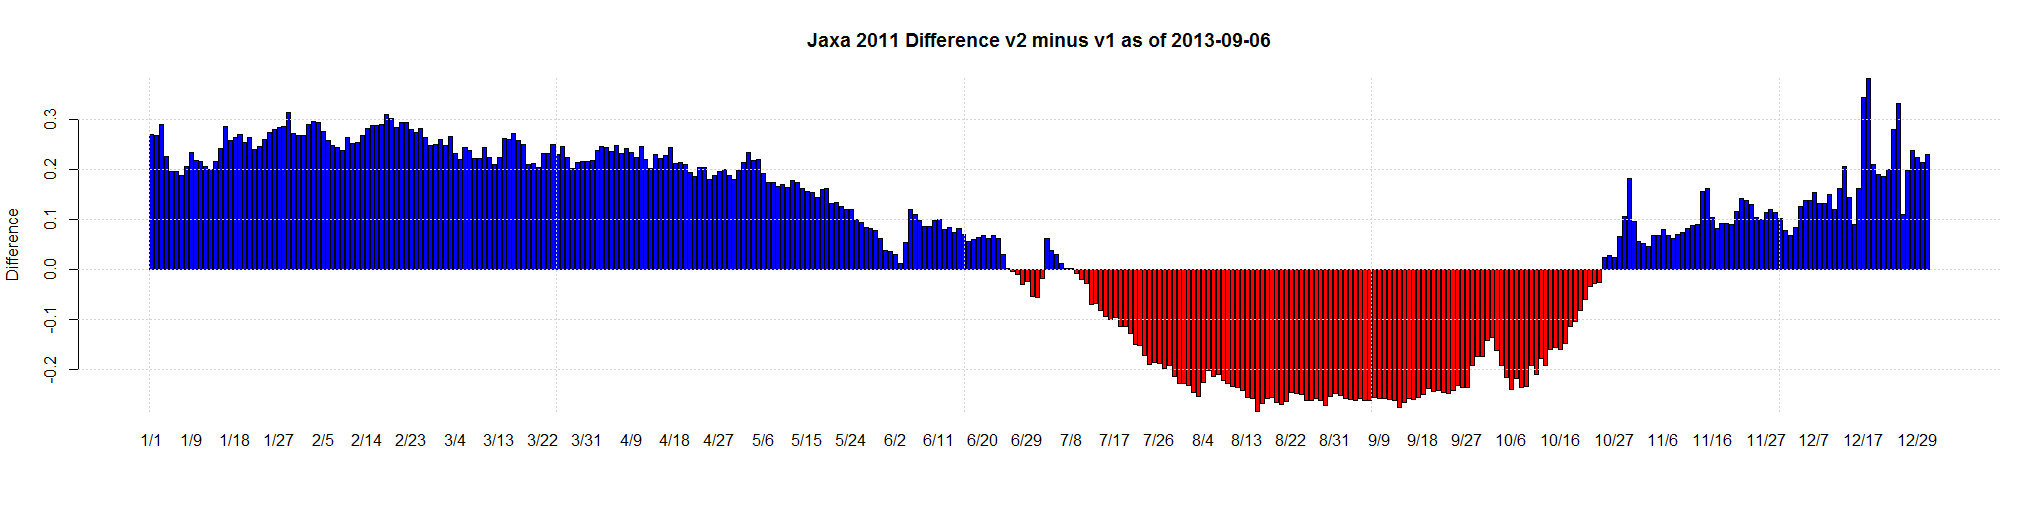
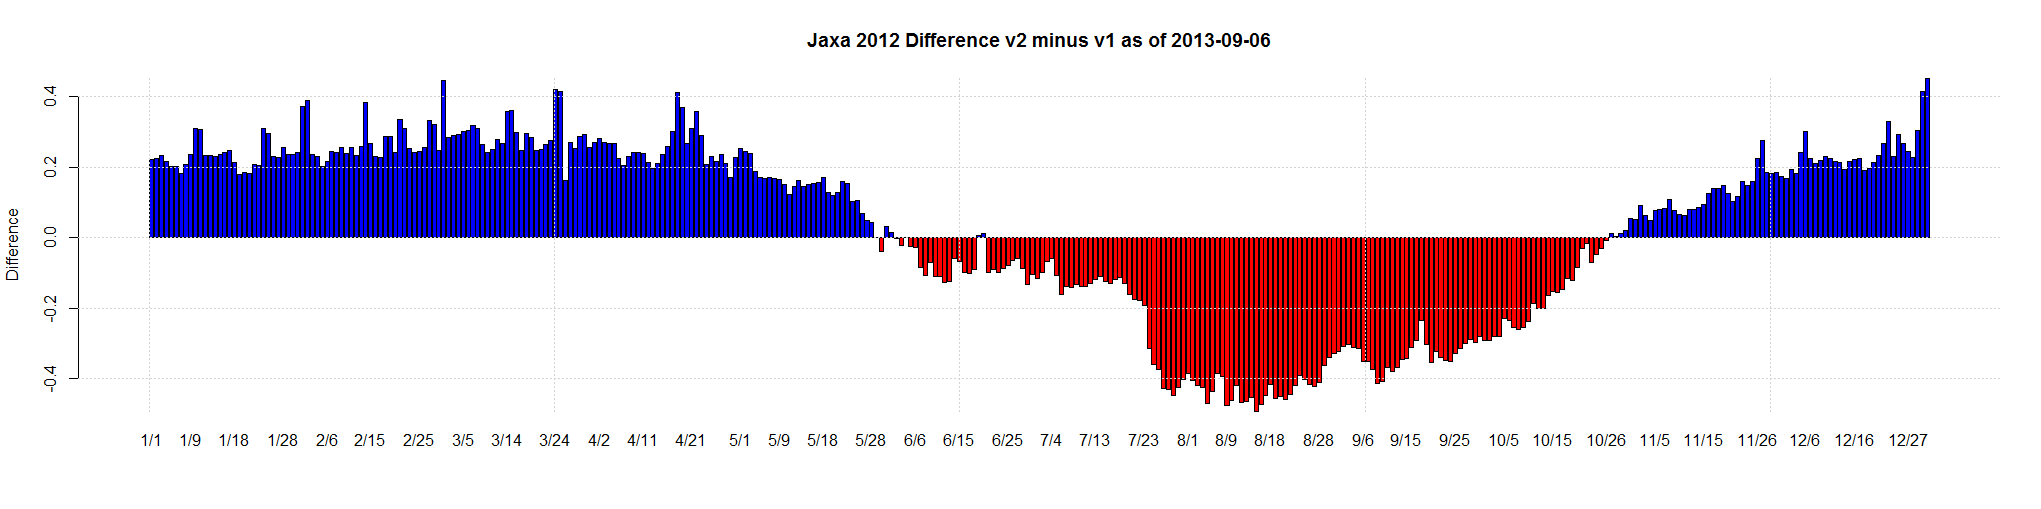
Yesterday I posted all the JAXA V2 versus V1 graphs. I was in a rush and I didn’t set the axis to be identical.
Here are the fixed graphs:


Arctic Sea Ice Extent Gained 10,500 sq km on Day 249 (September 6th). Minimum is (still) near!

UPDATE: Graphs with identical axis here.
Earlier today I noted that JAXA version 2 is out and I certainly didn’t like the new revision.
Here are all the years/decades compared. Remember the 1980’s, 1990’s and 2000’s are averages for the whole decade. And 2002 is incomplete and starts in June. And 2013 is incomplete because the year isn’t over.
I don’t understand how the 1980s / 1990s / 2000s “red” adjustment is so small compared to 2013 etc.


UPDATE: All the graphs are here.
Jaxa is one of the other sea ice monitoring agencies. They just came out with a version 2 of their data.
I thought … why not graph the difference between version 1 and version 2 for 2013.
Red = Version 2 Lower Than Version 1
Blue = Version 2 Higher Than Version 1
Guess what the following graph shows? It makes the minimum dramatically lower (400,000 sq km lower) and the maximum higher so the minimum looks even worse when graphed.
For shame.

“Ice buildup in the Amundsen Gulf is responsible for barge delays that have many Northern coastal communities running short on supplies.
Normally, a supply barge arrives in the area in early summer to replenish stocks of fuel and other necessities in those communities. But this year, that trip is being held up by ice. As much as 30 to 40 per cent of the Arctic Ocean remains covered in ice.
“We have not seen ice with this type of coverage in quite a few years and I really don’t know how far back we might’ve seen it,” says Bill Smith, a spokesman with Northern Transportation Company Ltd., which services the communities.”
http://www.cbc.ca/news/canada/north/story/2013/09/03/north-barge-delays.html
(h/t Alec aka Daffy Duck)
From NorthwestPassage2013:
“Two French men, Sébastien Roubinet and Vincent Berthet , who set out on a trek to the North Pole in July in a wind catamaran, announced today that they are blocked in the Arctic. A Russian ice-breaker has been dispatched to help them.”
“The goal was to make it to Spitzberg in the Svalbard archipelago in Norway, via the North Pole and observe the state of melting ice that has gone on over the past years.
However, “Admiral Makarov”, the Russian ice-breaker will come to the rescue after receiving their distress calls.”
Arctic Sea Extent Gained 63,000 sq km on Day 245 (September 2nd). Minimum is near!
The earliest minimum was day 244 in 1987 and as of today the minimum for 2013 is day 244.

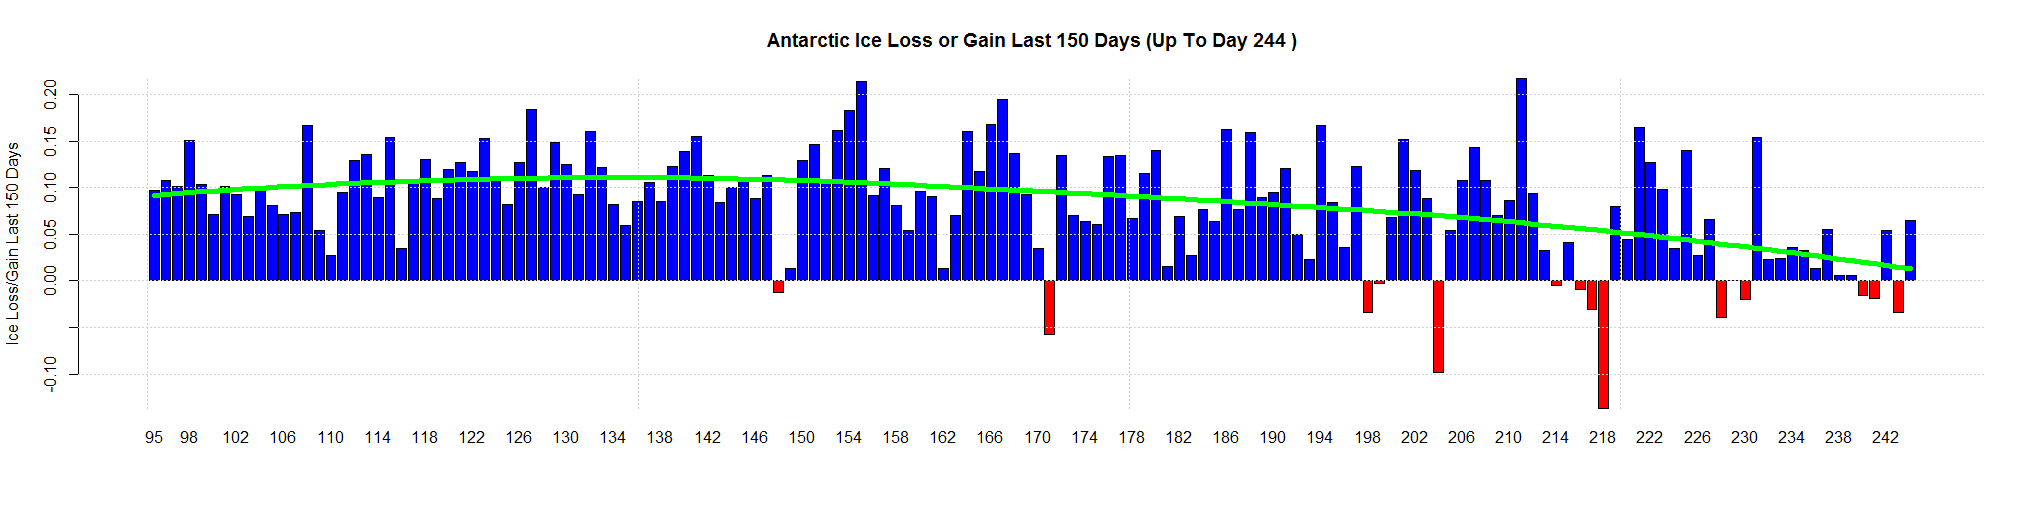
The last 150 days of Ice Loss or Gain.