From DMI
From DMI
Oh No!!!! (This is soooo damaging to the “Experts” claim that PM 2.5 is bad for you)

 Burnt toast could expose people to more toxic air than if they were standing near a busy road, and cooking a Sunday roast can raise pollution levels to above those in city centres, research suggests.
Experts found pollutant levels after cooking a roast turkey – with trimmings – were 13 times higher than those in central London.
And toasting two slices of bread caused twice as much air pollution as is seen in the city for 15 to 20 minutes – meaning three times the World Health Organisation’s safety limit.
Experts issued a public warning to families to open windows and turn on extractor fans to avoid exposure to dangerous levels of toxic airborne particles – which can trigger breathing problems and pose risks to the heart and circulation.


From DMI
March 2000: According to Dr David Viner, a senior research scientist at the climatic research unit (CRU) of the University of East Anglia,within a few years winter snowfall will become “a very rare and exciting event”.
“Children just aren’t going to know what snow is,” he said.
Snow seems to be ignoring David Viner.
My Swedish is poor. But the graph is clear. Spitsbergen temperatures are in synch with the AMO. Some translated text below graph. (Thanks)

Contributing to making this part of the report a worrying reading is that the natural climate variations are not included in the used climate models. This is depressing, as it is well known that the air temperature around Svalbard is clearly influenced by the AMO (Atlantic Multidecadal Oscillation), which is a natural and periodic variation. This impact is actually mentioned in the report, and this realization ought to have been exploited.
Both the AMO and the air temperature in Longyearbyen have largely covaried since 1898 (see figure). The natural climate variations are thus far from unimportant, and explain better than all CO2-controlled climate models what actually takes place here in Longyearbyen.
AMO is known from measurements since 1856, and geological surveys show that AMO has been in unbroken function for at least the past 8000 years. So it is not likely that AMO will stop in the near future. AMO is currently passing a peak, and will in all likelihood decline over the next 30-35 years. We can all imagine how it will affect the Svalbard temperature. So the natural phenomenon of AMO ought to be included in the report’s assessment of the future climate in Longyearbyen with great emphasis, but does not.


From DMI


From DMI
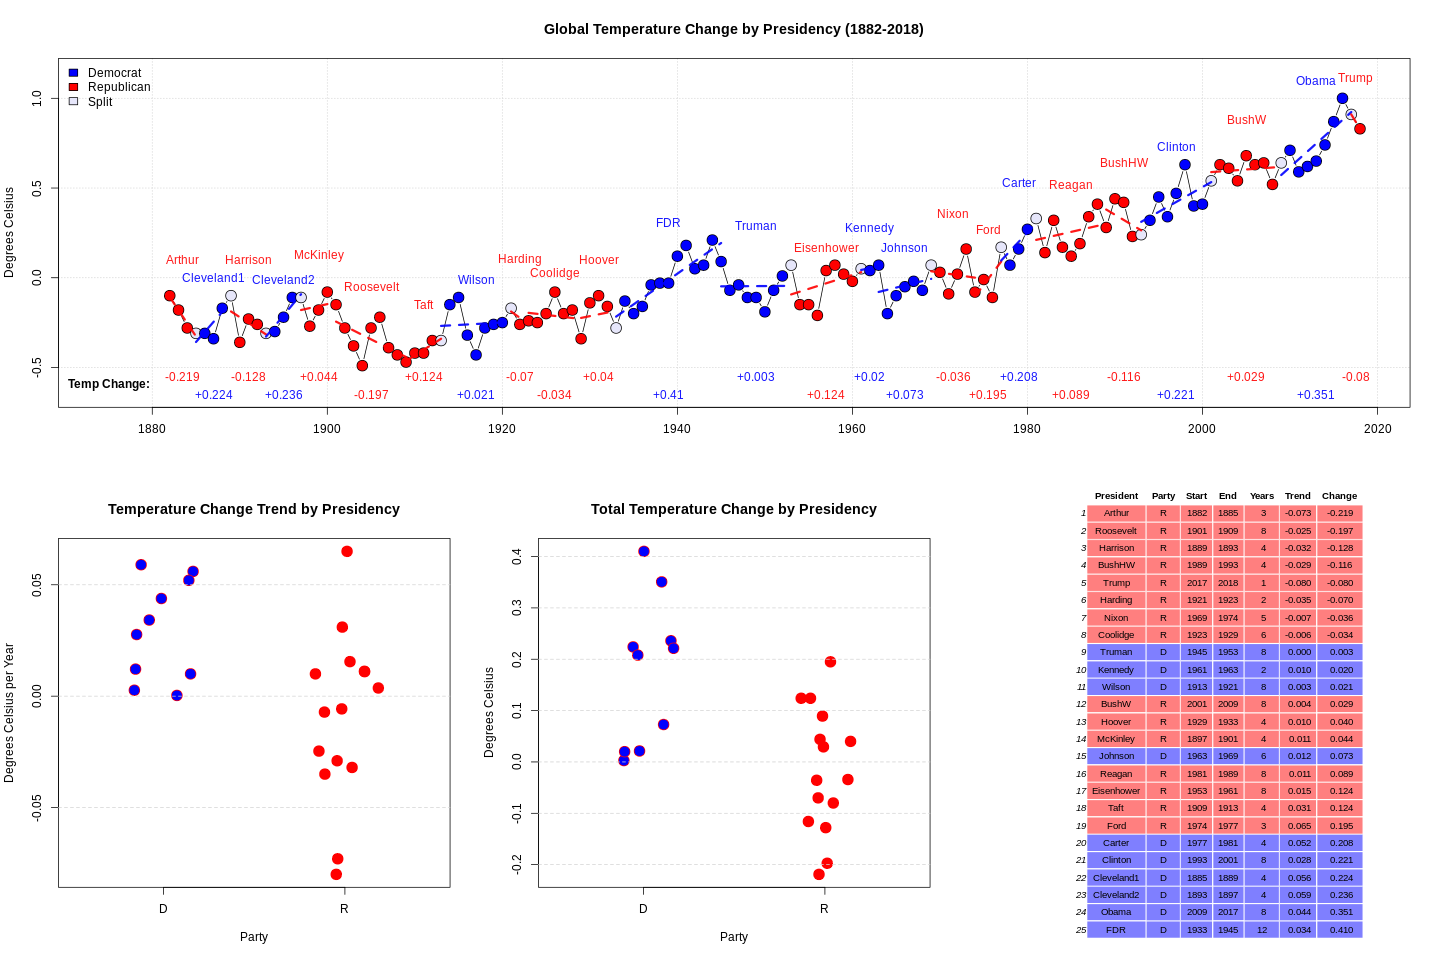
This is funny.
An anonymous blog commenter sends the above graph and writes:
I was looking at the global temperature record and noticed an odd correlation the other day. Basically, I calculated the temperature trend for each presidency and multiplied by the number of years to get a “total temperature change”. If there was more than one president for a given year it was counted for both. I didn’t play around with different statistics to measure the amount of change, including/excluding the “split” years, etc. Maybe other ways of looking at it yield different results, this is just the first thing I did.
It turned out all 8 administrations who oversaw a cooling trend were Republican. There has never been a Democrat president who oversaw a cooling global temperature. Also, the top 6 warming presidencies were all Democrats.
I have no idea what it means but thought it may be of interest.