I don’t know what it means, but I’ve been aware of an oscillation pattern in Antarctic Sea Ice Extent for some time.
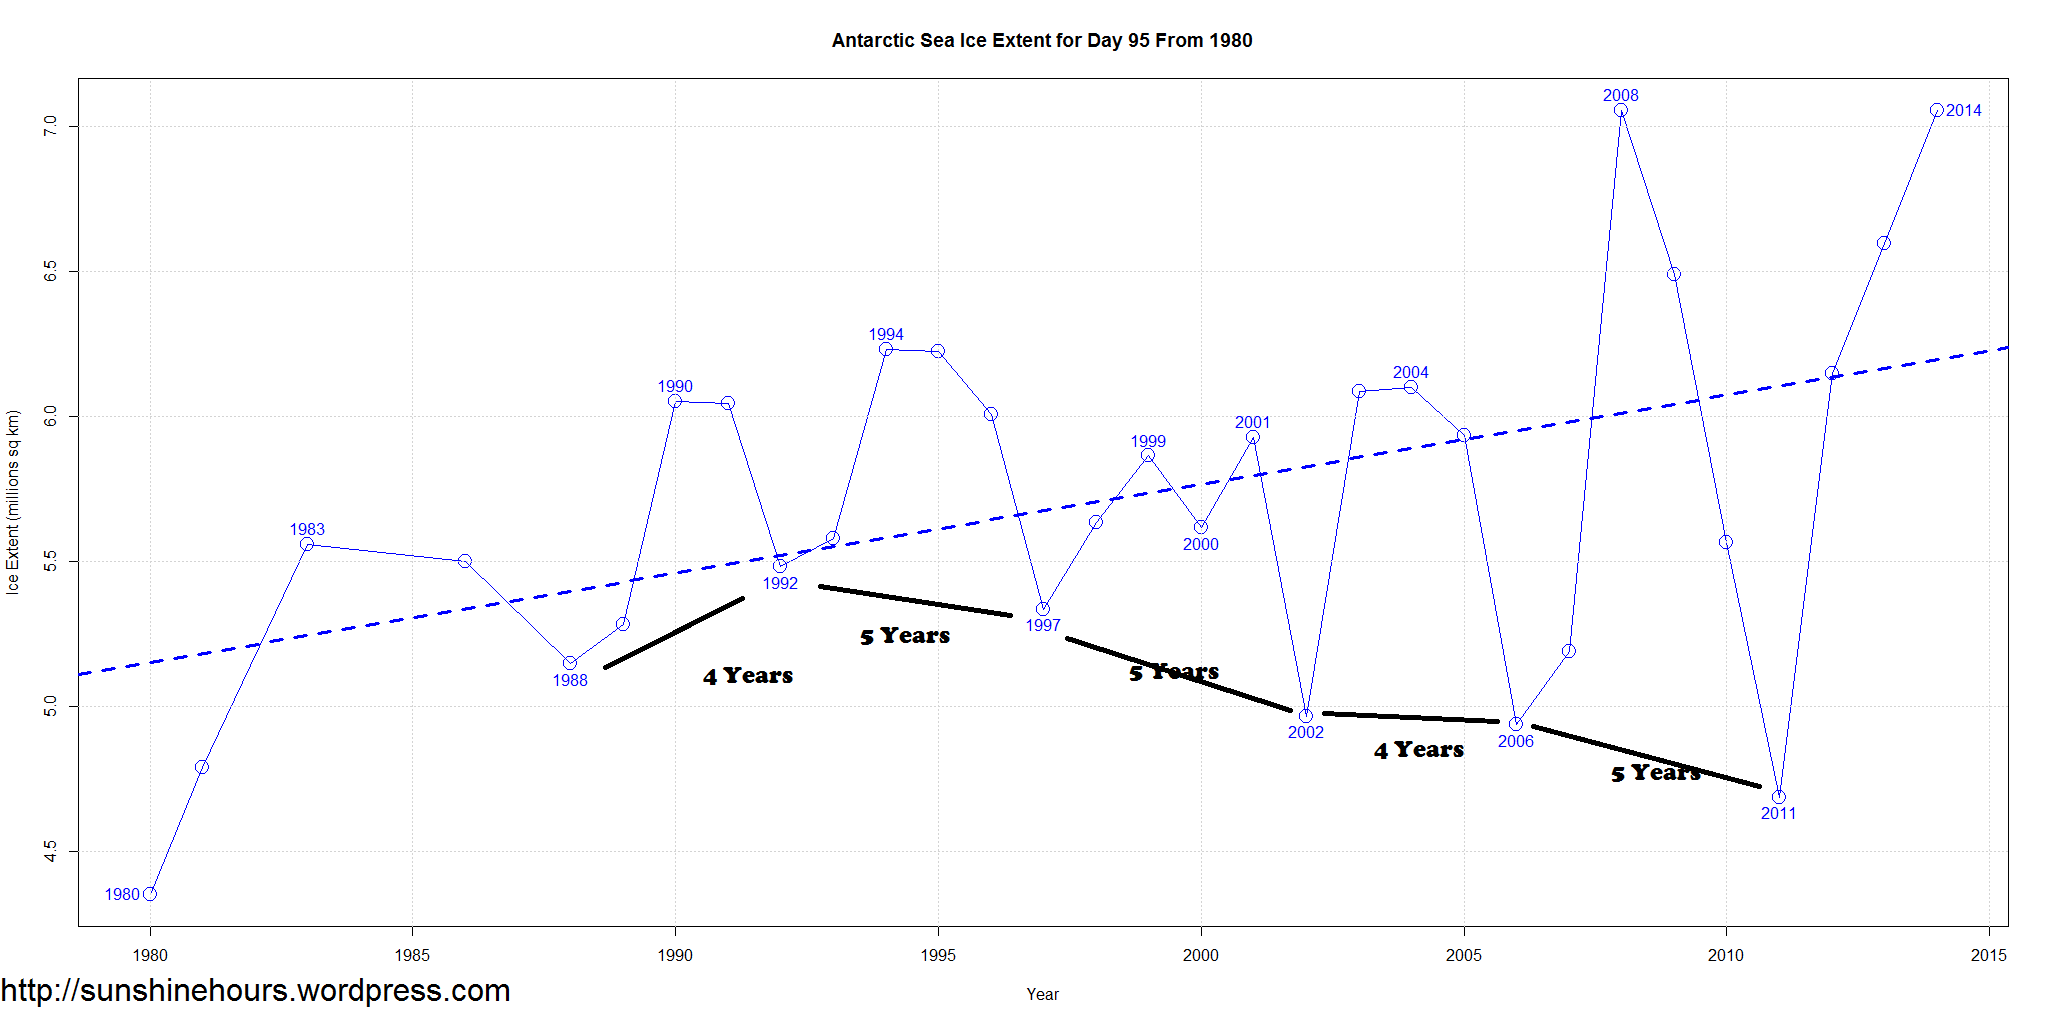
A while ago I noted the time between oscillations. Today I am just noting the size of the oscillations.
The current satellite record only started around 1978 (and only a partial years data exists). And until 1986, data only exists for alternating days.
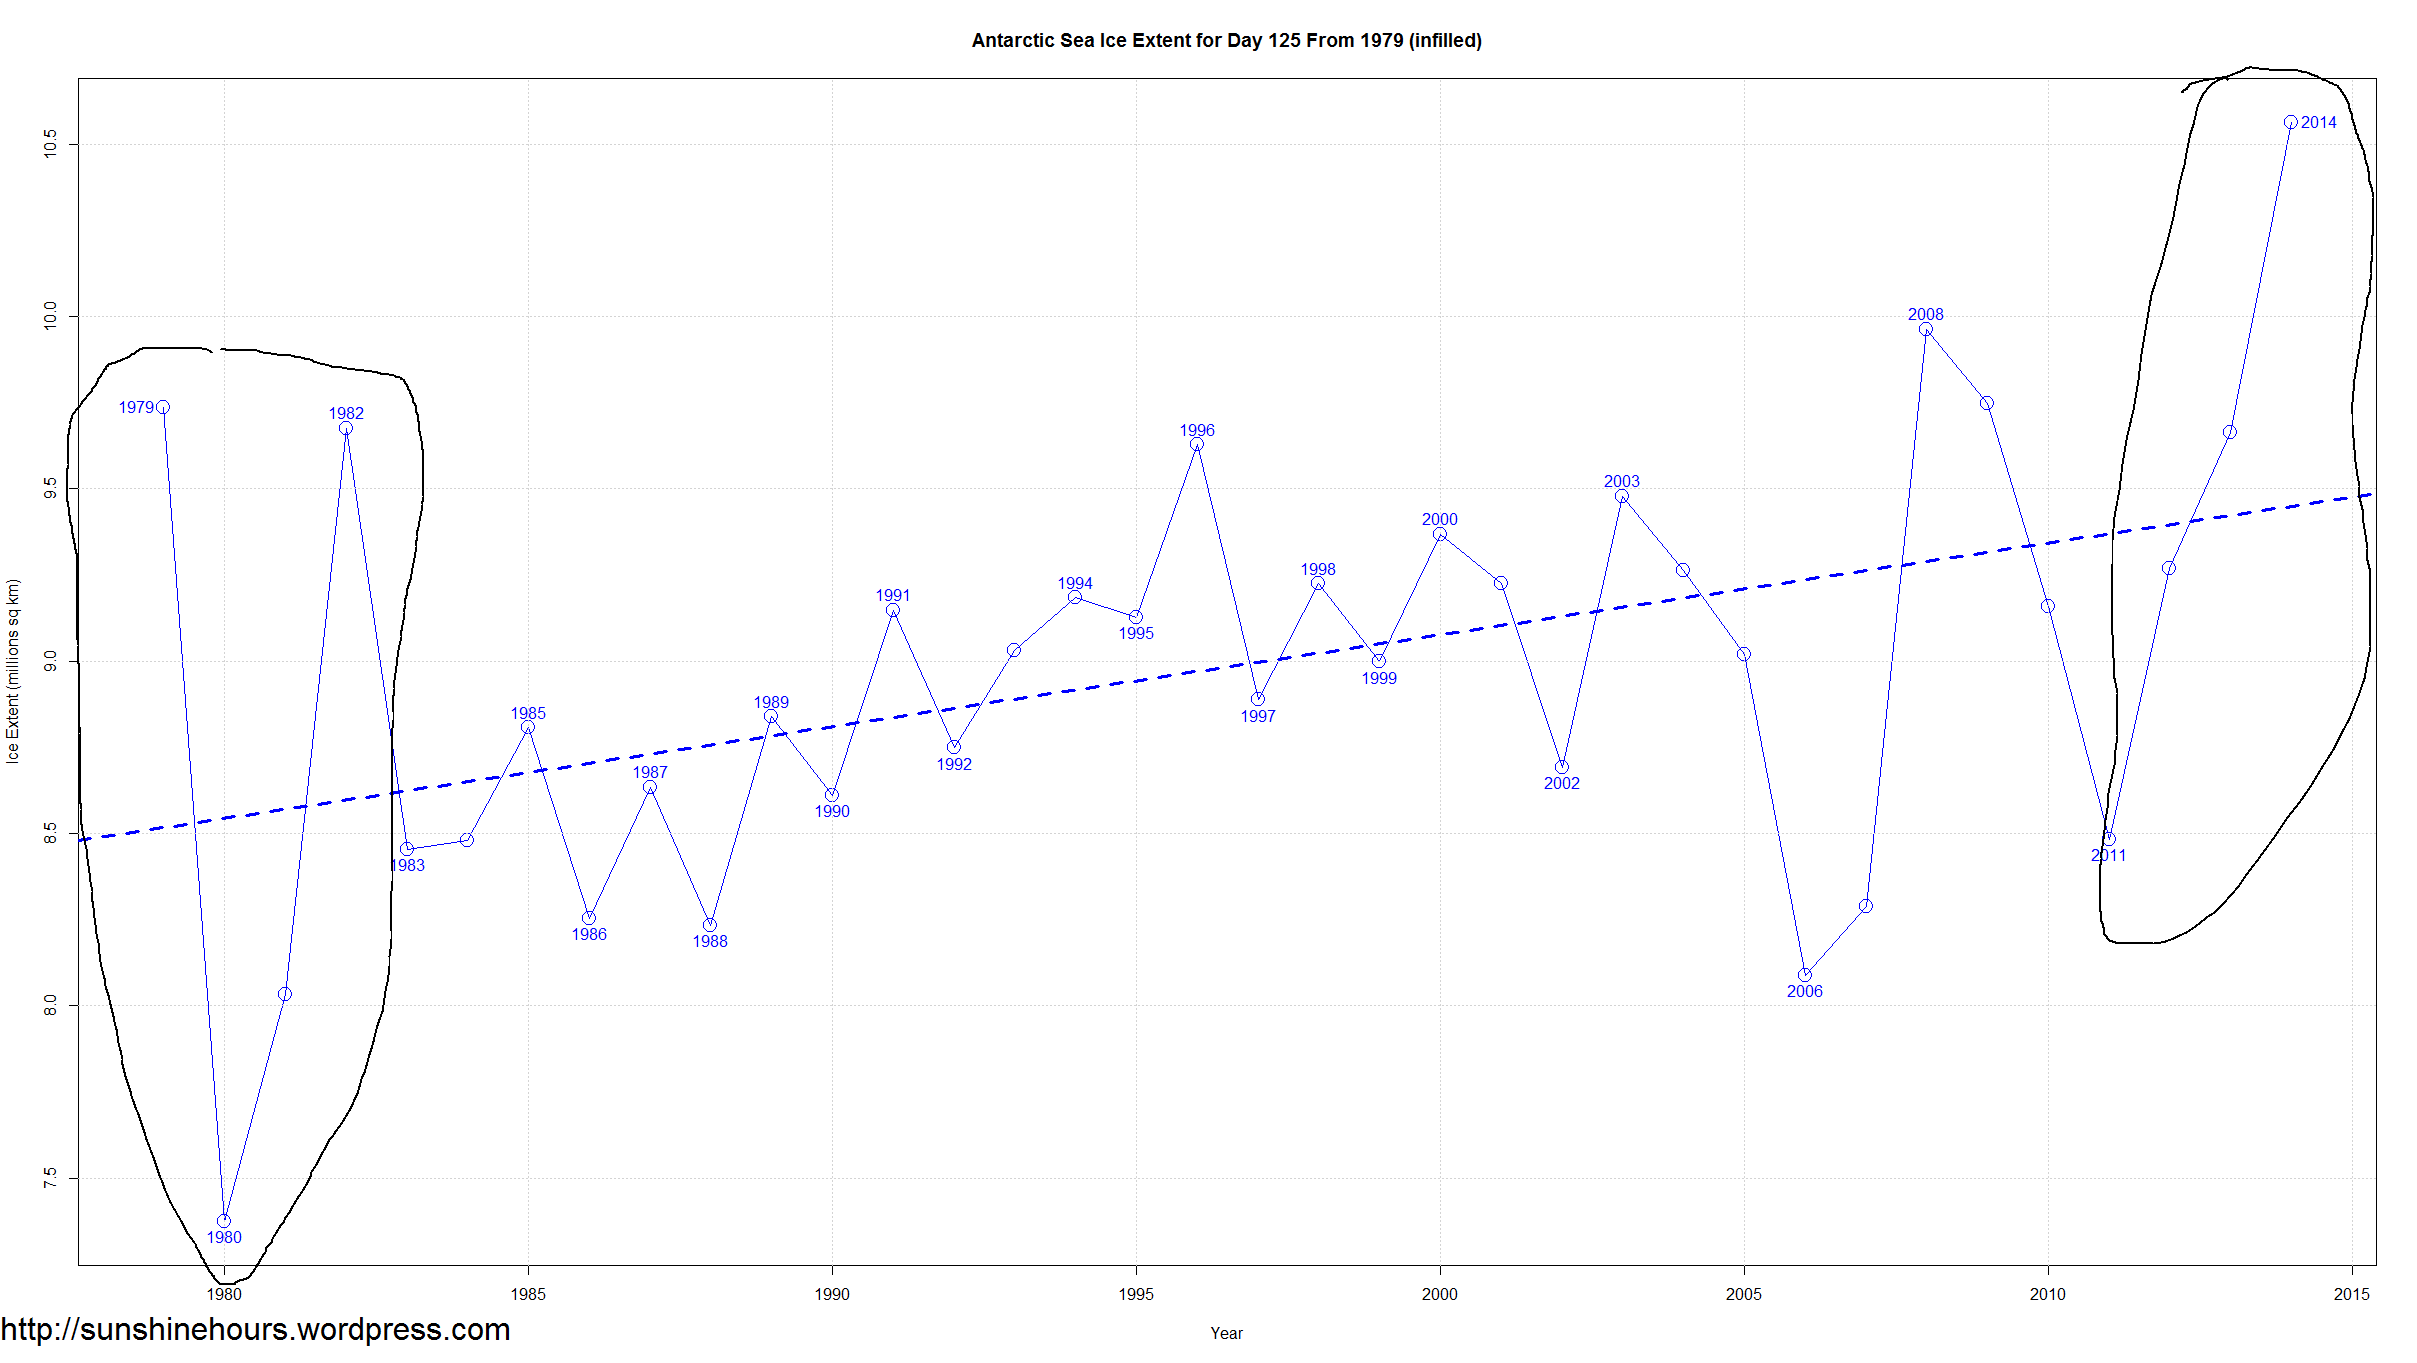
Consider that the AMO is about 66 years long. And 1982 (the end of the big oscillations in the early part of the satellite record) is about 33 years ago I wonder if the big oscillation pattern will come to an end soon in the same way it came to an end after 1982? (Update: Or will it oscillate for 33 years?)
We don’t what happened off to the left of the graph (the pre-satellite era) with certainty. Or why these oscillations were once huge, and then settled down and then resumed their large oscillations again.
Click for larger.