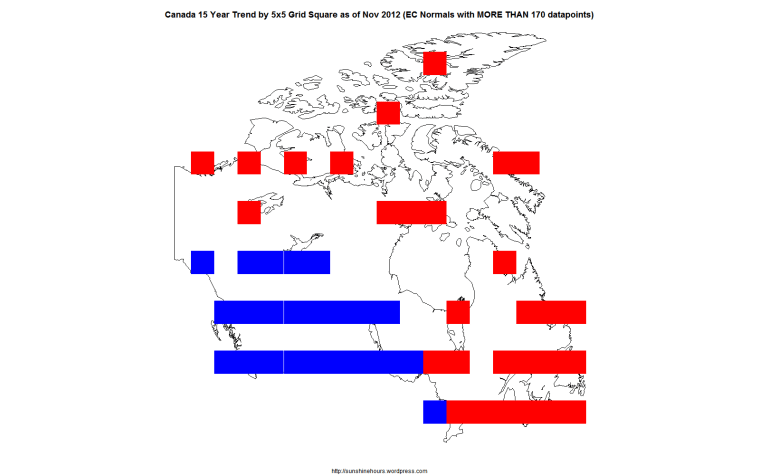
Update: There are 54 5×5 grid squares in Canada with EC normals with 170 datapoints in the last 15 years. 29 are warming and 25 are cooling.
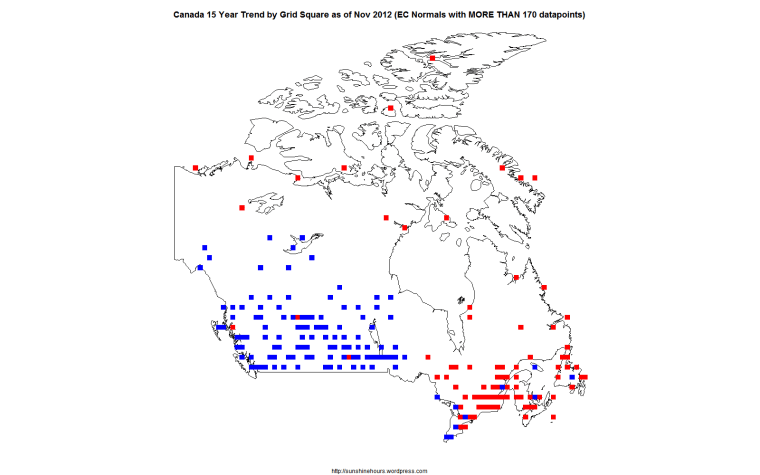
There are 199 1×1 grid squares using the same data. 116 are cooling and 83 are warming.
——————-
Previously I have looked at the 15 year trend for Environment Canada data up to Nov 2012 using 1×1 grids here, and 5×5 grids here.
Using 1×1 grid squares, Canada is cooling at -0.089C / decade.
Using 5×5 grid squares, Canada is warming at 0.053C / decade.
Don’t the big guys like to use 5×5 grids? What a shock.
Maps for 5×5 and 1×1 below.

One thought on “Canada – Grid Square Choices – 5×5 = Warming and 1×1 = Cooling”