Yesterday I mapped the anomalies for 2013 using the Environment Canada monthly summaries that have “normals”. The anomalies are calculated from selected stations based on the 1971-2000 average.
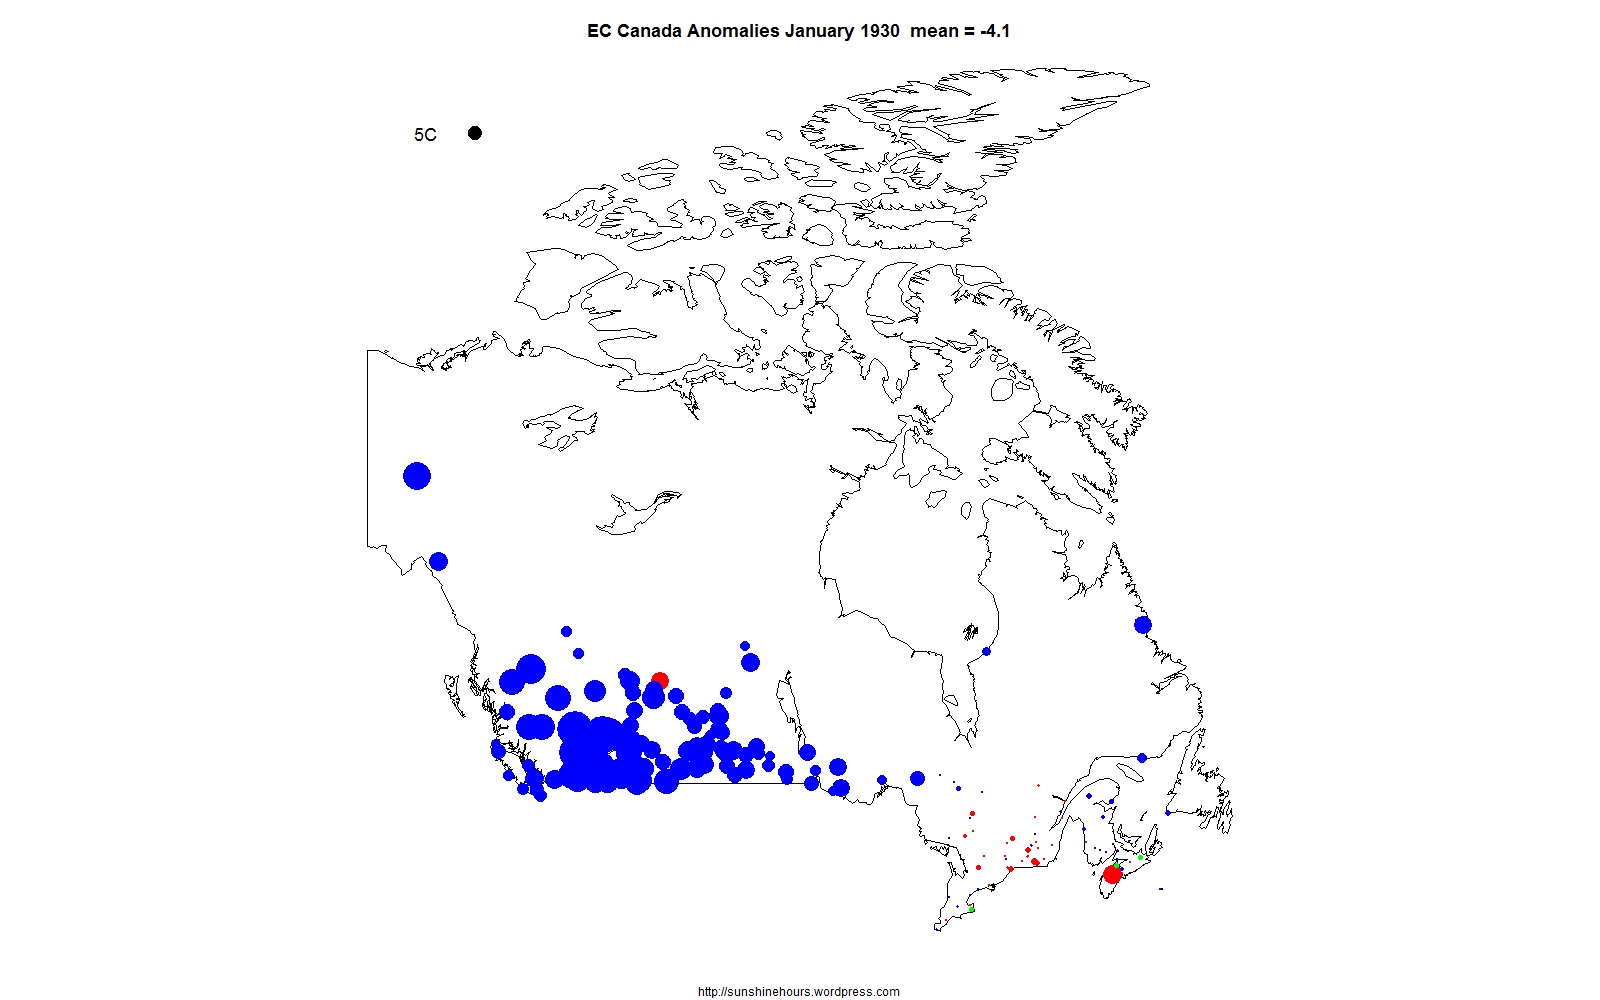
Today I thought … why not 1930. I picked 1930 because I know the dustbowl occurred in the 1930s. So I assumed it would be warm at times. Remember, this is the anomaly from the 1971-2000 averages. It started out cold, but December was 3.21C warmer!
An example of the effect of the dustbowl. “In 1928, the net Farming income was $363 million; by 1933, it dropped to $11 million; and by 1937, two-thirds of the farm population of Saskatchewan was destitute.”
Click for a bigger version. (The black dot in the top left corner represents a 5C difference. Red = hotter than 1971-2000. Blue = colder.

One thought on “Canada 1930- Monthly Anomalies Mapped”