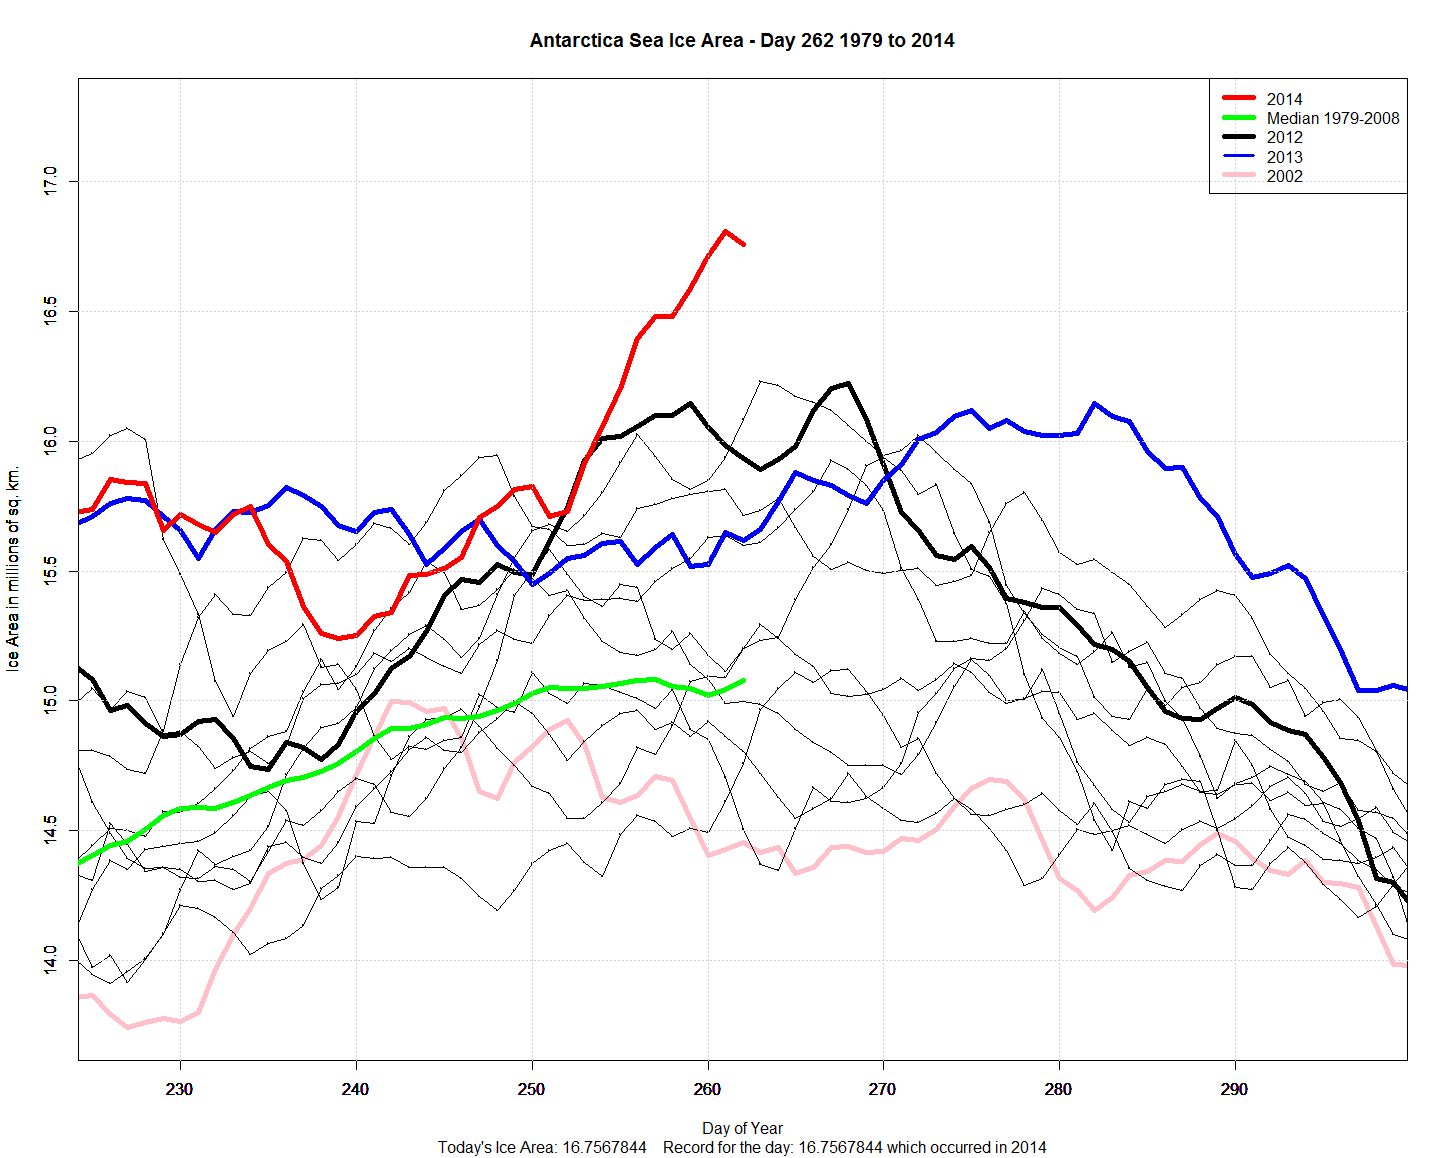
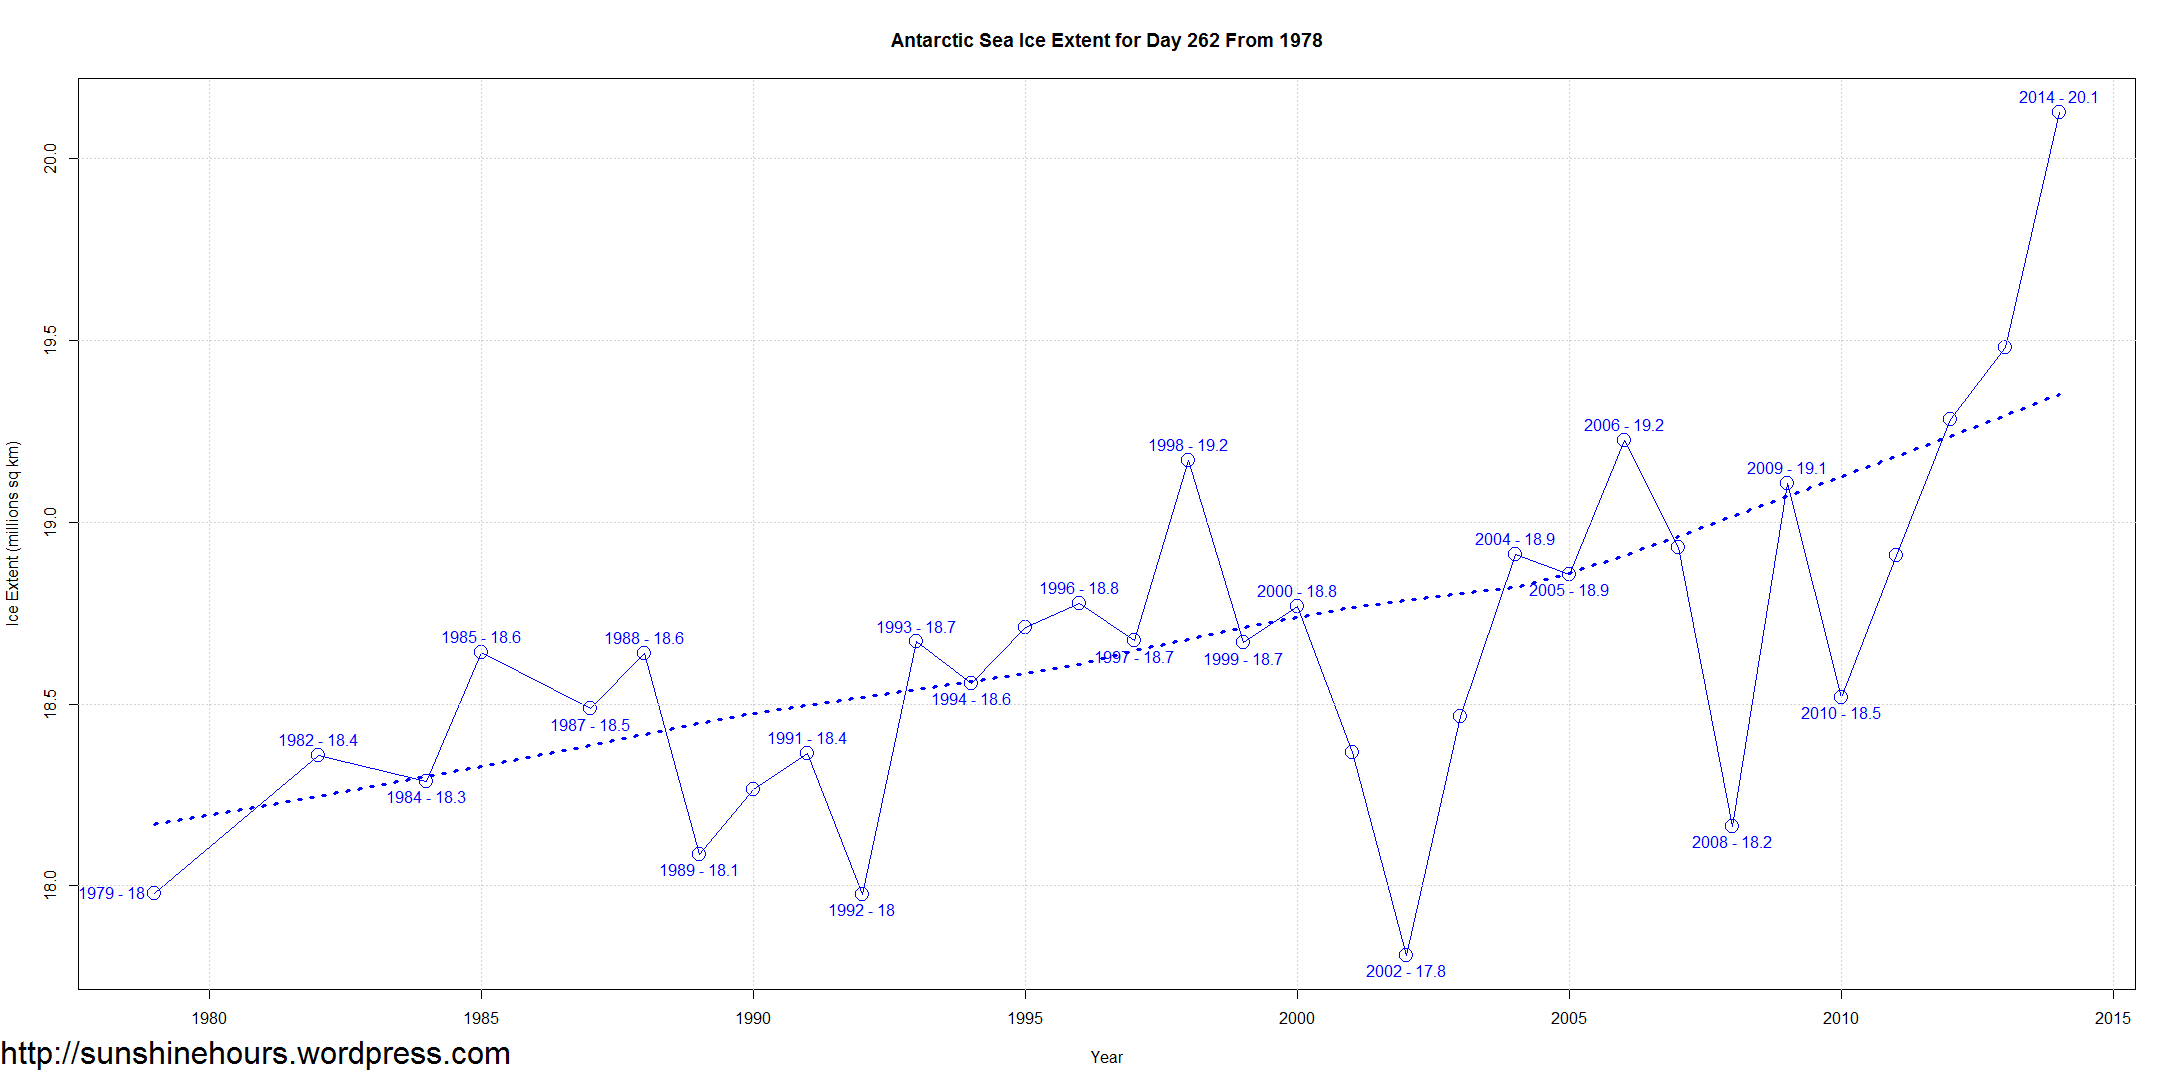
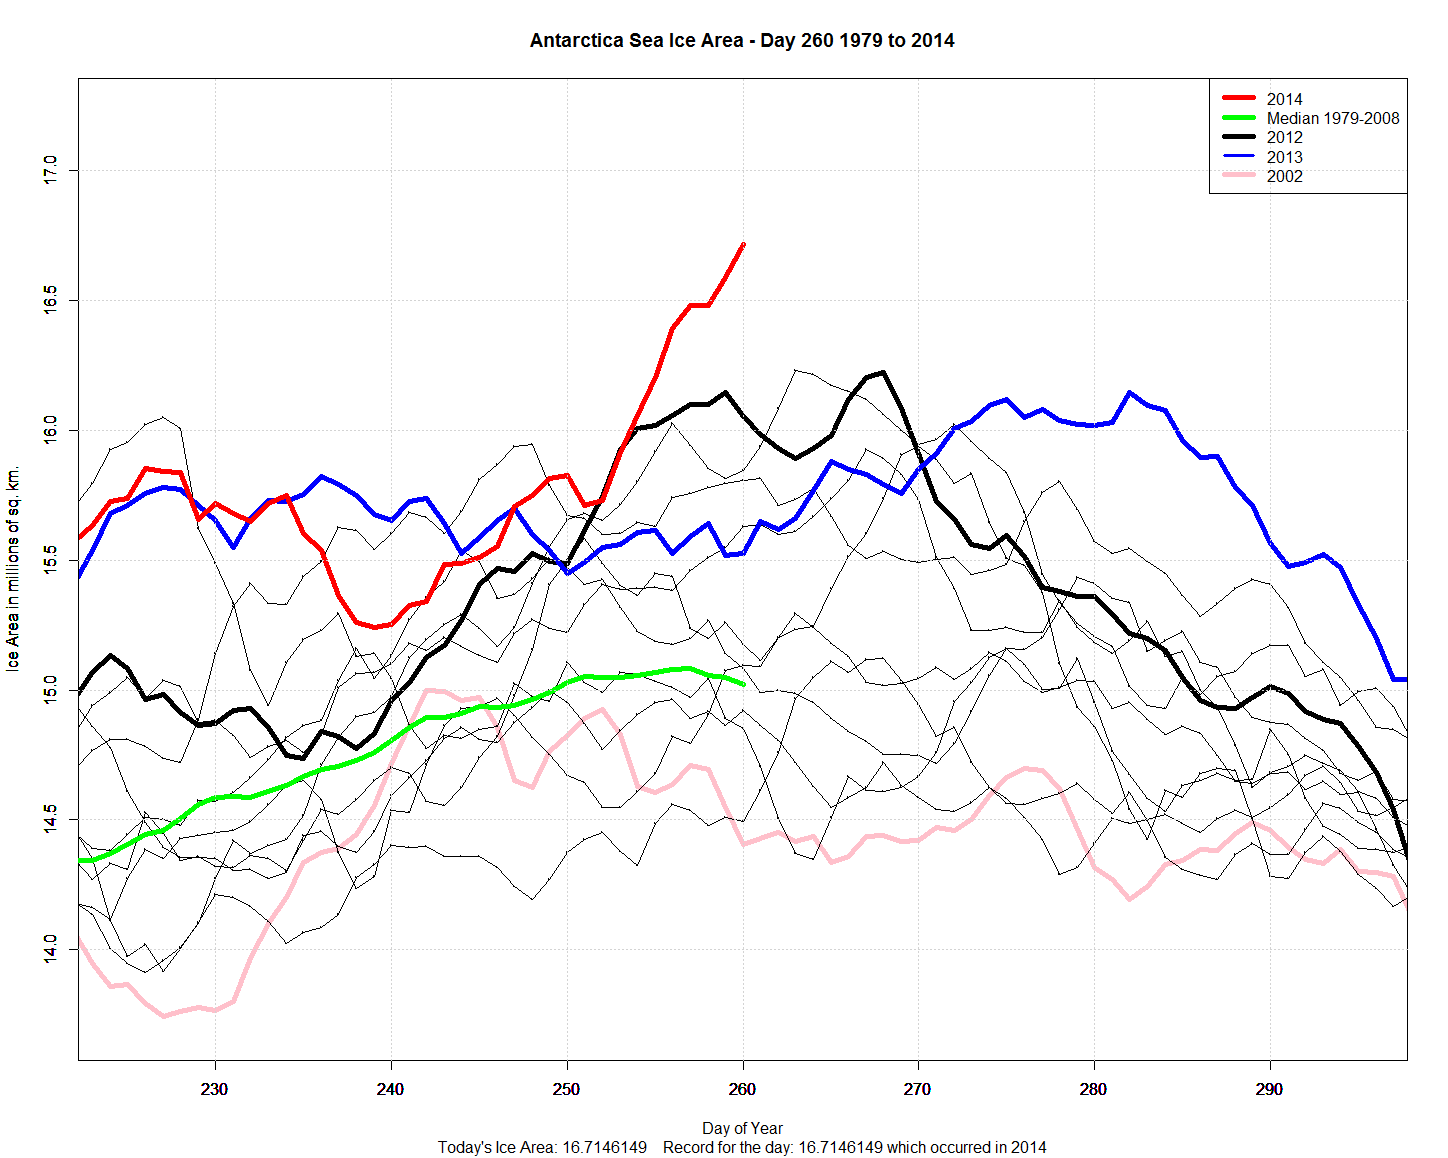
Antarctic Sea Ice Area has stopped skyrocketing (difference between Area/Extent here)
One day is hardly a trend, but the peak may have occurred.
Antarctic Sea Ice Area has stopped skyrocketing (difference between Area/Extent here)
One day is hardly a trend, but the peak may have occurred.
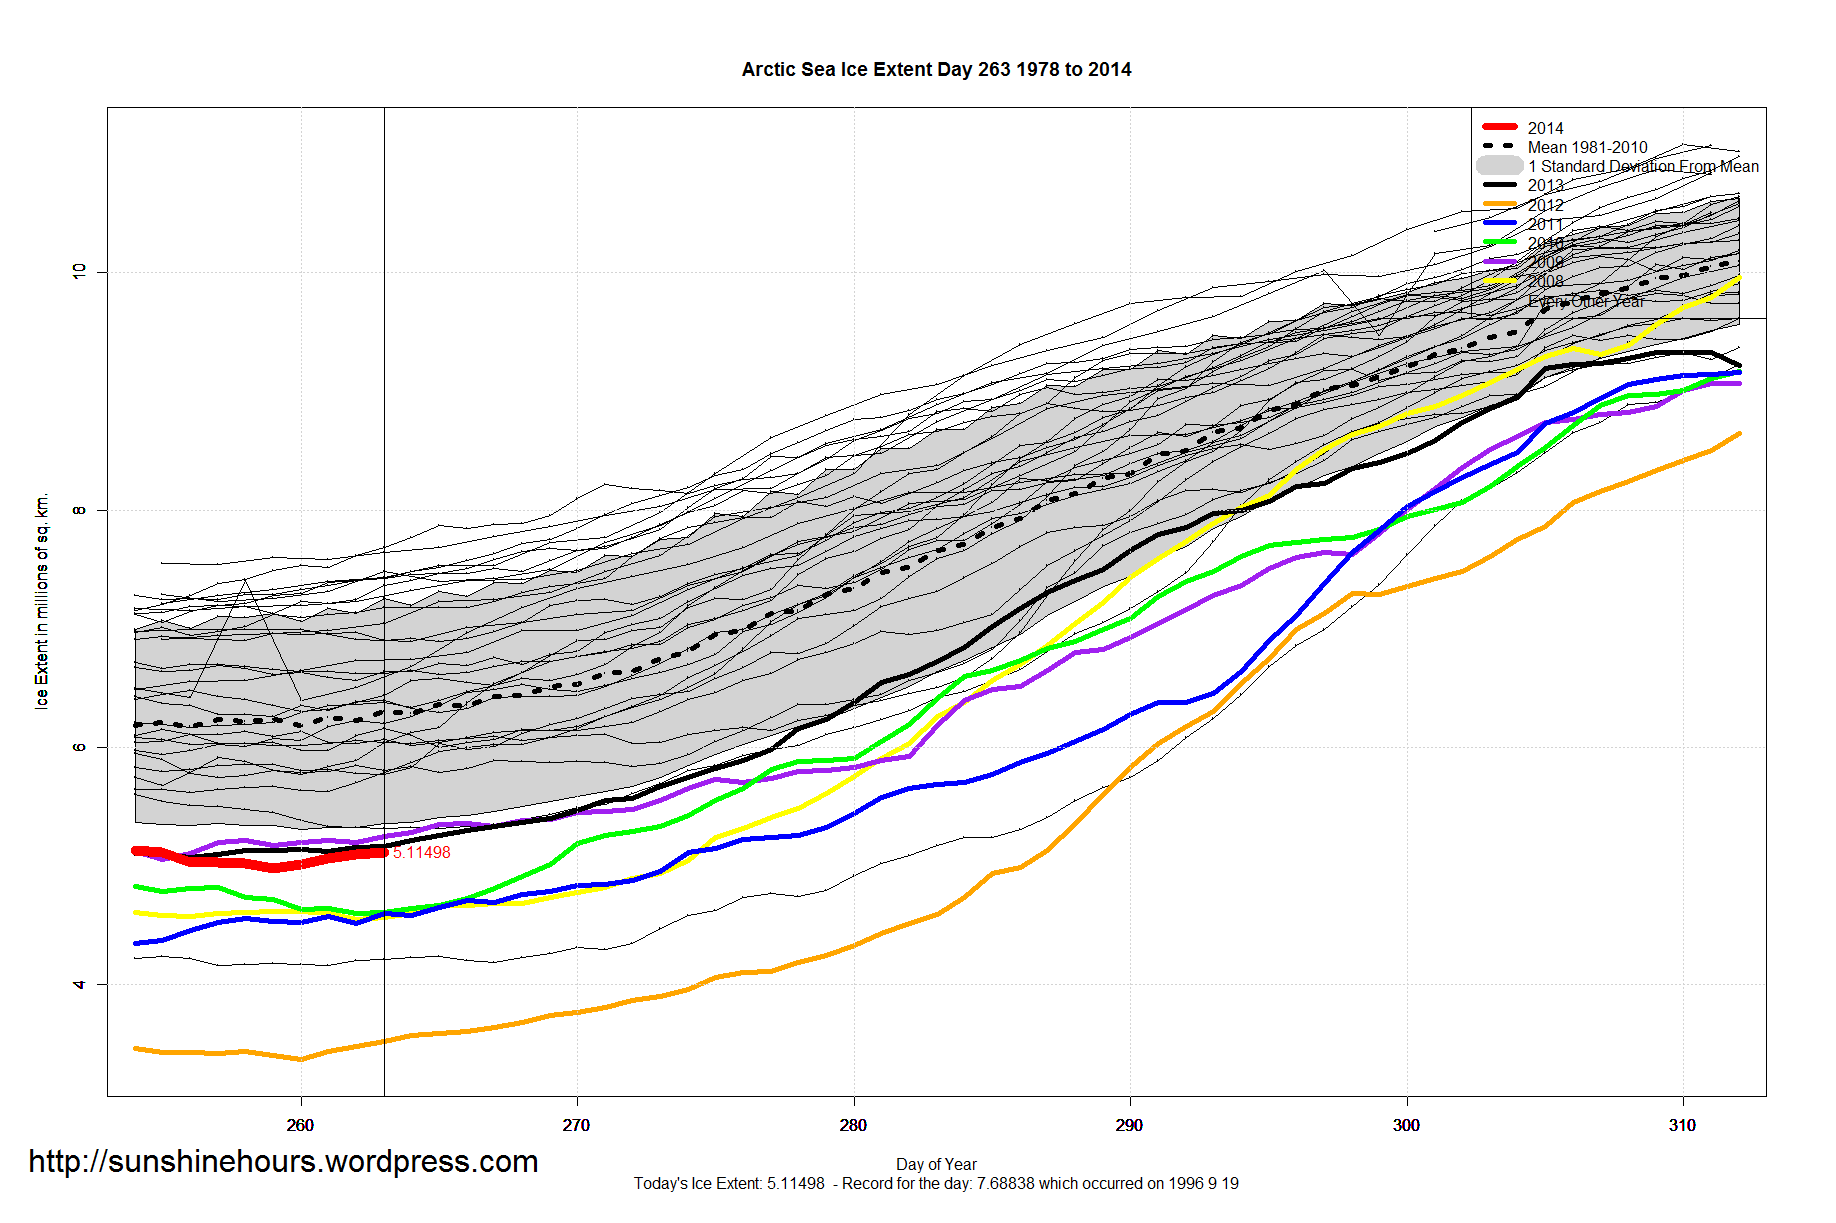
Arctic Sea Ice Extent Sep 21 2014 – -1,192,000 sq km below the 1981-2010 mean. Data for Day 263. Data here.

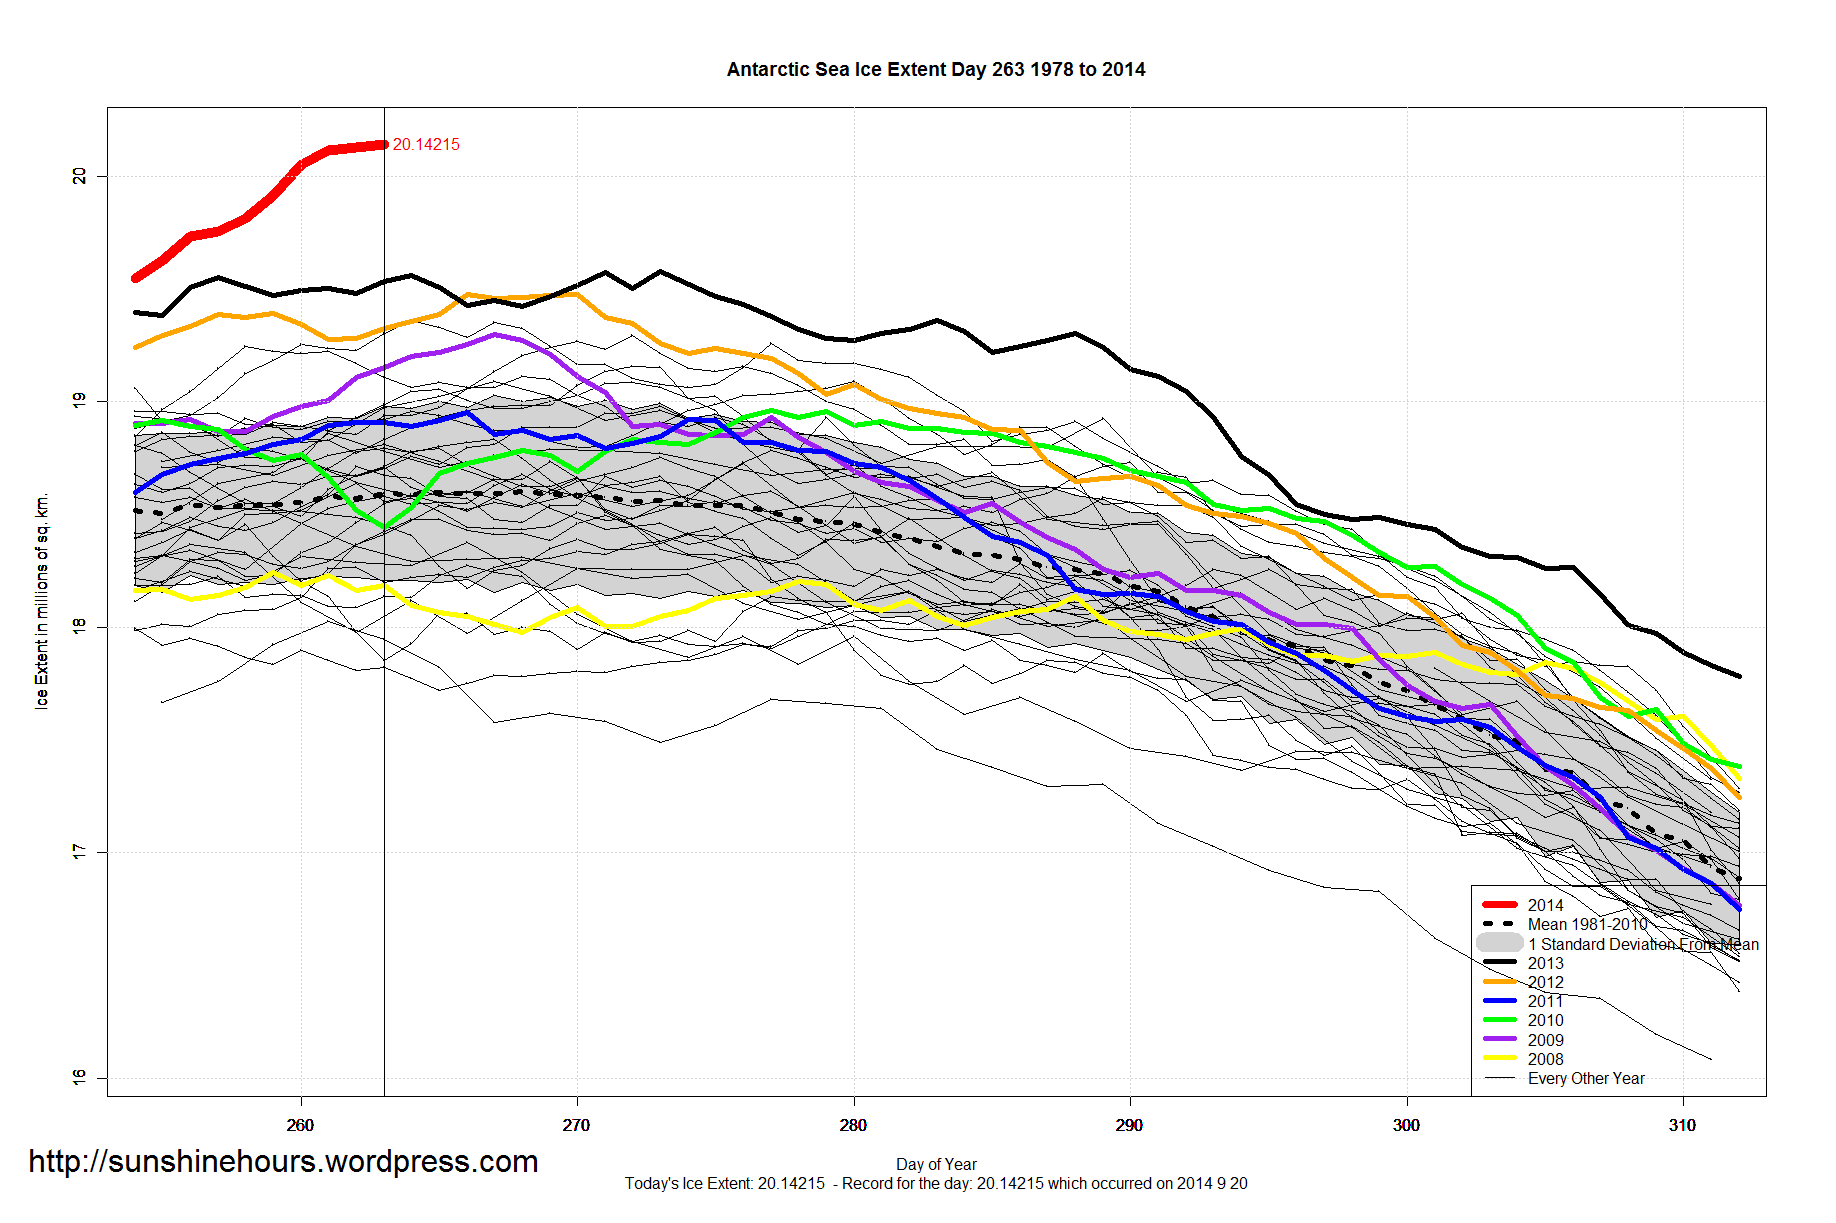
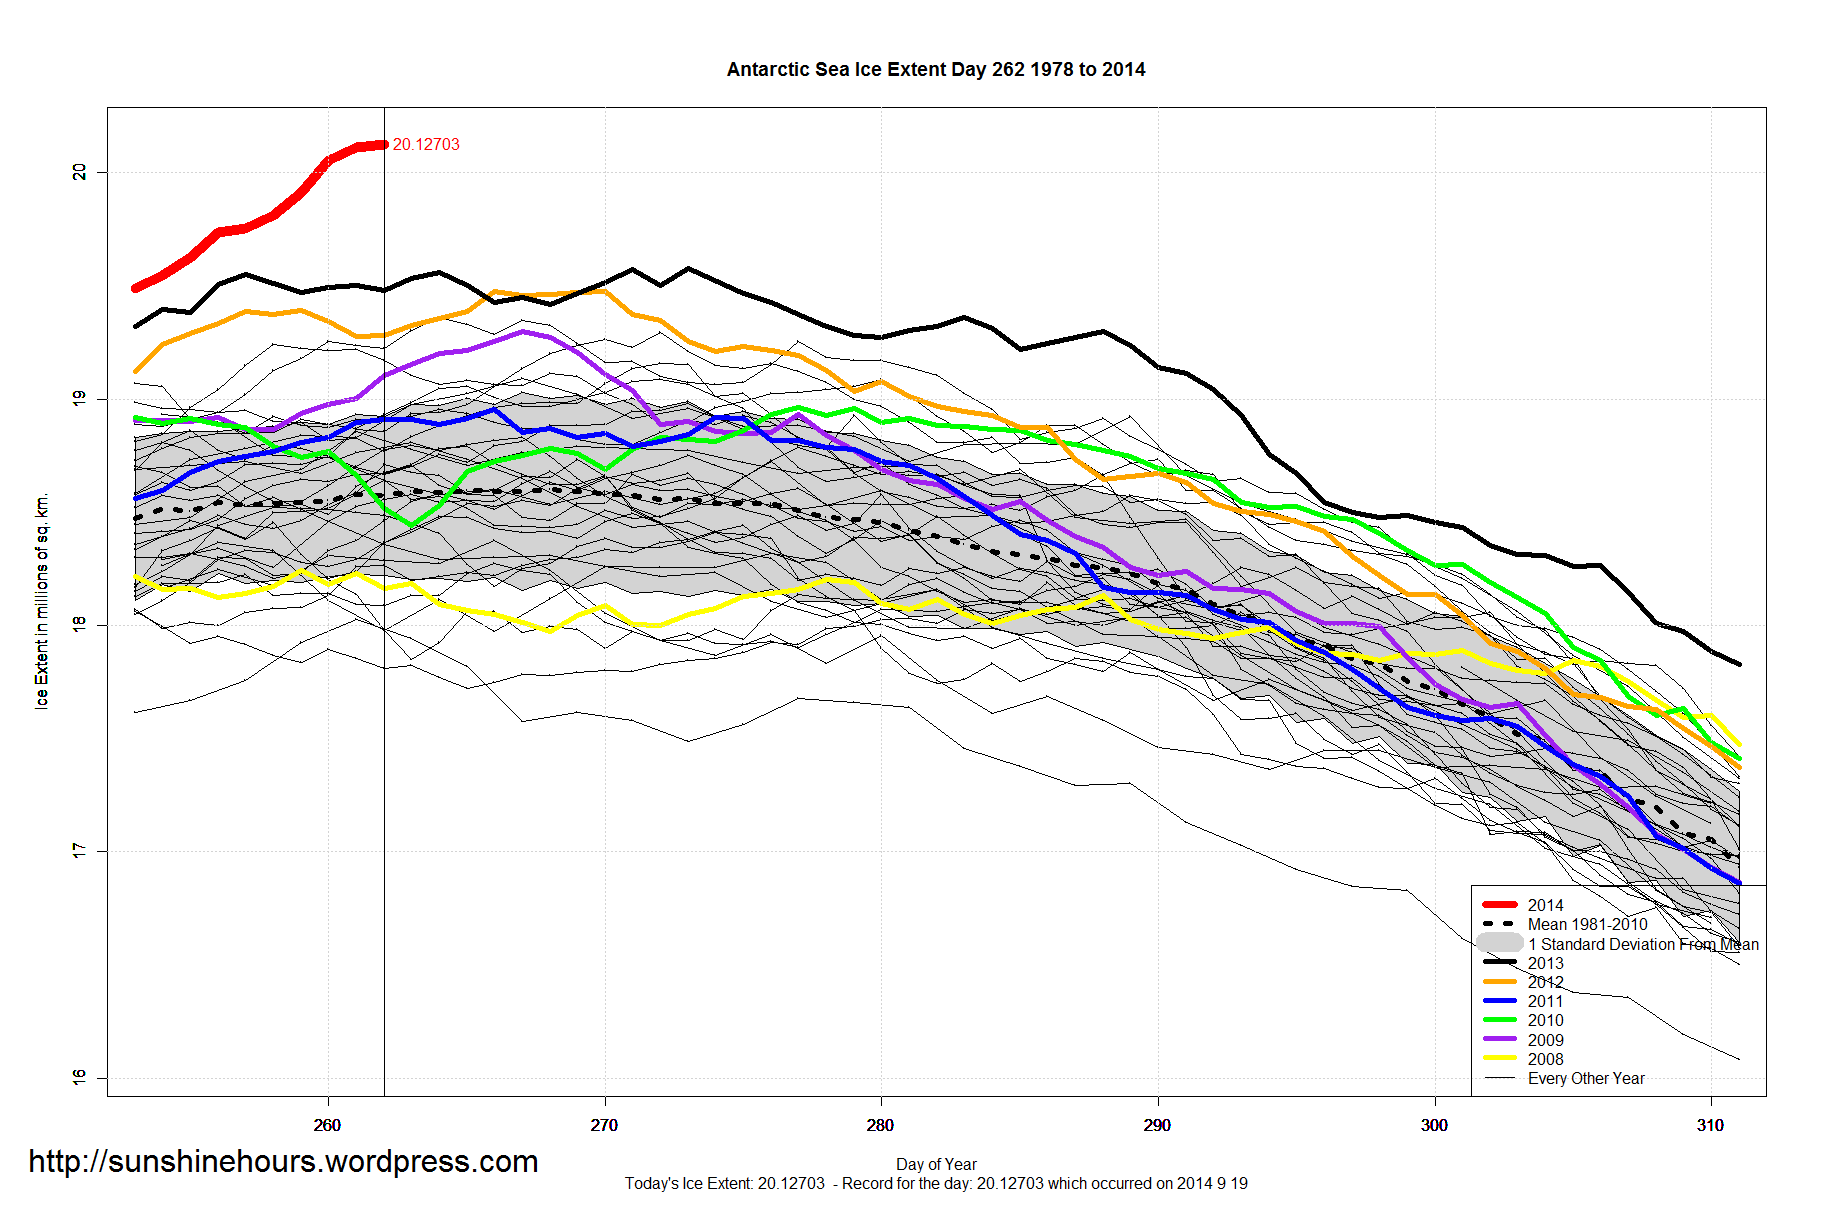
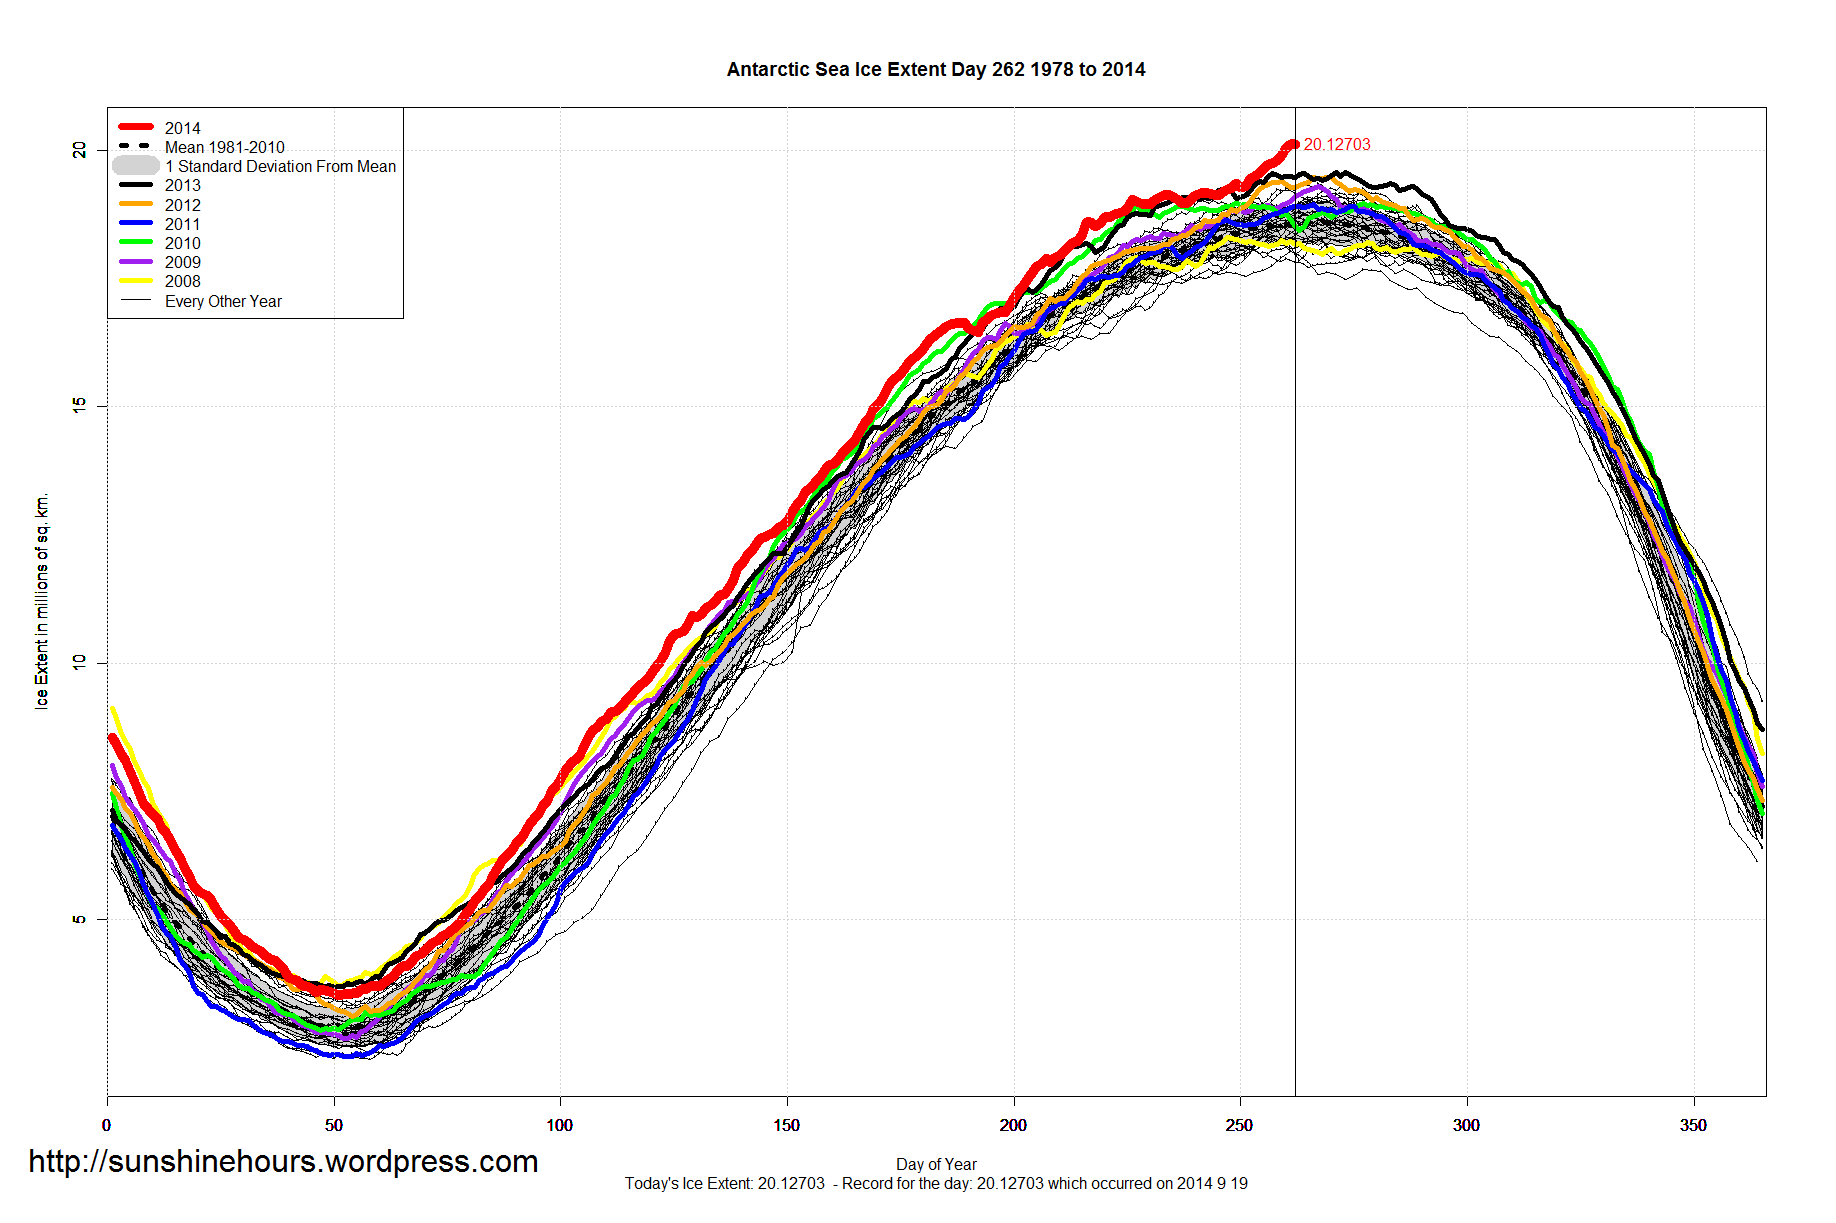
Antarctic Sea Ice Extent Sep 21 2014 – 1,550,000 sq km above the 1981-2010 mean. Data for Day 263. Data here.
9th All-Time Record in 9 Days. But only a 15,000 sq km gain. But still 4 standard deviations above the mean.

During the most amazing run of of record Antarctic Sea Ice Extent and Area ever, a comment at Bishop Hill reminds us of the recent prediction by “researchers“.
Sunday 29 June 2014
“The entire population of Antarctica’s famous emperor penguins could fall by a third by the end of the century because of disappearing sea ice, putting them at risk of extinction, researchers said on Sunday.”
” the main threat to emperor penguins’ survival comes from climate change which is melting the sea ice.”
“The loss of sea ice is reducing the supply of krill”
Disappearing Sea Ice? Melting sea ice? What loss?

Update: Comment from kyomu (thanks) reminded me that I had posted yesterdays graph. The graph is now correct. Apologies.
Antarctic Sea Ice Area is still skyrocketing. (difference between Area/Extent here)
Another day another 95,000 sq km. 570,000 sq km above the old record from 2007. 6th All-Time Record in a Row
Arctic Sea Ice Extent Sep 20 2014 – -1,129,000 sq km below the 1981-2010 mean. Data for Day 262. Data here.
It is now over 100,000 higher than day 259. I’m pretty sure day 259 will be the 2014 minimum.


Seriously. Quit with the tree planting. Stop it.
“Climate scientists have calculated the effect of increasing forest cover on surface temperature. Their conclusion is that planting trees in the tropics would lead to cooling, but in colder regions, it would cause warming.”
(h/t JustOneMinute)
In the history of satellite ice extent measurements there has only been 5 days where the extent is more than 4 standard deviations above the 1981-2010 mean.
| Year | Day of Year | Month | Day | Extent | 4 Standard Deviations For The Day of Year (According to R) |
| 2014 | 216 | 8 | 4 | 18.60657 | 18.5632626616983 |
| 2014 | 259 | 9 | 16 | 19.91462 | 19.9051244314188 |
| 2014 | 260 | 9 | 17 | 20.05401 | 19.9052905021529 |
| 2014 | 261 | 9 | 18 | 20.11297 | 19.9308463421818 |
| 2014 | 262 | 9 | 19 | 20.12703 | 19.9879316730877 |
Antarctic Sea Ice Extent Sep 20 2014 – 1,554,000 sq km above the 1981-2010 mean. Data for Day 262. Data here.
8th All-Time Record in 8 Days and “only” 14,000 sq km higher.
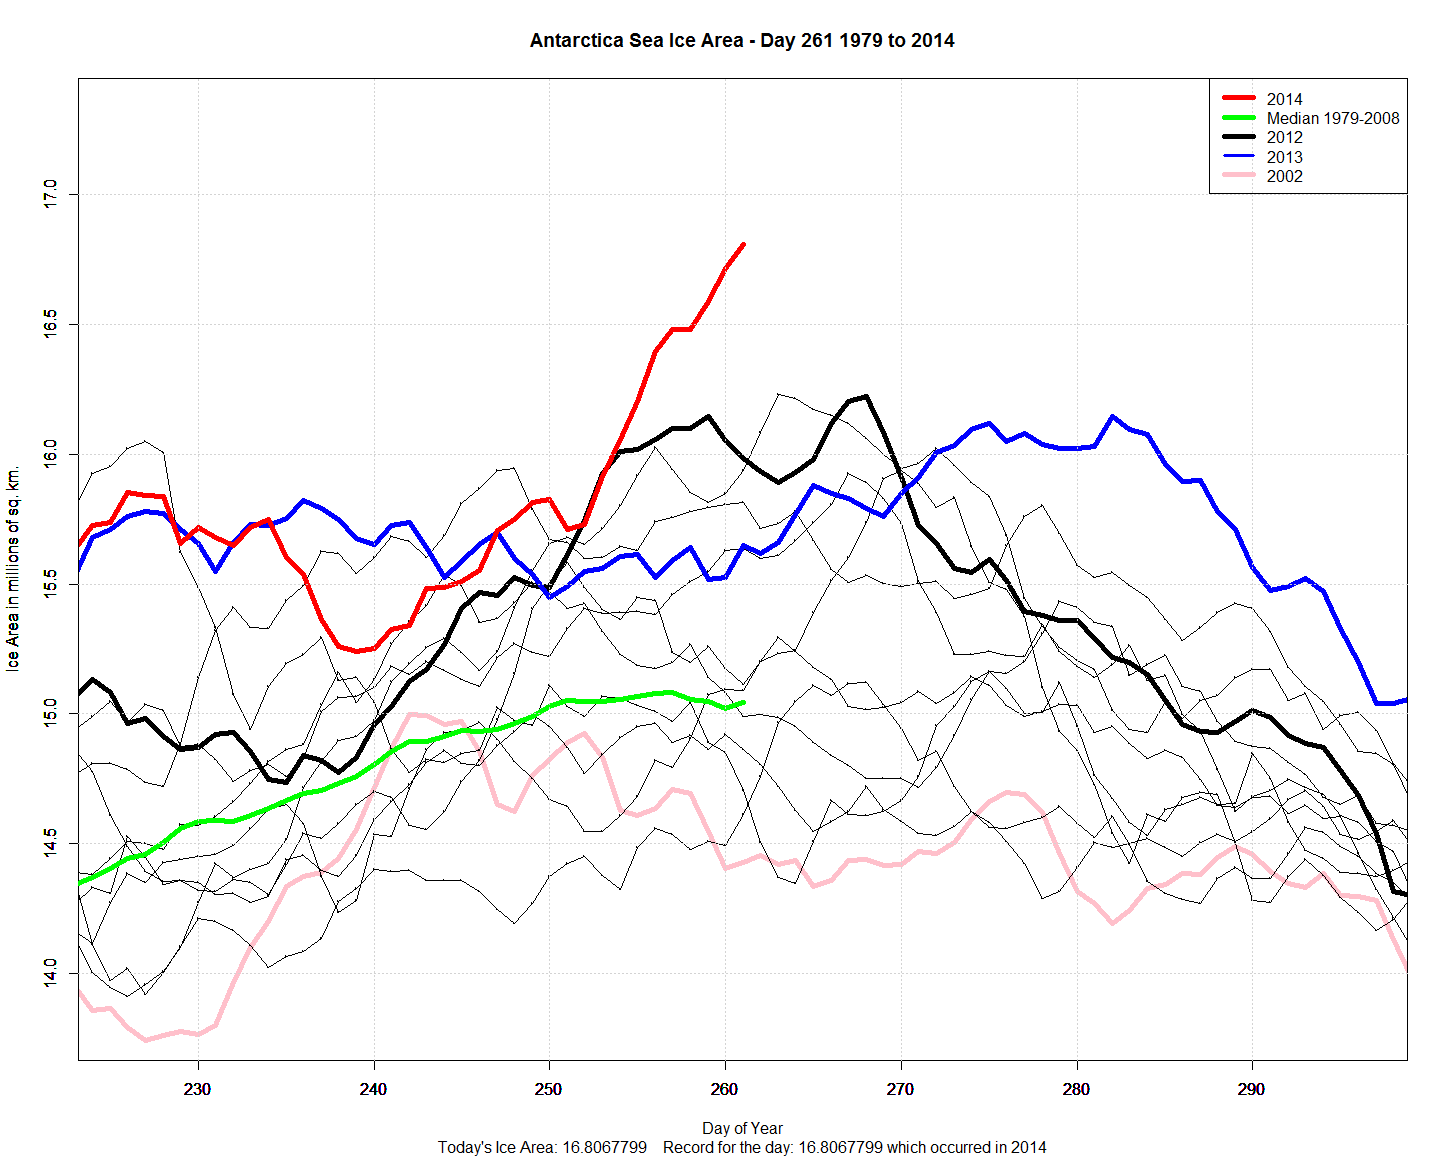
Antarctic Sea Ice Area is still skyrocketing. (difference between Area/Extent here)
Another day another 125,000 sq km. Ice Age?
