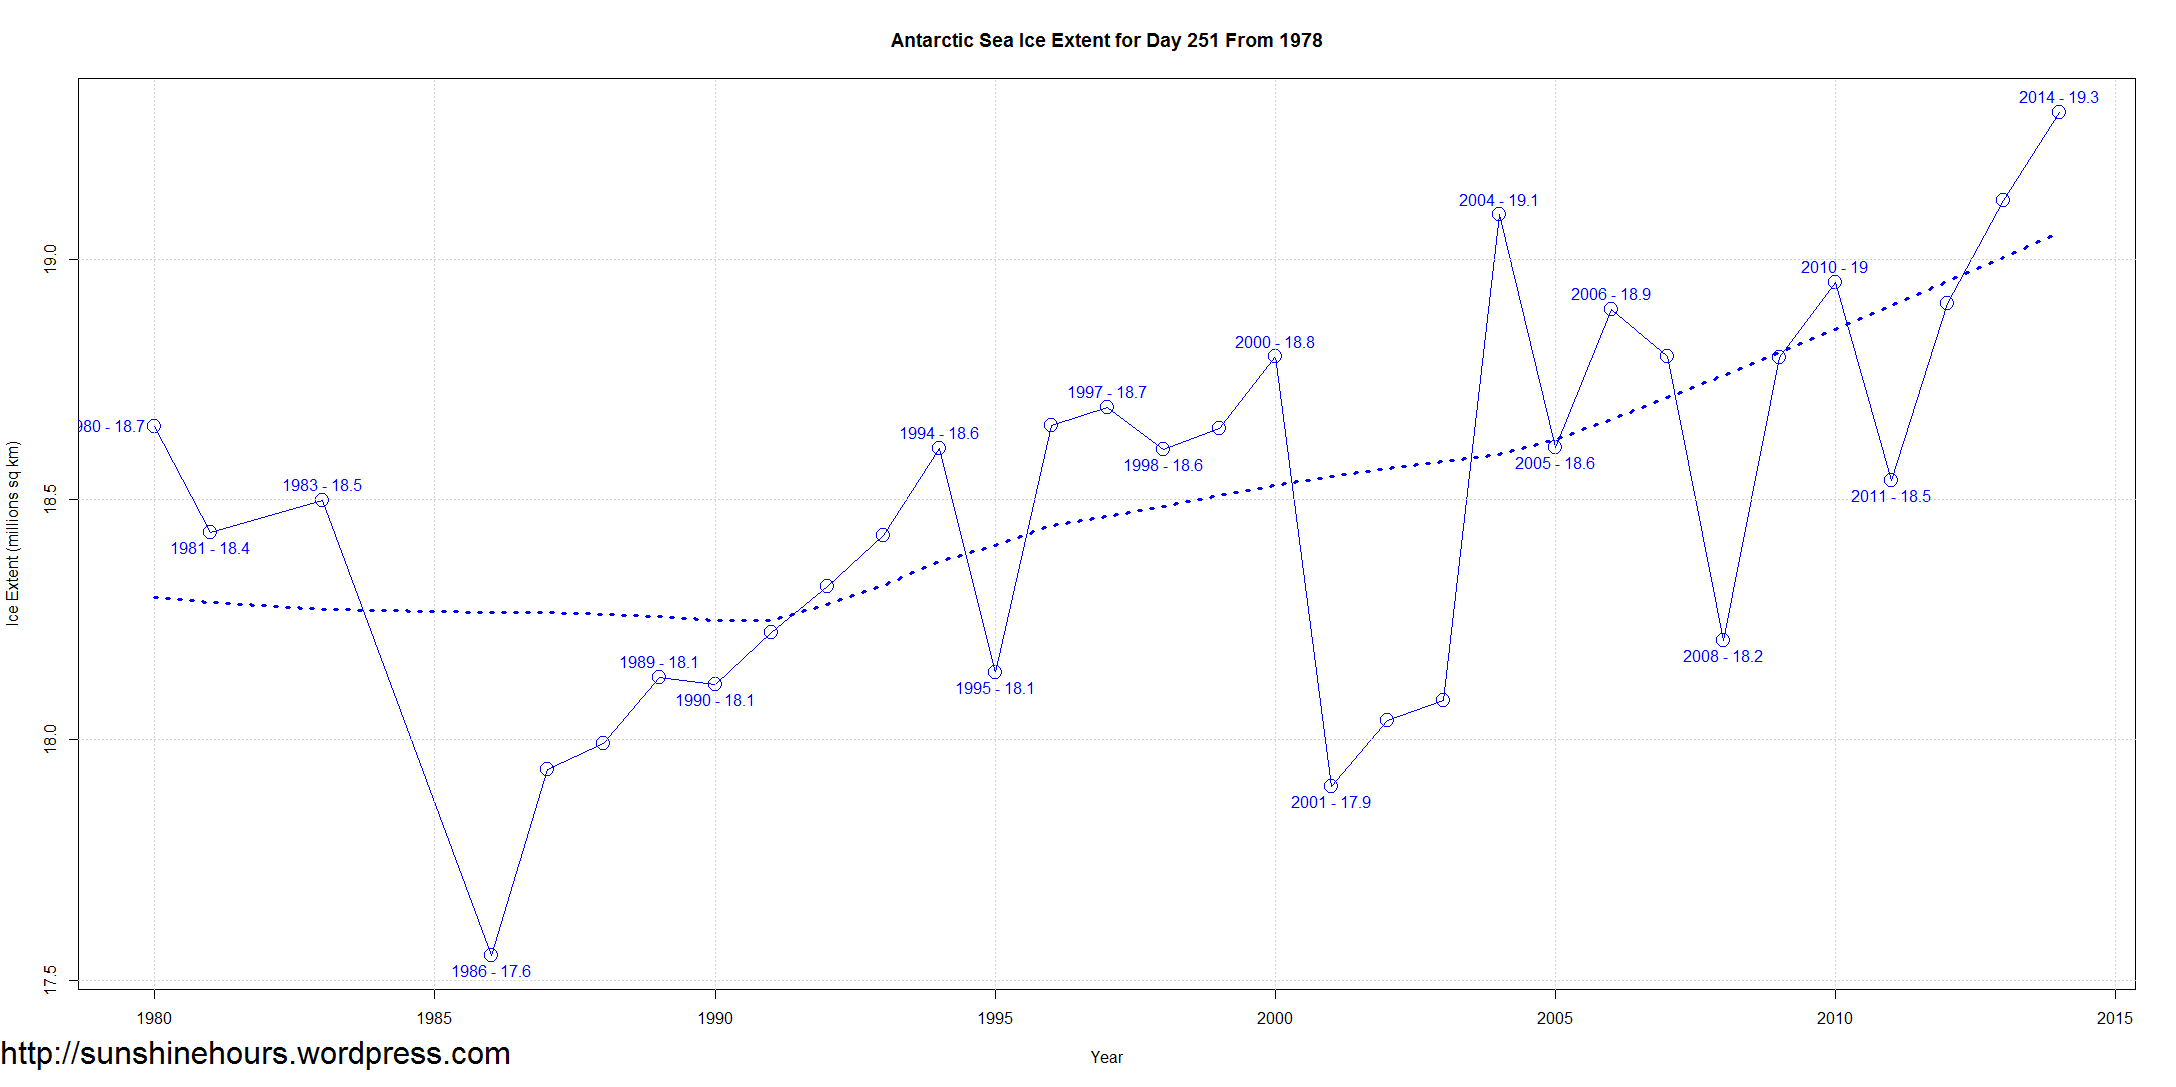
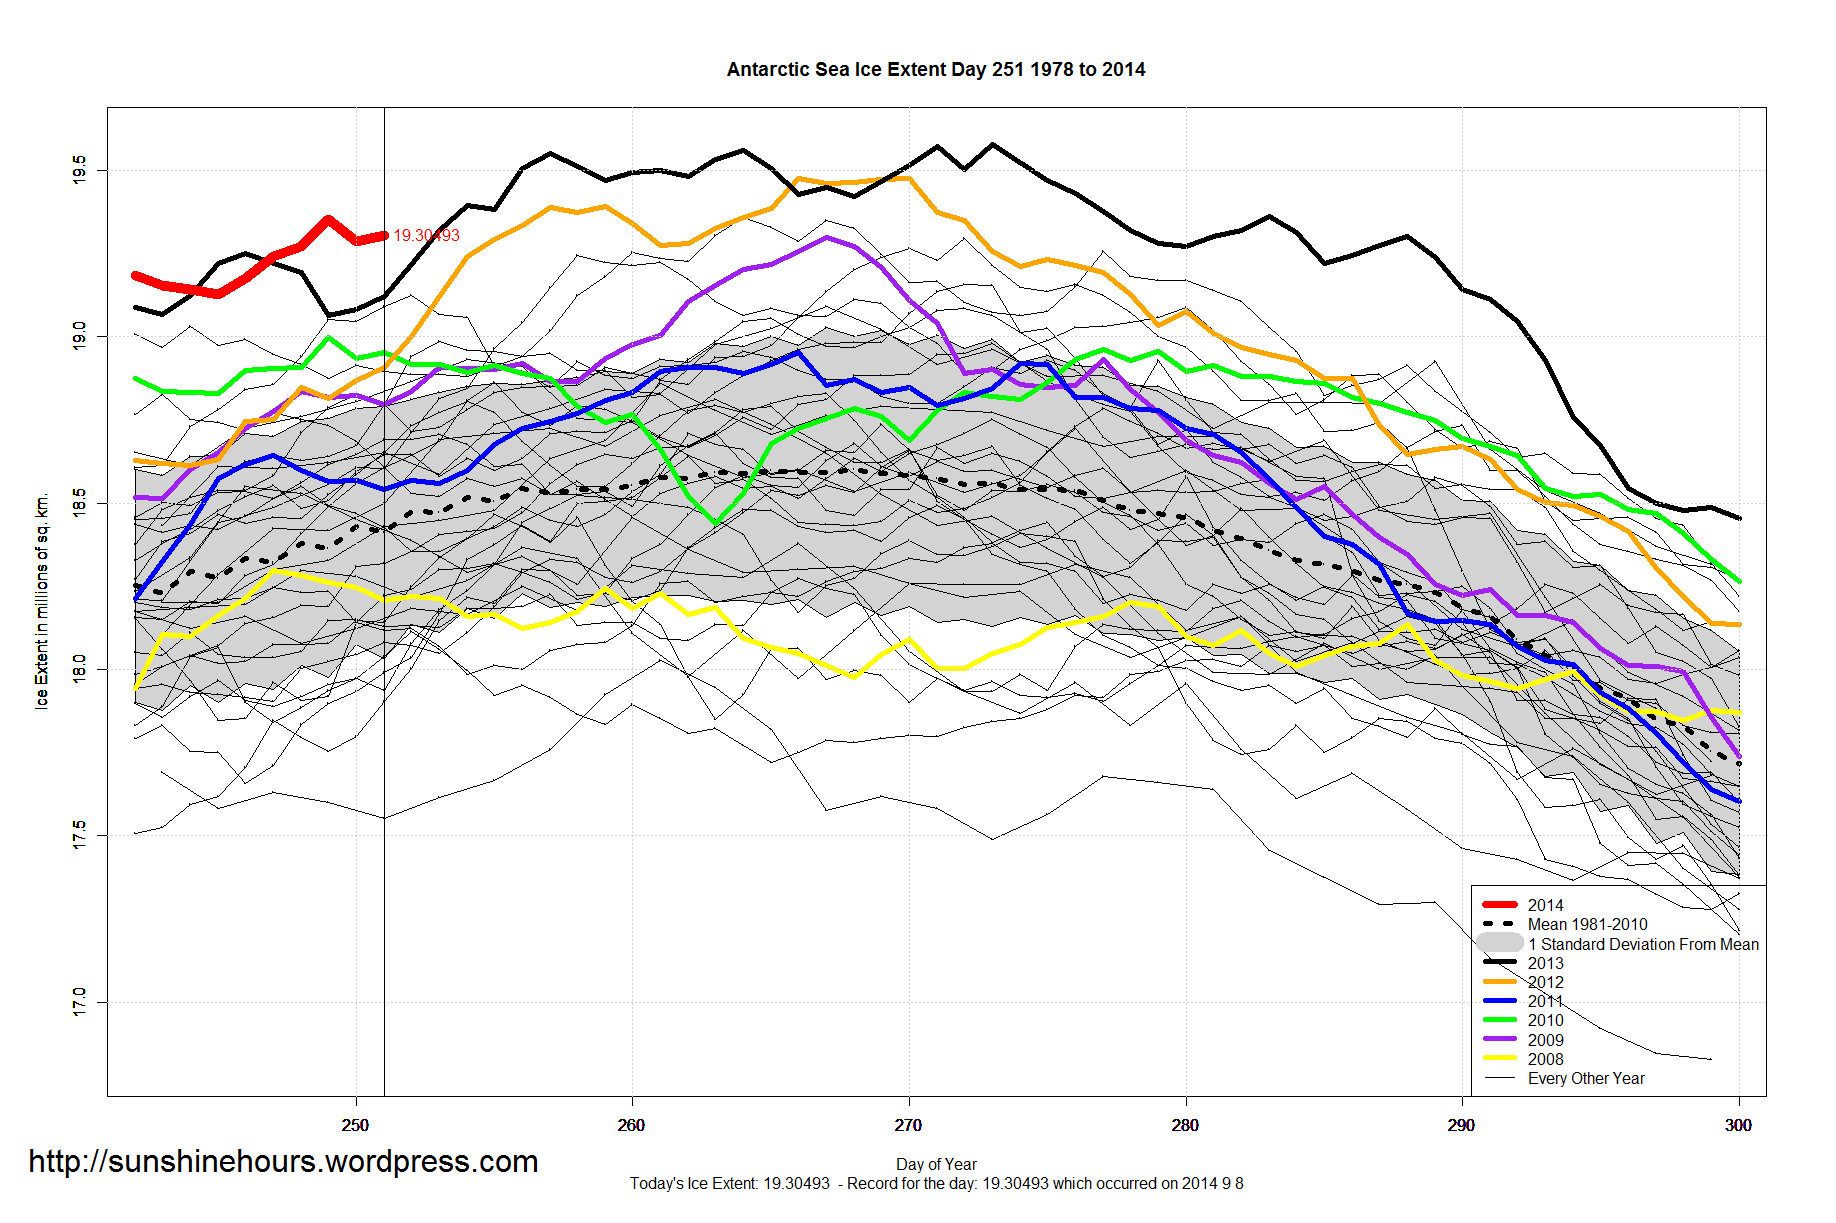
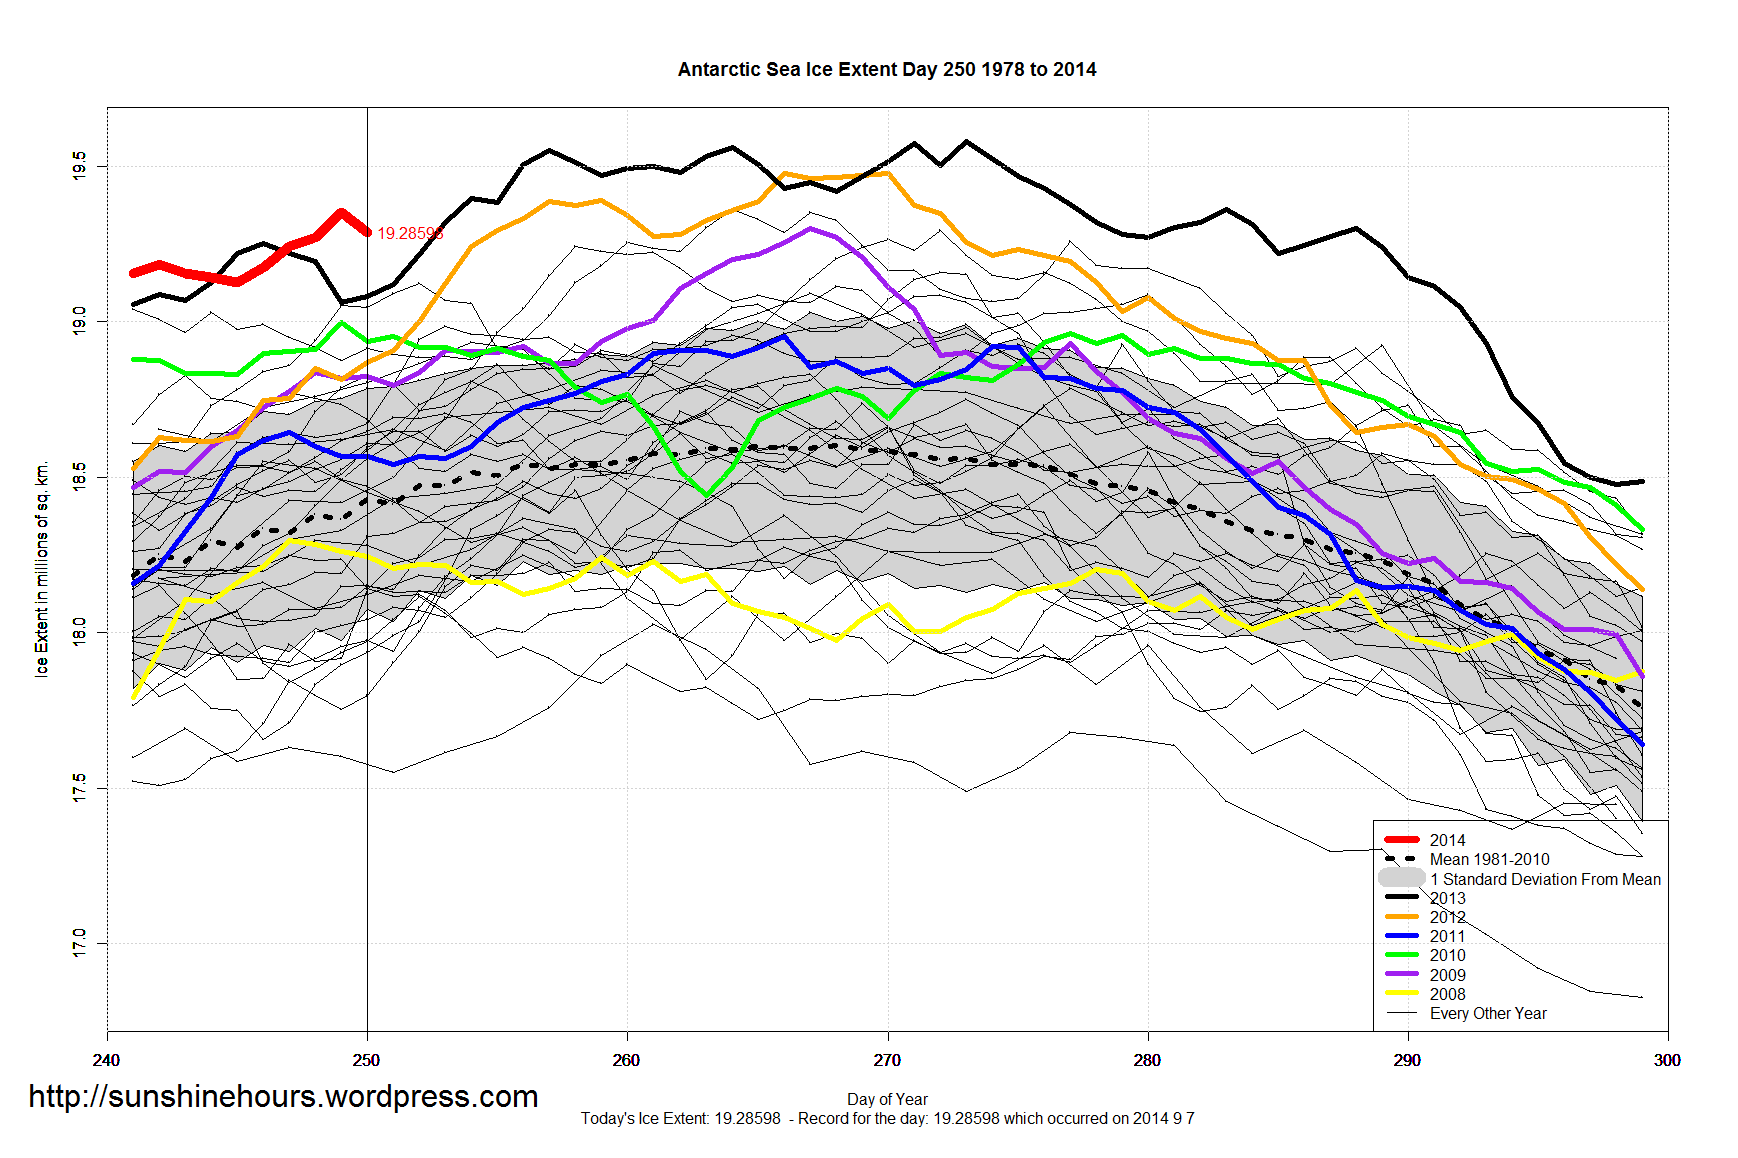
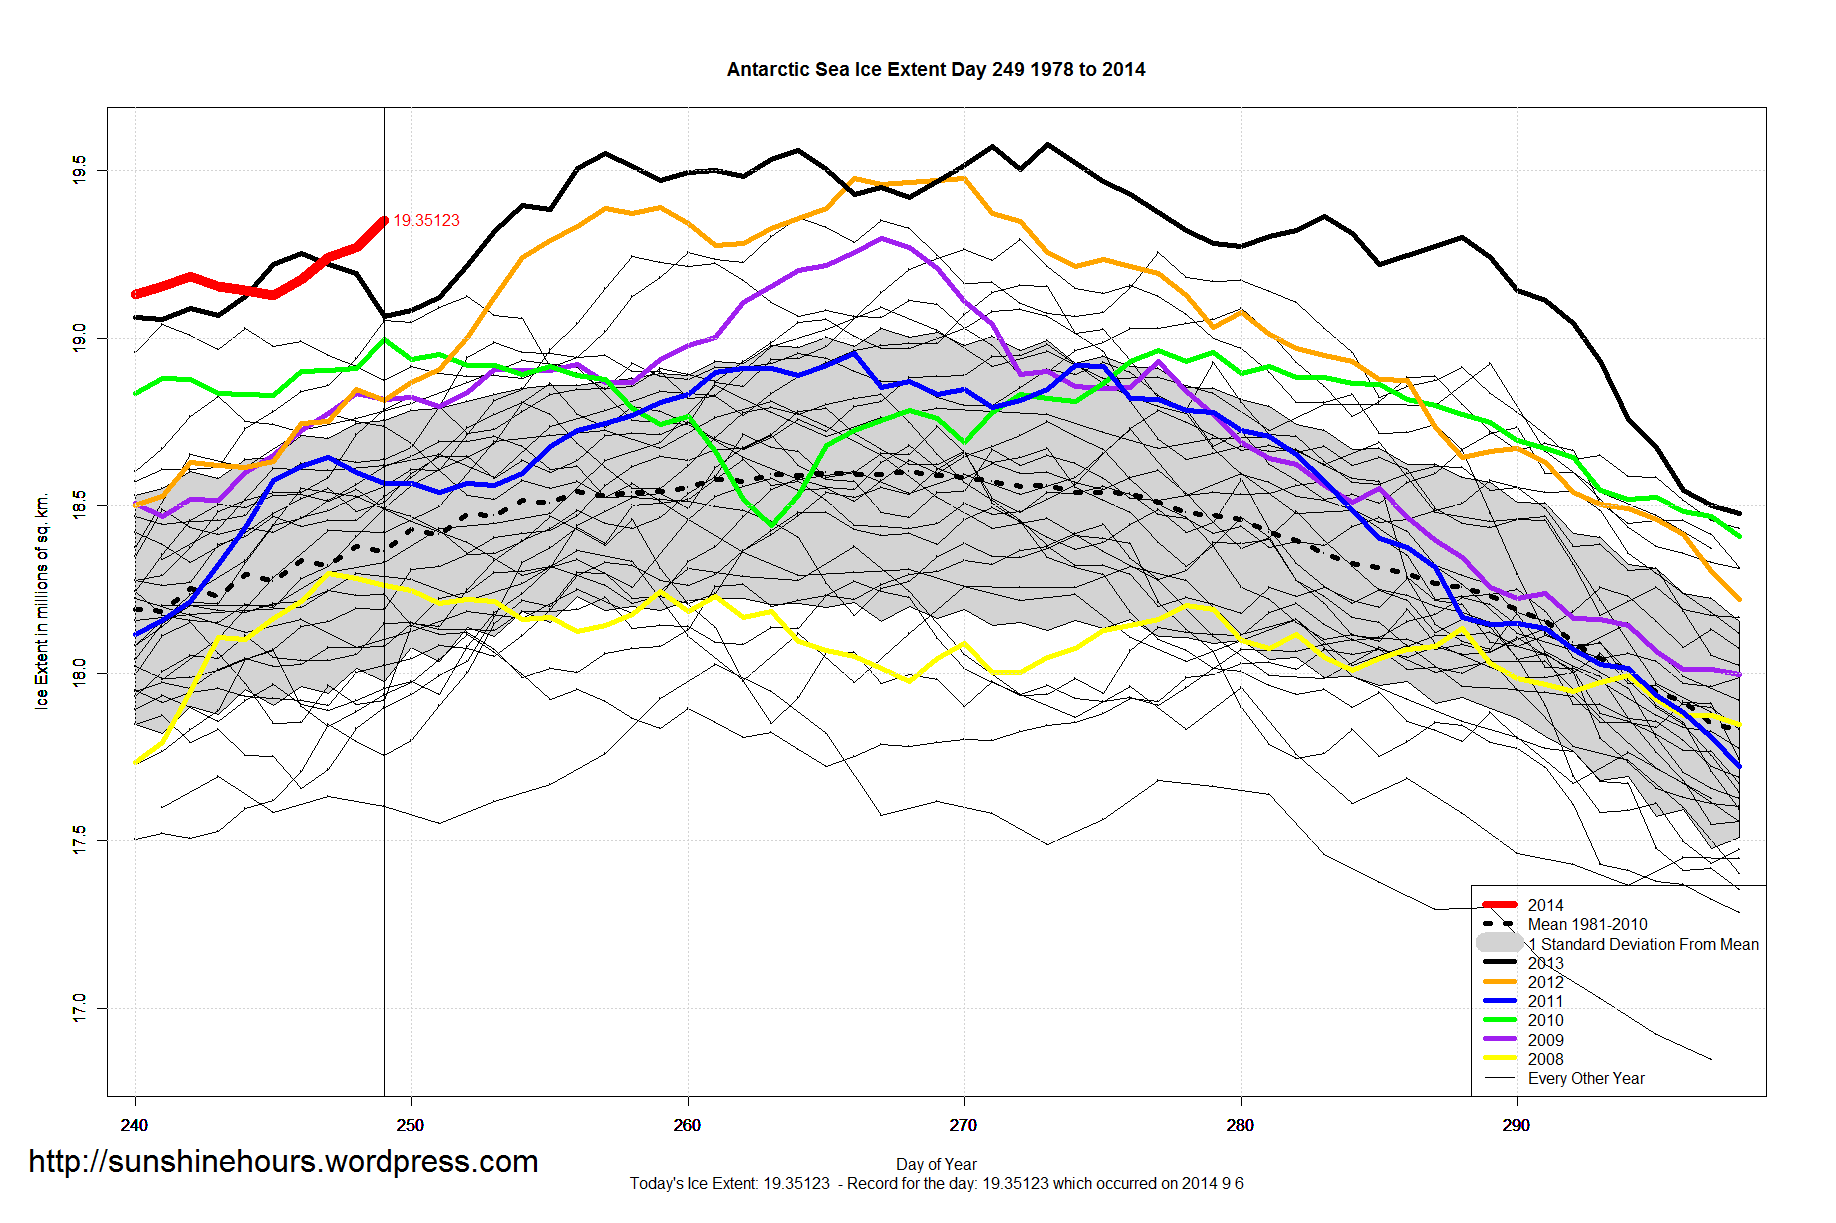
Antarctic Sea Ice Extent Sep 09 2014 – 892,000 sq km above the 1981-2010 mean. Data for Day 251. Data here.
168th daily record.

Antarctic Sea Ice Extent Sep 09 2014 – 892,000 sq km above the 1981-2010 mean. Data for Day 251. Data here.
168th daily record.
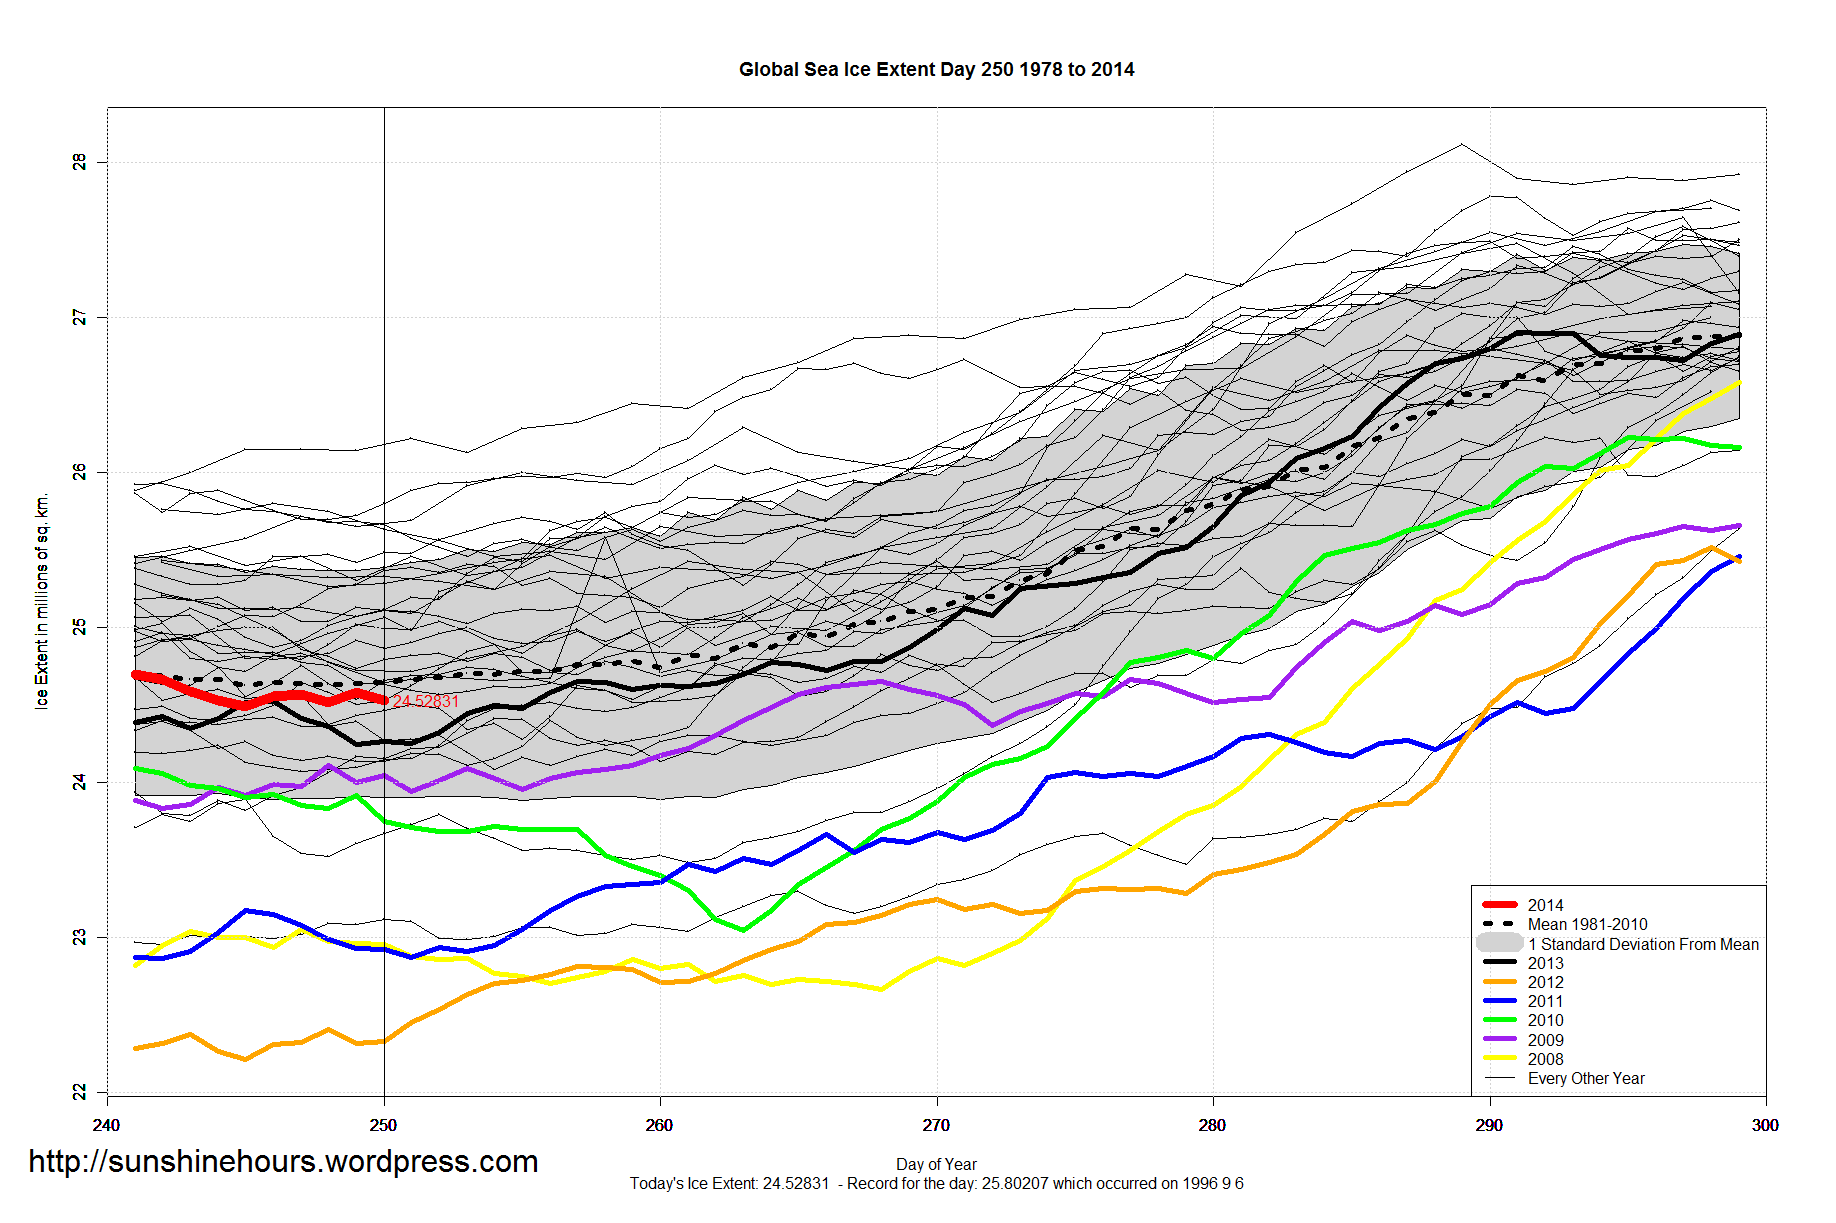
Global Sea Ice Extent Sep 08 2014 – -120,000 sq km below the 1981-2010 mean. Data for Day 250. Data here.
Slightly below the mean – highest Since 2006

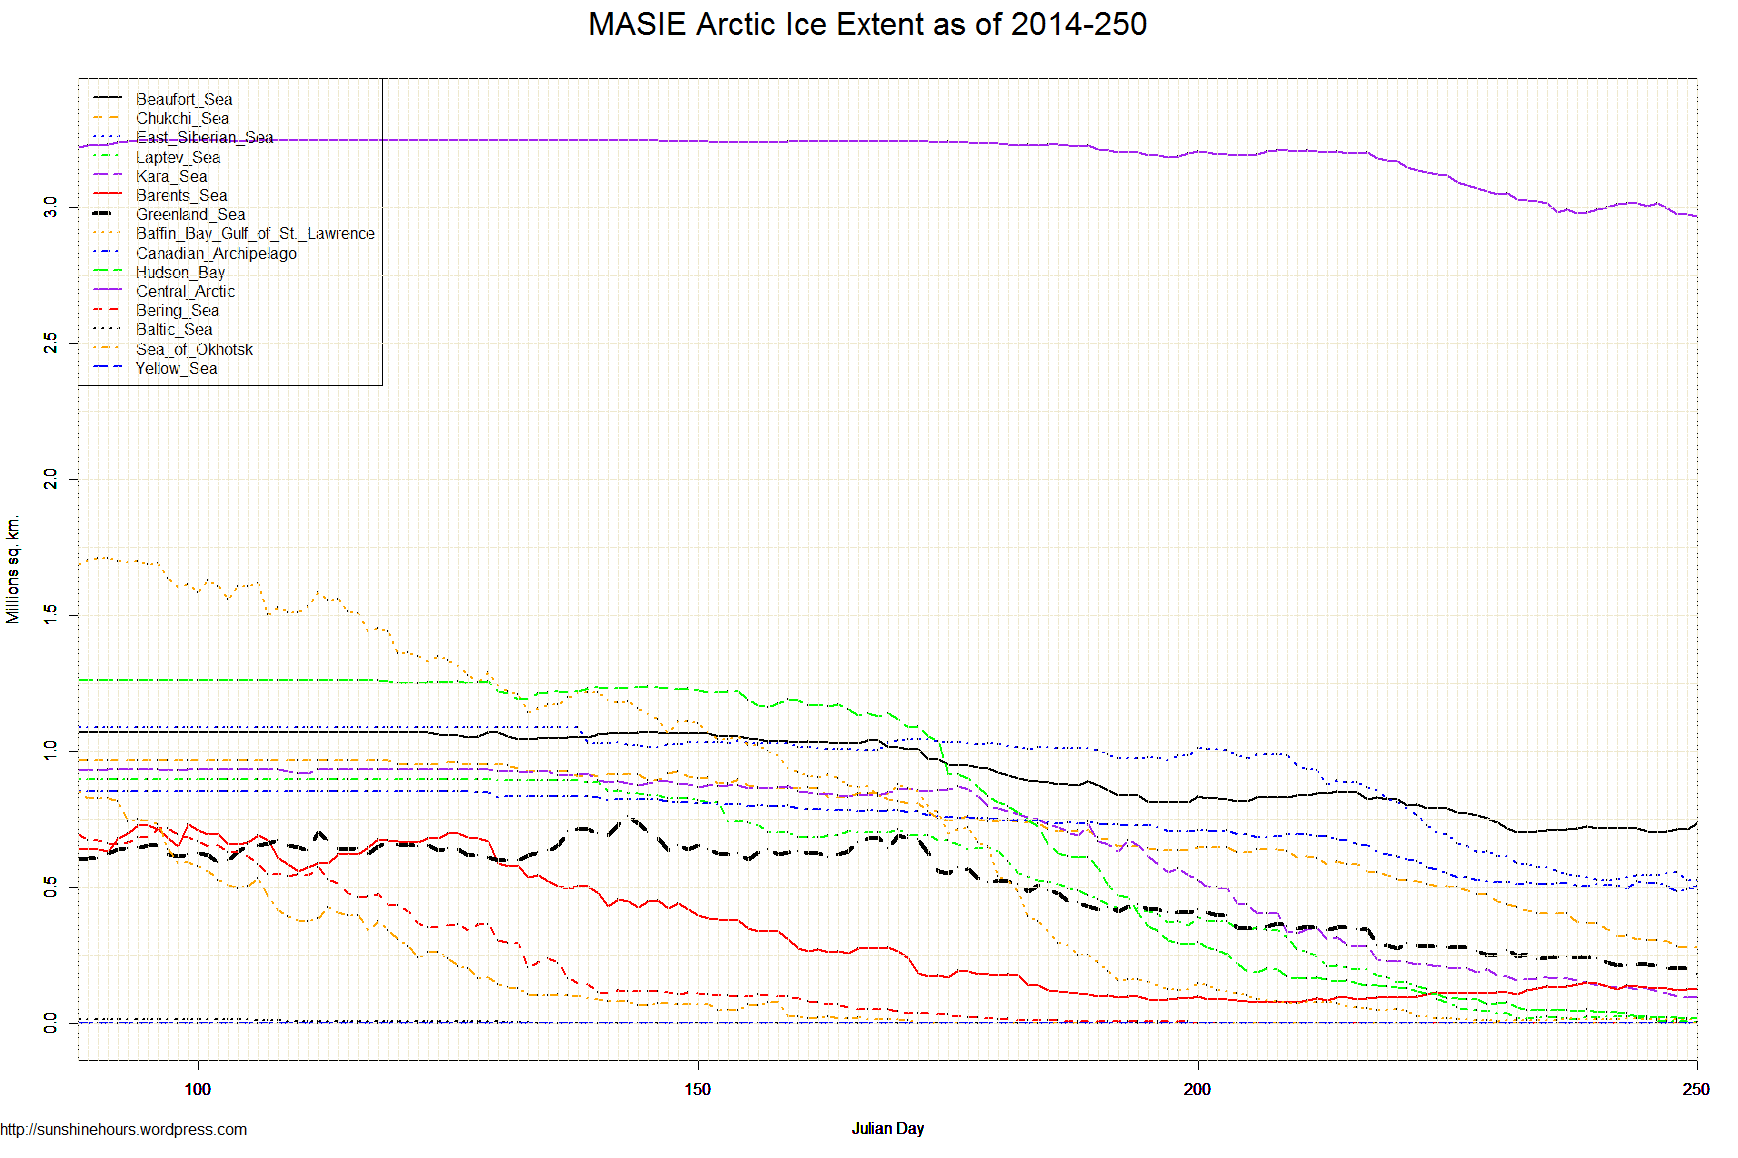
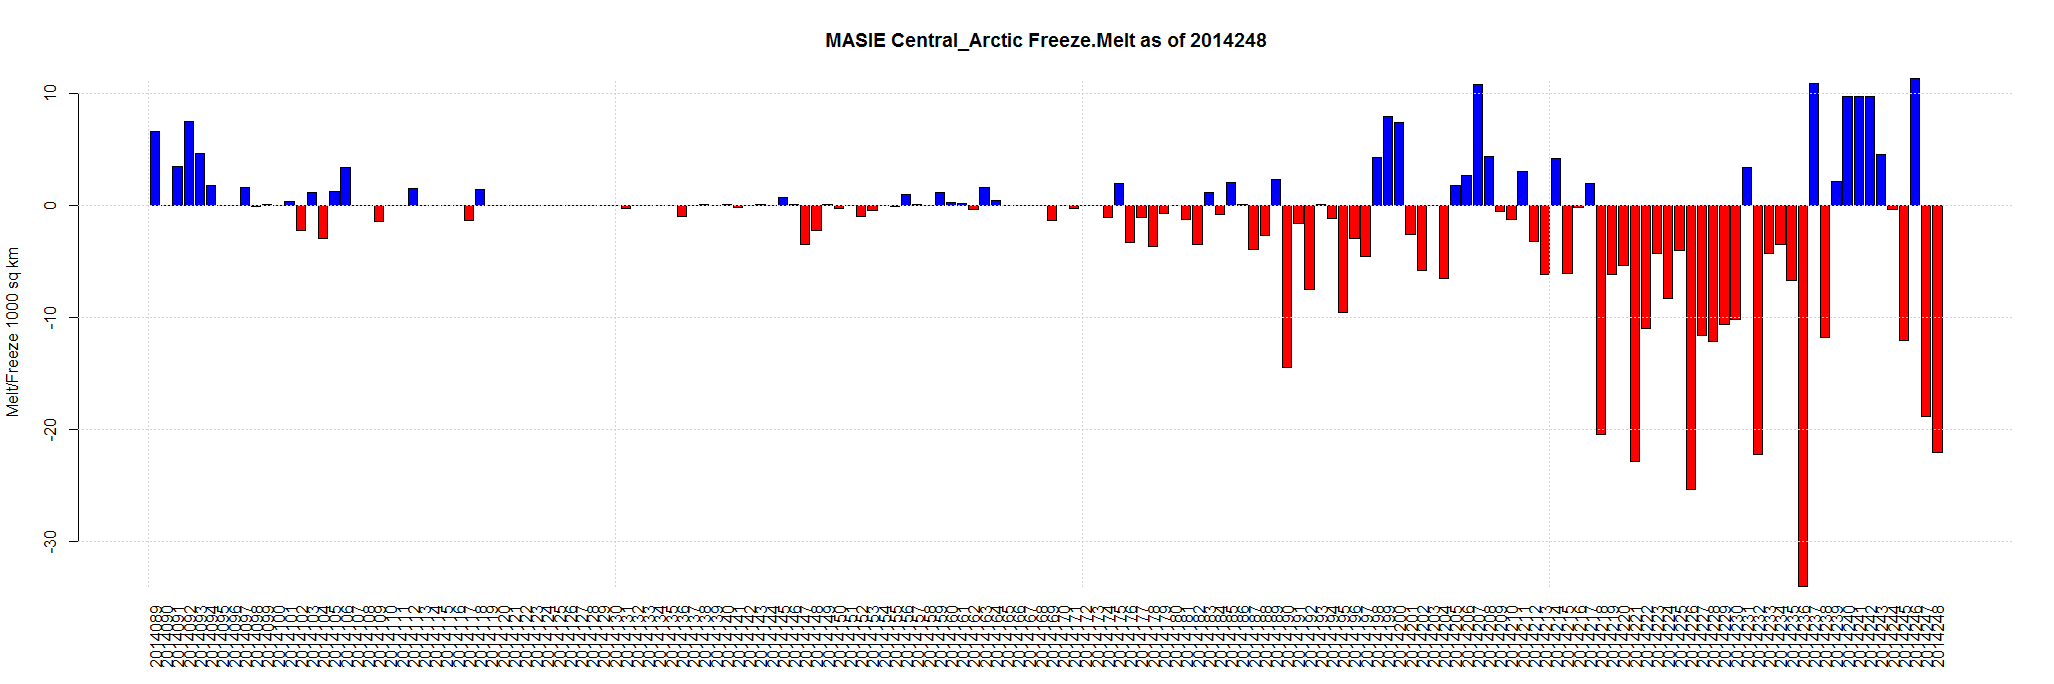
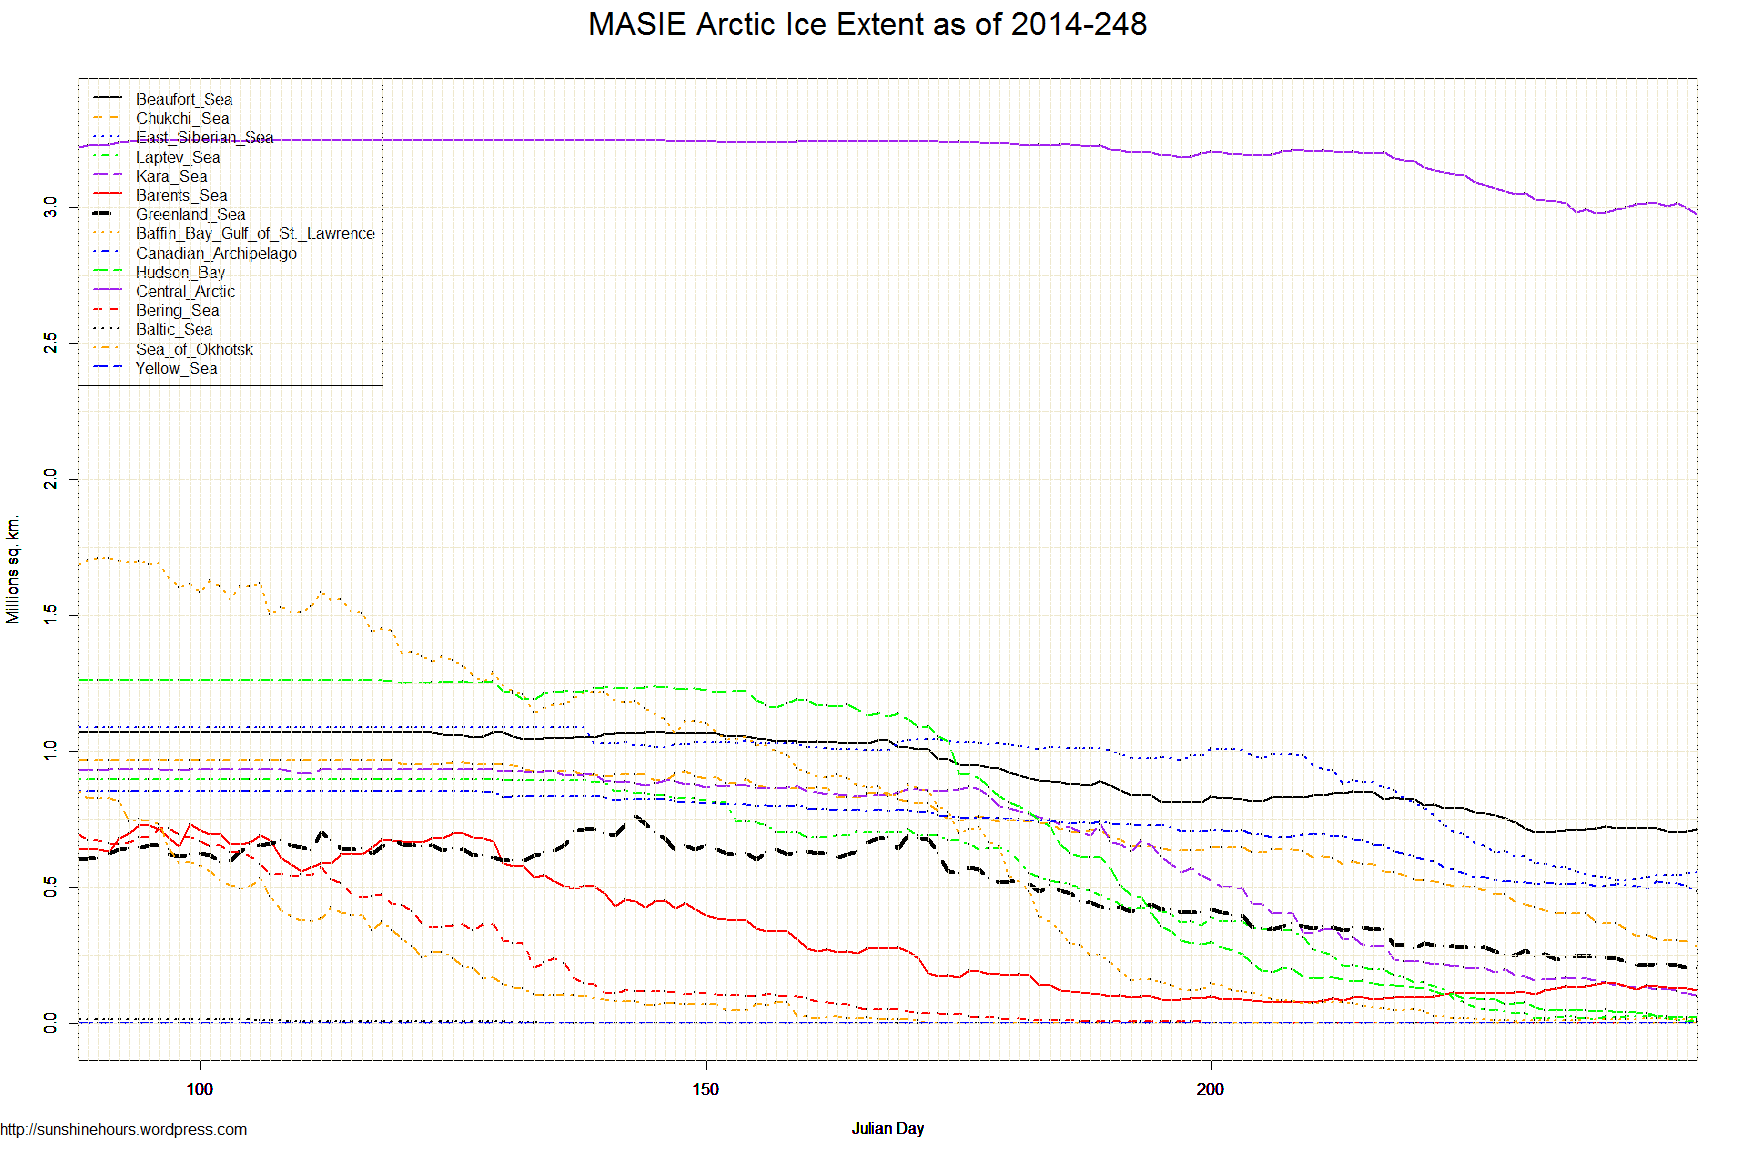
Sept 8 2014 MASIE Update – Tiny Gain – Central Arctic Losses Shrink
Data here. Click for bigger.
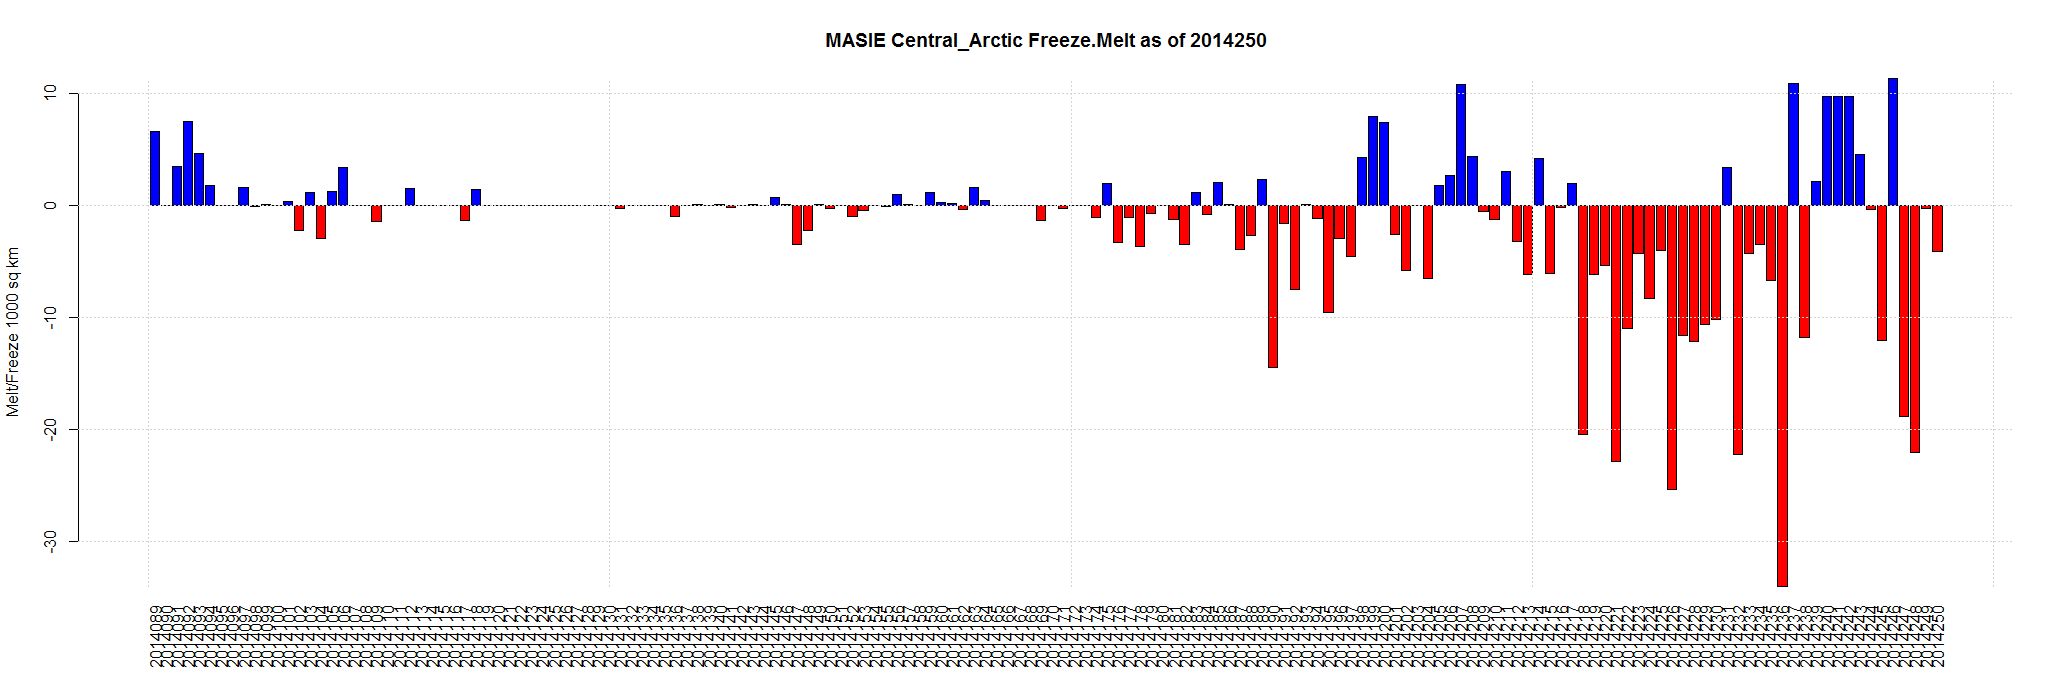

| Region | 163 days ago | End | Last 162 | Last 28 | Last 14 | Last 7 | Last 3 | Last 1 |
| Greenland Sea | 603,416 | 181,050 | -422,366 | -107,920 | -65,228 | -33,303 | -23,063 | -20,409 |
| Central Arctic | 3,221,921 | 2,968,800 | -253,121 | -165,937 | -11,731 | -46,477 | -26,501 | -4,137 |
| Barents Sea | 645,917 | 124,699 | -521,218 | 25,108 | -6,880 | -14,657 | -5,225 | -1,399 |
| Kara Sea | 933,859 | 96,216 | -837,644 | -120,965 | -70,240 | -35,190 | -15,204 | -994 |
| Hudson Bay | 1,260,903 | 20,349 | -1,240,554 | -96,437 | -29,389 | -18,411 | -1,684 | -424 |
| Laptev Sea | 897,845 | 6,084 | -891,760 | -131,835 | -15,339 | -20,988 | -3,444 | -326 |
| Bering Sea | 697,324 | 0 | -697,324 | 0 | 0 | 0 | 0 | 0 |
| Baltic Sea | 15,337 | 0 | -15,337 | 0 | 0 | 0 | 0 | 0 |
| Sea of Okhotsk | 853,240 | 0 | -853,240 | 0 | 0 | 0 | 0 | 0 |
| Yellow Sea | 0 | 0 | 0 | 0 | 0 | 0 | 0 | 0 |
| Chukchi Sea | 966,006 | 281,531 | -684,475 | -241,025 | -123,322 | -43,379 | -22,031 | 397 |
| Baffin Bay Gulf of St. Lawrence | 1,688,530 | 18,010 | -1,670,521 | -9,558 | 7,767 | 531 | 3,039 | 1,754 |
| East Siberian Sea | 1,087,137 | 527,541 | -559,596 | -239,256 | -32,520 | -11,800 | -25,367 | 2,131 |
| Canadian Archipelago | 853,214 | 503,775 | -349,439 | -92,054 | -11,719 | 8,357 | -471 | 9,751 |
| Beaufort Sea | 1,070,445 | 734,191 | -336,254 | -71,757 | 22,919 | 16,257 | 27,194 | 19,392 |
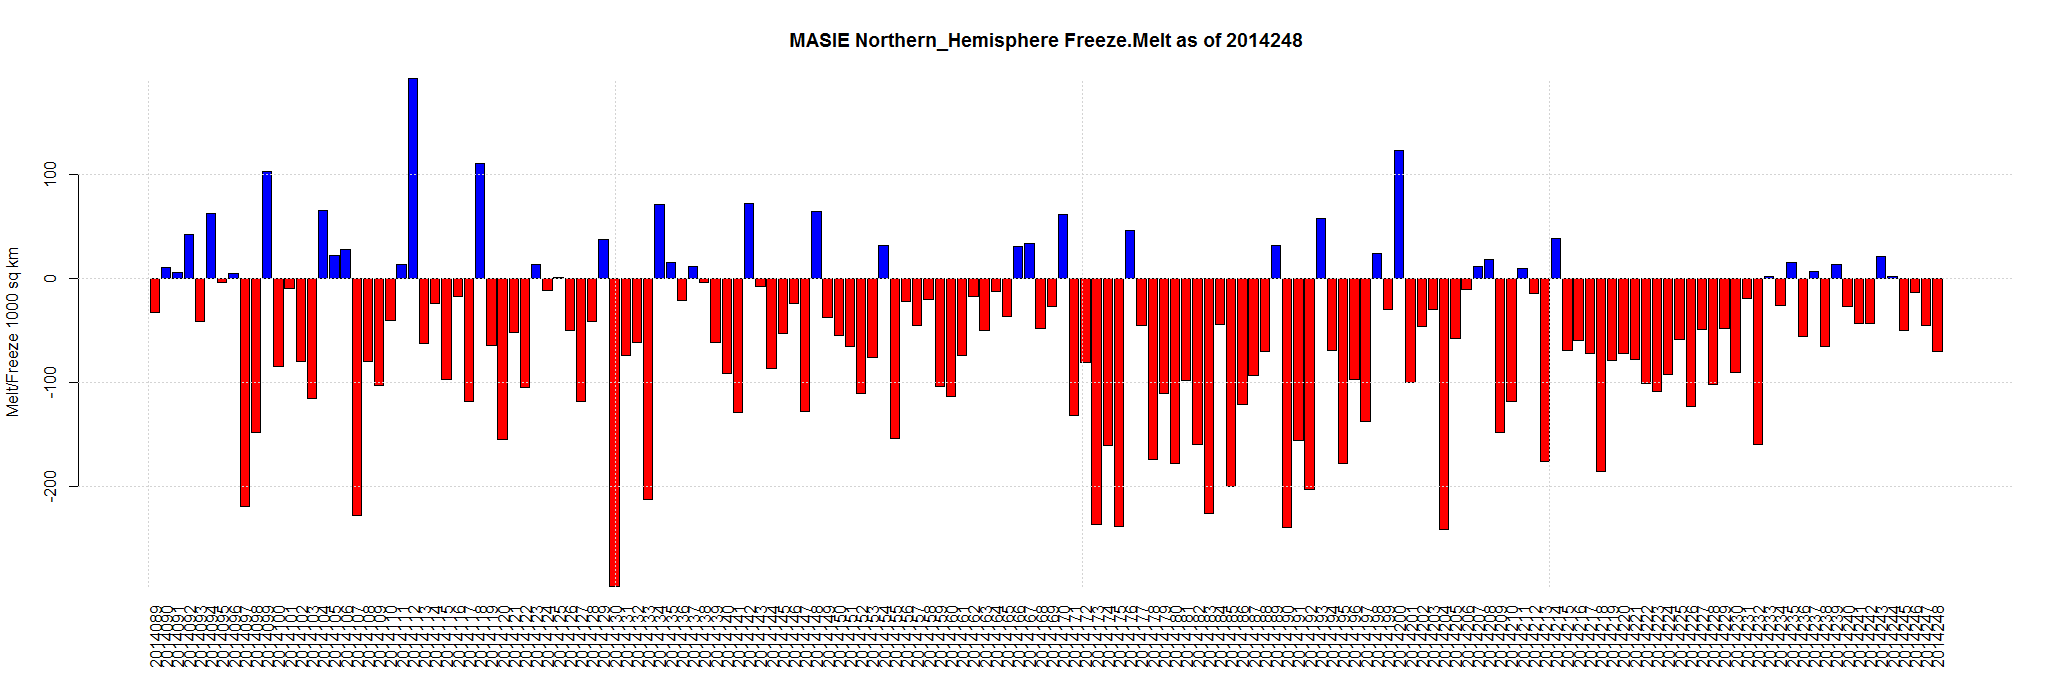
| Northern Hemisphere (Total) | 14,805,115 | 5,463,388 | -9,341,727 | -1,251,636 | -335,682 | -199,060 | -92,757 | 5,735 |
| NH (Average Loss per Day) | -57,311 | -44,701 | -23,977 | -28,437 | -30,919 | 5,735 |
Oooops. Germany Forgot About Eclipses and their effect on a power grid with lots of expensive solar.
The German power grid operators are dreading March 20, 2015. On this day Germany will see a partial solar eclipse during the morning. Should there be no clouds in the sky at this time, all solar power generating systems all over the country would be feeding in drastically less power into the grid in just a matter of minutes – and the grids would become dangerously destabilized.”
Read the rest at NoTricksZone.
Antarctic Sea Ice Extent Sep 08 2014 – 856,000 sq km above the 1981-2010 mean. Data for Day 250. Data here.

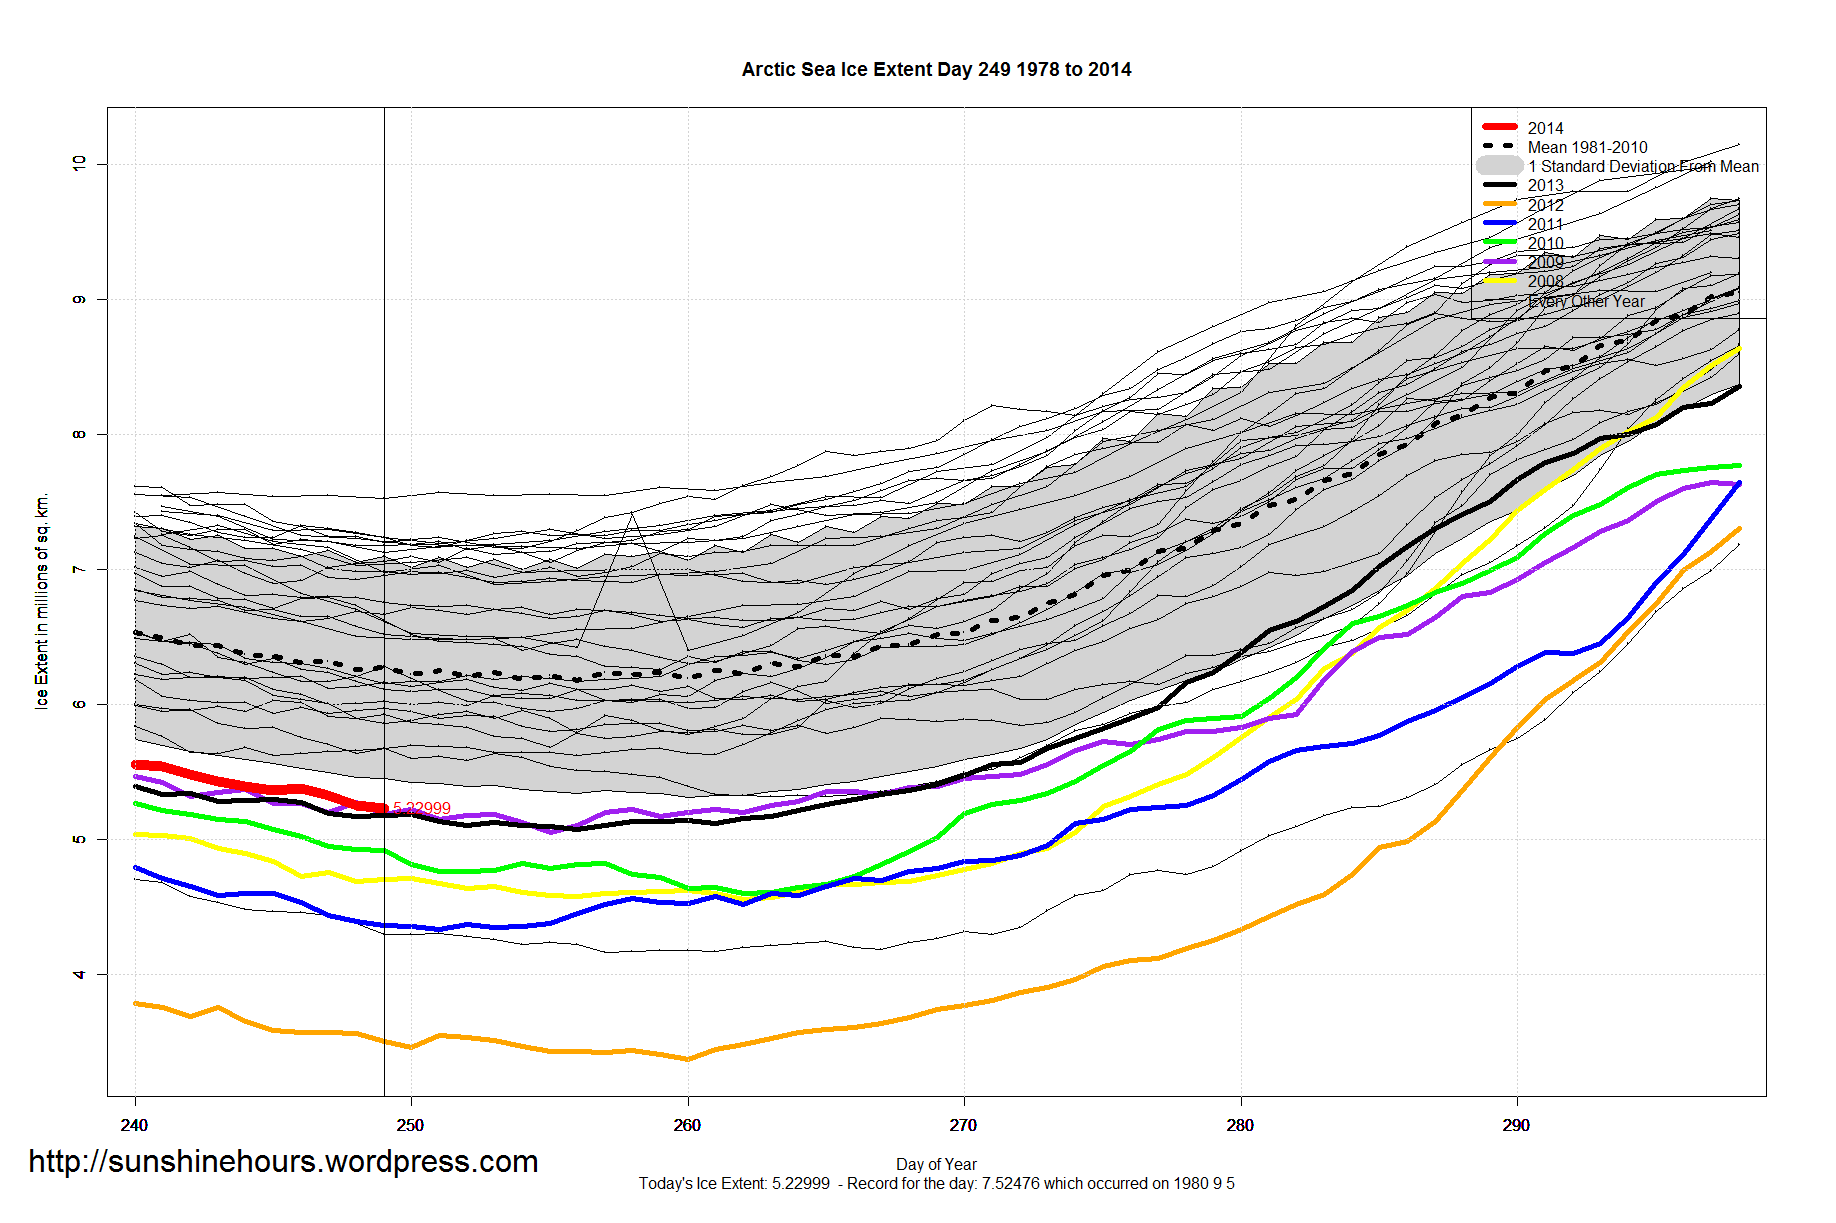
Arctic Sea Ice Extent Sep 08 2014 – -976,000 sq km below the 1981-2010 mean. Data for Day 250. Data here.
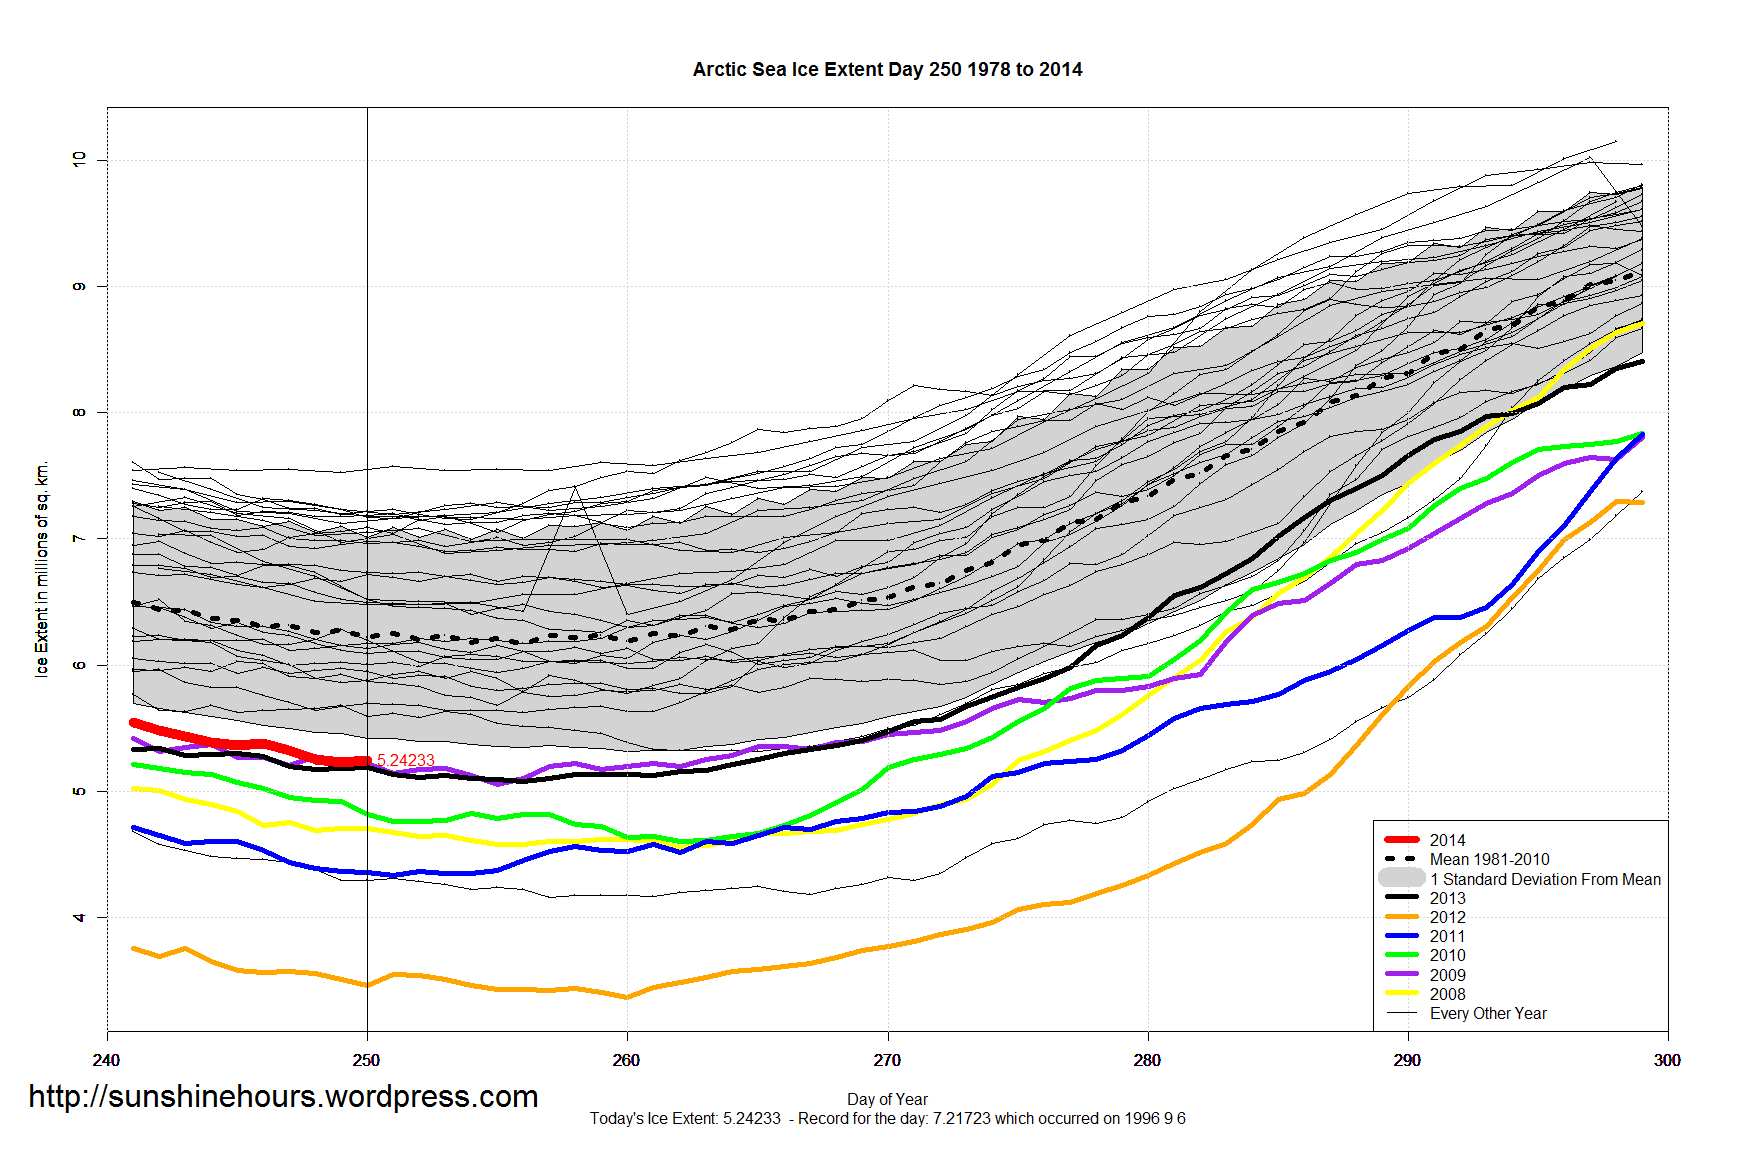

Arctic Sea Ice Extent Sep 07 2014 – -1,045,000 sq km below the 1981-2010 mean. Data for Day 249. Data here.

Antarctic Sea Ice Extent Sep 07 2014 – 986,000 sq km above the 1981-2010 mean. Data for Day 249. Data here.
Wow. The old Daily Record is Smashed By 290,000 sq km.
Only 37 days had more Antarctic Sea Ice Extent. One of those days was in 2006. All the rest were in 2012 and 2013.

Sept 6 2014 MASIE Update – Central Arctic Takes a Tumble
Data here. Click for bigger.
| Region | 161 days ago | End | Last 160 | Last 28 | Last 14 | Last 7 | Last 3 | Last 1 |
| Central Arctic | 3,221,921 | 2,973,233 | -248,689 | -195,406 | -48,016 | -27,861 | -29,620 | -22,069 |
| Chukchi Sea | 966,006 | 284,201 | -681,805 | -245,480 | -121,921 | -61,631 | -21,300 | -19,360 |
| Canadian Archipelago | 853,214 | 487,137 | -366,077 | -128,130 | -24,762 | -21,989 | -27,816 | -17,109 |
| Kara Sea | 933,859 | 101,124 | -832,735 | -127,704 | -66,221 | -35,730 | -27,780 | -10,296 |
| Barents Sea | 645,917 | 121,208 | -524,709 | 24,595 | -9,978 | -14,612 | -13,413 | -8,716 |
| Laptev Sea | 897,845 | 6,411 | -891,434 | -144,705 | -16,516 | -18,746 | -11,058 | -3,117 |
| Greenland Sea | 603,416 | 201,459 | -401,957 | -75,881 | -33,410 | -24,703 | -15,061 | -2,654 |
| Bering Sea | 697,324 | 0 | -697,324 | 0 | 0 | 0 | 0 | 0 |
| Baltic Sea | 15,337 | 0 | -15,337 | 0 | 0 | 0 | 0 | 0 |
| Sea of Okhotsk | 853,240 | 0 | -853,240 | 0 | 0 | 0 | 0 | 0 |
| Yellow Sea | 0 | 0 | 0 | 0 | 0 | 0 | 0 | 0 |
| Baffin Bay Gulf of St. Lawrence | 1,688,530 | 15,151 | -1,673,379 | -37,735 | 4,909 | 698 | 404 | 180 |
| Hudson Bay | 1,260,903 | 23,551 | -1,237,352 | -109,899 | -26,332 | -18,712 | -4,074 | 1,518 |
| East Siberian Sea | 1,087,137 | 555,583 | -531,554 | -258,848 | -18,480 | 28,081 | 12,026 | 2,675 |
| Beaufort Sea | 1,070,445 | 715,487 | -354,958 | -108,677 | 7,066 | -2,833 | 8,573 | 8,490 |
| Northern Hemisphere (Total) | 14,805,115 | 5,485,686 | -9,319,428 | -1,407,870 | -353,662 | -198,039 | -129,118 | -70,459 |
| NH (Average Loss per Day) | -57,885 | -50,281 | -25,262 | -28,291 | -43,039 | -70,459 |
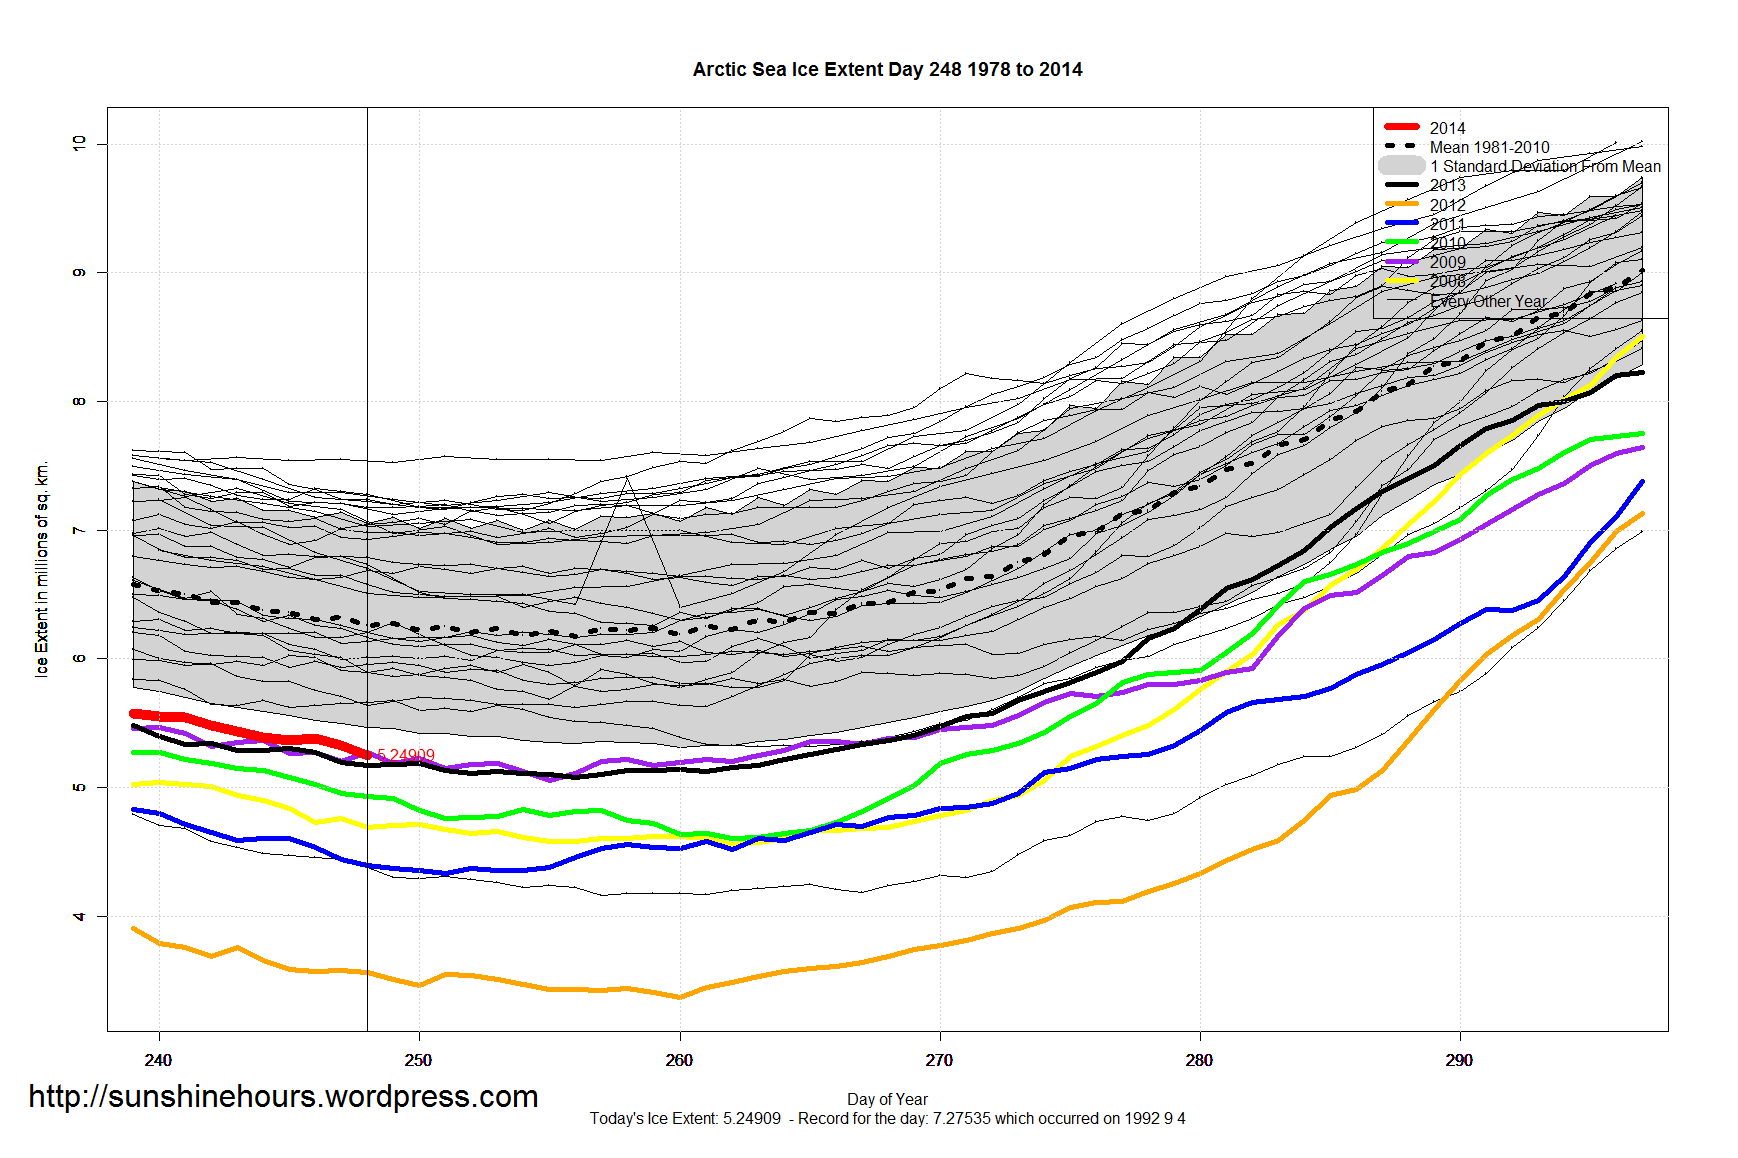
Arctic Sea Ice Extent Sep 06 2014 – -1,007,000 sq km below the 1981-2010 mean. Data for Day 248. Data here.