Oct 29 2014 MASIE Update – Only Two Regions Without Ice
| Region | 212 days ago | End | Last 211 | Last 28 | Last 14 | Last 7 | Last 3 | Last 1 |
| Baltic Sea | 15,337 | 0 | -15,337 | 0 | 0 | 0 | 0 | 0 |
| Yellow Sea | 0 | 0 | 0 | 0 | 0 | 0 | 0 | 0 |
| Bering Sea | 697,324 | 3,342 | -693,981 | 3,342 | 3,342 | 2,529 | 34 | 34 |
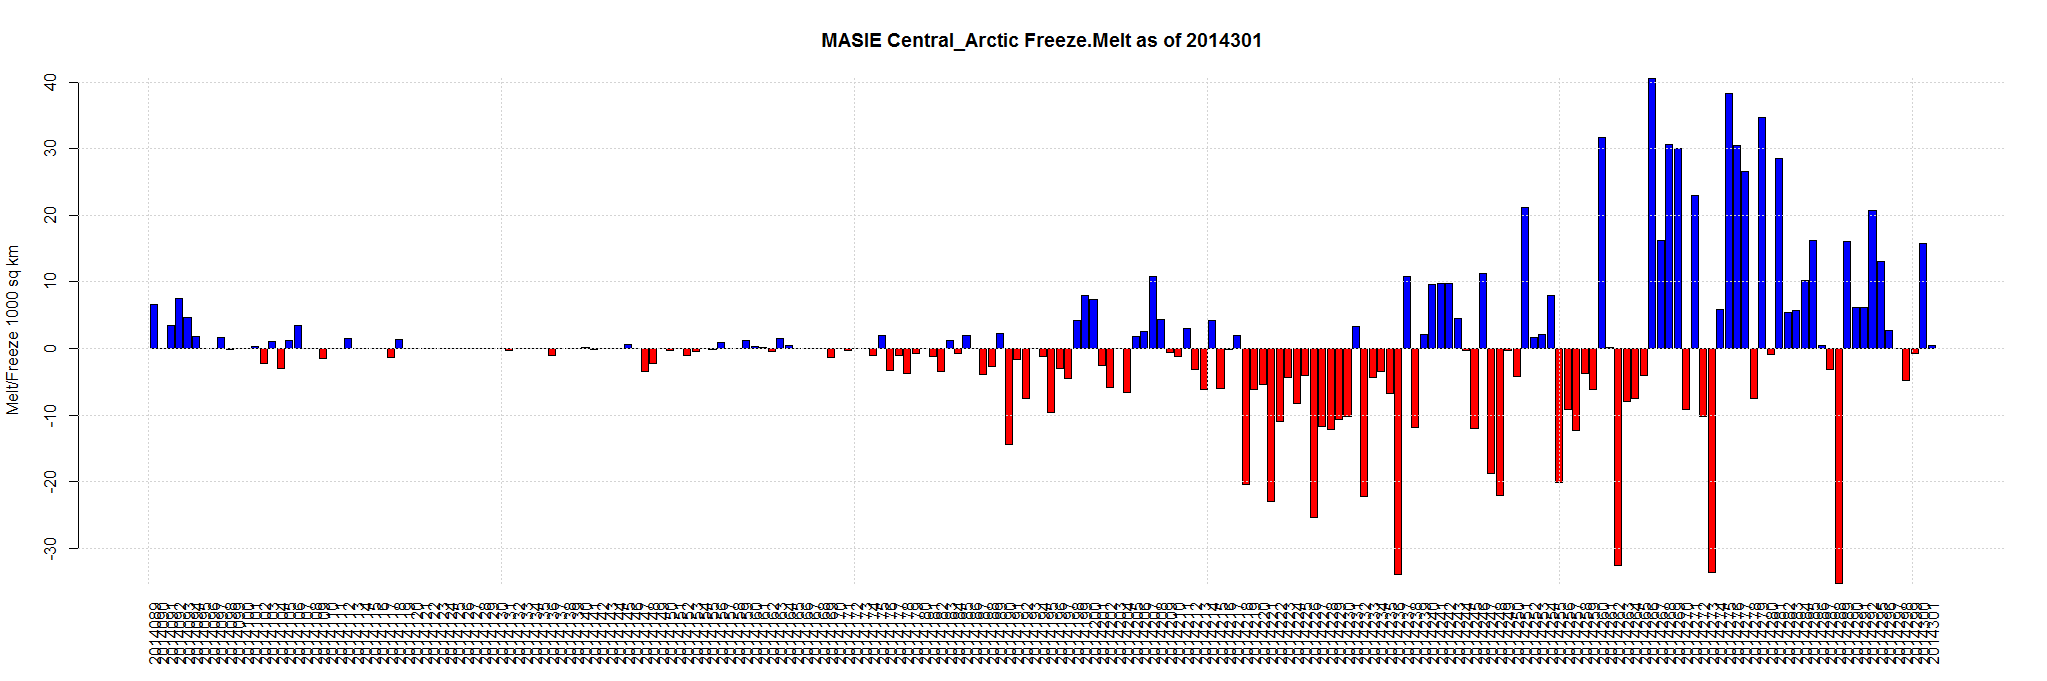
| Central Arctic | 3,221,921 | 3,247,977 | 26,055 | 186,927 | 37,438 | 26,208 | 15,357 | 398 |
| Barents Sea | 645,917 | 240,767 | -405,150 | 123,847 | 37,884 | -22,044 | 3,248 | 733 |
| Sea of Okhotsk | 853,240 | 1,635 | -851,604 | 1,635 | 1,635 | 1,635 | 1,635 | 1,635 |
| Baffin Bay Gulf of St. Lawrence | 1,688,530 | 266,679 | -1,421,852 | 235,877 | 192,047 | 195,890 | 97,688 | 3,355 |
| Greenland Sea | 603,416 | 392,606 | -210,809 | 131,289 | 18,288 | -13,060 | 1,643 | 3,600 |
| Hudson Bay | 1,260,903 | 85,461 | -1,175,443 | 84,013 | 43,730 | 54,735 | 21,966 | 3,846 |
| Kara Sea | 933,859 | 793,883 | -139,976 | 721,988 | 552,635 | 128,765 | 19,864 | 6,799 |
| Laptev Sea | 897,845 | 873,222 | -24,623 | 861,173 | 662,347 | 426,557 | 56,024 | 7,346 |
| East Siberian Sea | 1,087,137 | 808,201 | -278,936 | 354,033 | 272,011 | 96,236 | 61,349 | 10,905 |
| Chukchi Sea | 966,006 | 509,621 | -456,385 | 228,099 | 142,341 | 104,329 | 64,417 | 11,947 |
| Canadian Archipelago | 853,214 | 814,719 | -38,495 | 282,487 | 125,060 | 78,529 | 39,464 | 13,213 |
| Beaufort Sea | 1,070,445 | 957,782 | -112,663 | 256,068 | 172,094 | 118,163 | 82,970 | 39,746 |
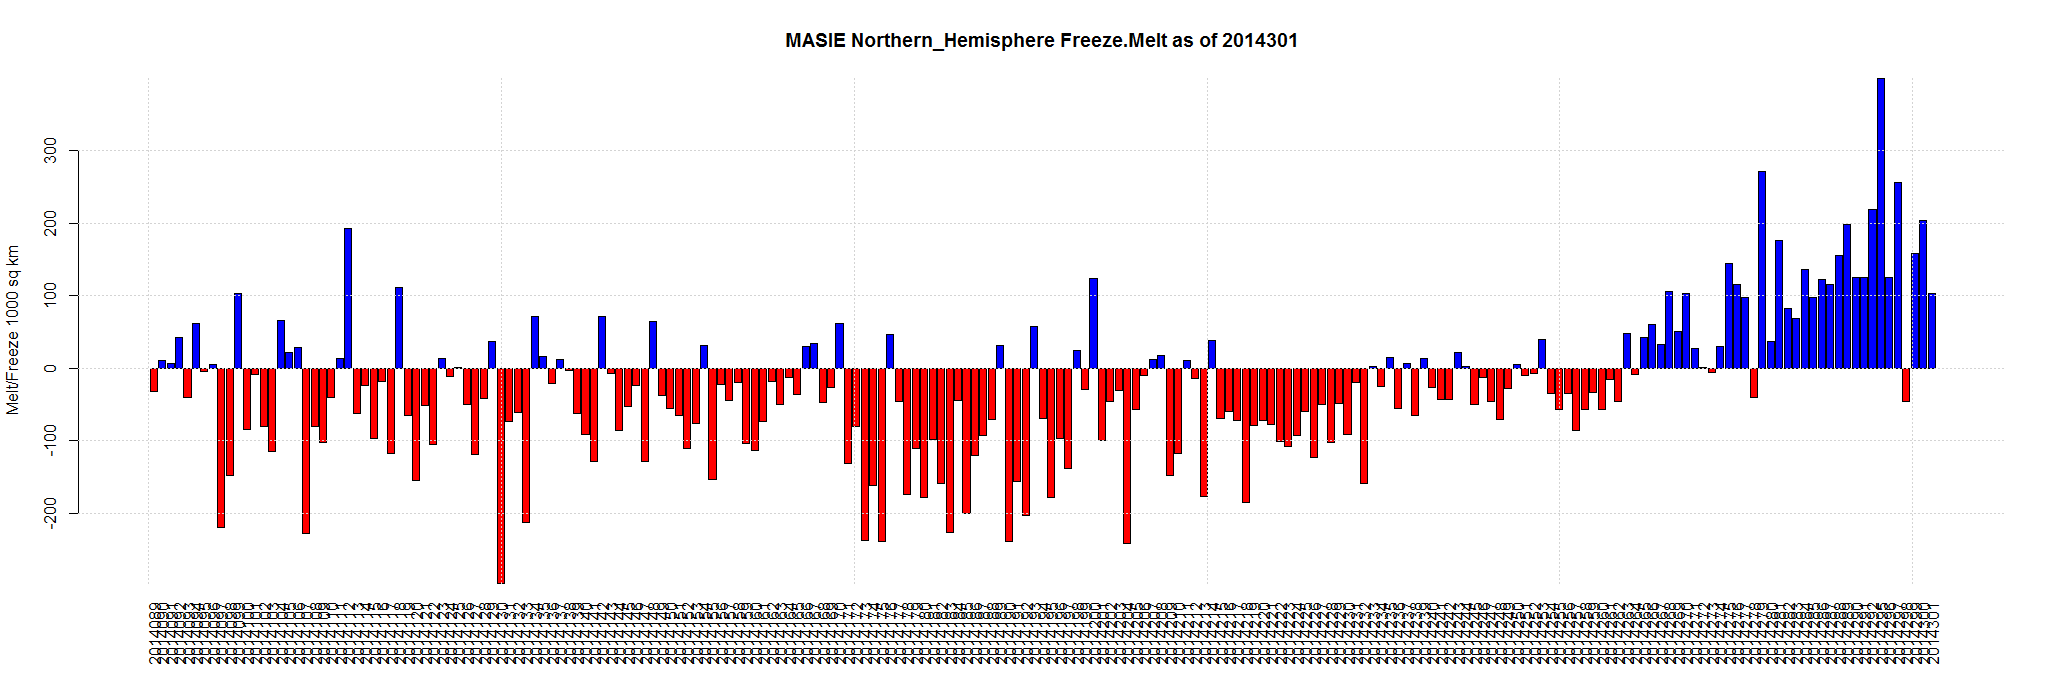
| Northern Hemisphere (Total) | 14,805,115 | 8,997,037 | -5,808,077 | 3,470,778 | 2,260,853 | 1,198,474 | 465,659 | 103,556 |
| NH (Average Loss per Day) | -27,397 | 123,956 | 161,490 | 171,211 | 155,220 | 103,556 |

Can someone confirm that this is true or is it a mistake ONCE again second time this issue pops up
http://weather.unisys.com/surface/sfc_daily.php?plot=ssa&inv=0&t=cur
What’s the issue? Looks like north Pacific and North Atlantic anomalies are cooling.
That’s consistent with the ice extent.
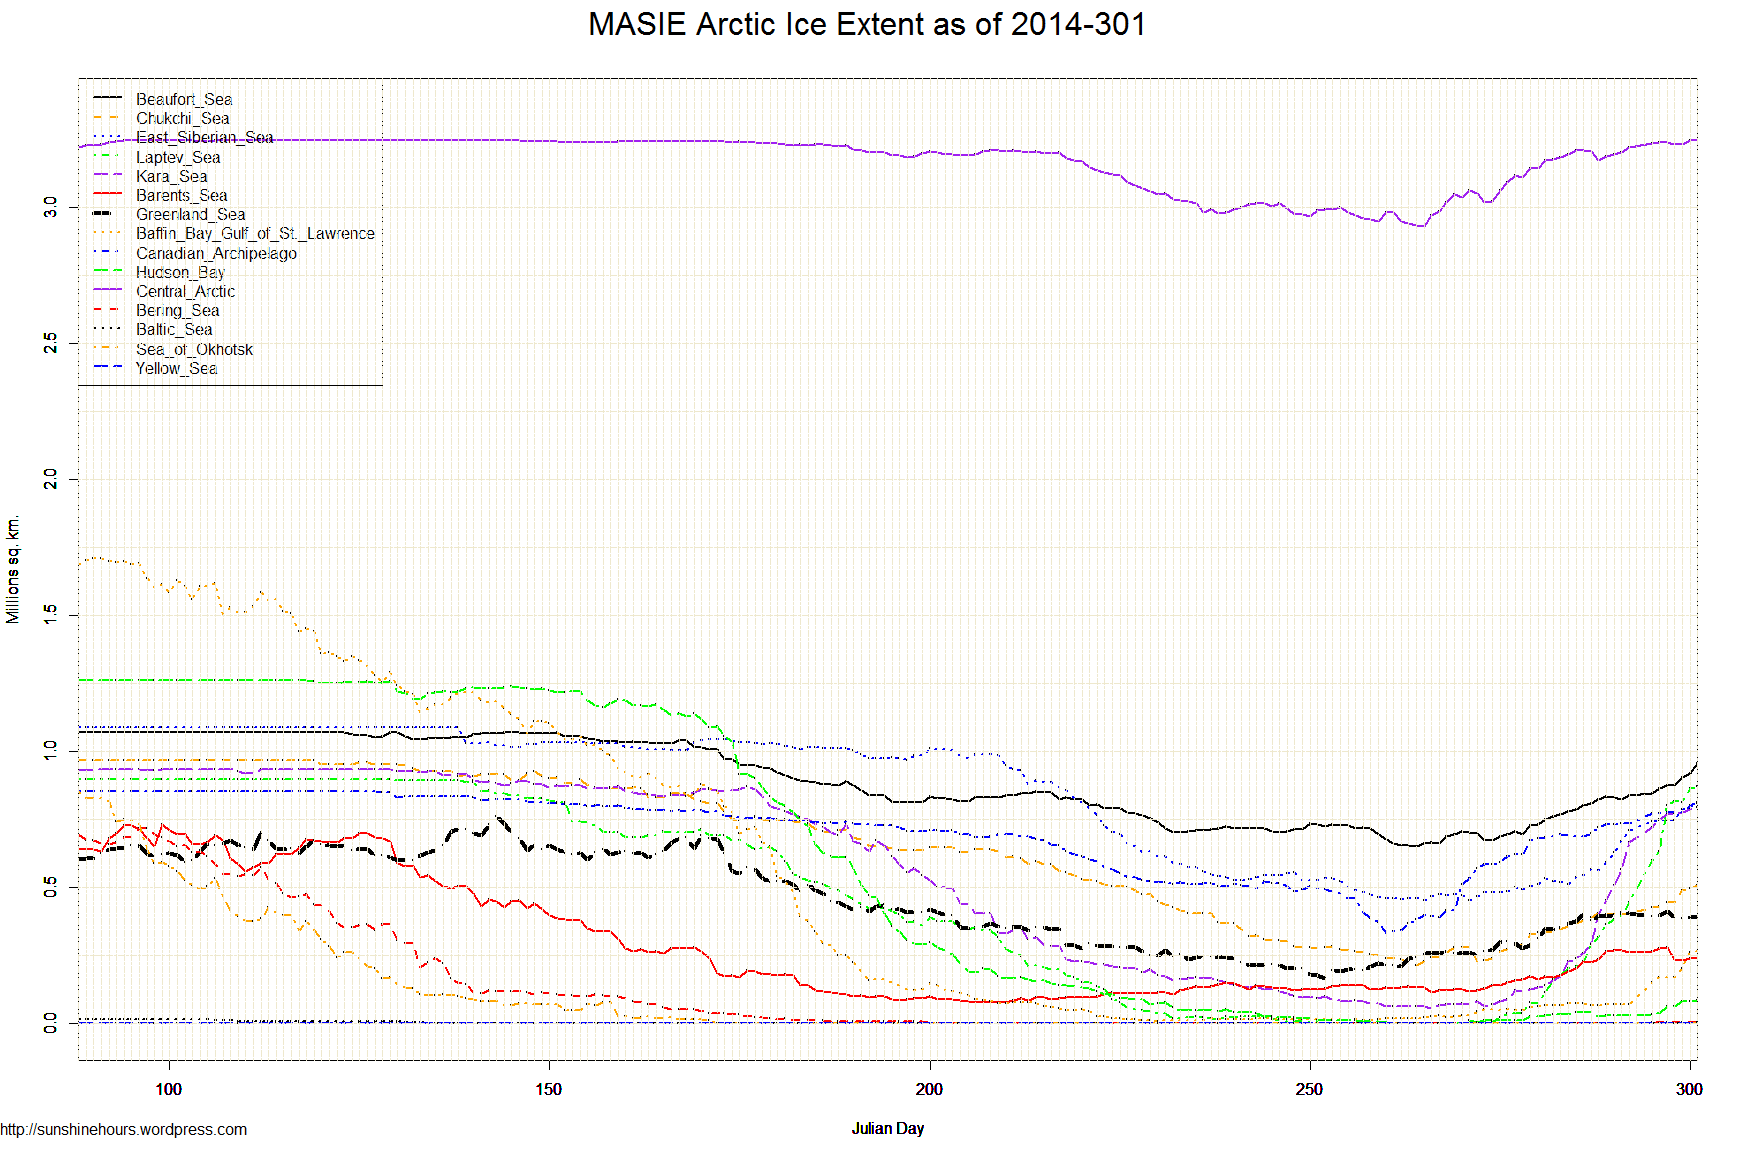
Day 302: Since yesterday, MASIE extent grew by 205,000 Km2 ito 9.20 M Km2 or 59% of last March max.
All regions with ice remaining are recovering strongly, especially Canadian Archipelago, Beaufort, Kara and Laptev Seas
Regions exceeding the NH ice extent average:
Central Arctic has grown back to 100% of the max last March
Laptev has grown to 100%
Canadian Archipelago is now at 98%
Beaufort Sea is up to 92%,
Kara has grown to 88%,
East Siberian Sea is at 82%
Chukchi has grown to 53%,
Greenland Sea is at 52%
Nice MAISE is back up! I notice an interesting discrepency between MAISE and Bremen north of Svalbard. I’m so amazed how often this chunk of water can remain ice free so far north. Especially this year with cooler water from the Atlantic.

Dave in Canmore
Svalbard seems to benefit from atlantic water from the south turned away from the Arctic ice.
Vinje et al have a Fig. 1 showing the currents
http://journals.ametsoc.org/doi/pdf/10.1175/1520-0442(2001)014%3C0255%3AAATOSI%3E2.0.CO%3B2
FIG. 1. Study area with some ice edge observations and outlined ocean
current pattern. Extreme southern and northern Apr ice edge locations
during the twentieth century were observed in 1966 (blue dashed
line) and in 1995 (magenta). The extreme southern Apr extension
during the nineteenth century was observed in 1866 (green line). The
red and blue arrows indicate the respective movement of warm and
cold water masses during the cold season (courtesy S. Østerhus).