The other day I did a post point out that it did get hot in Fort McMurray in April and May.
That post (and this) is using data from Environment Canada for 1908 to 1944.
Remember what Jeff Masters said:
“Fort McMurray saw record daily highs of 91°F on Tuesday and 89°F on Wednesday. The city gets this warm on only about five days in a typical year, and those days are usually in July or August (even then, the average daily high is between 70°F and 75°F)”
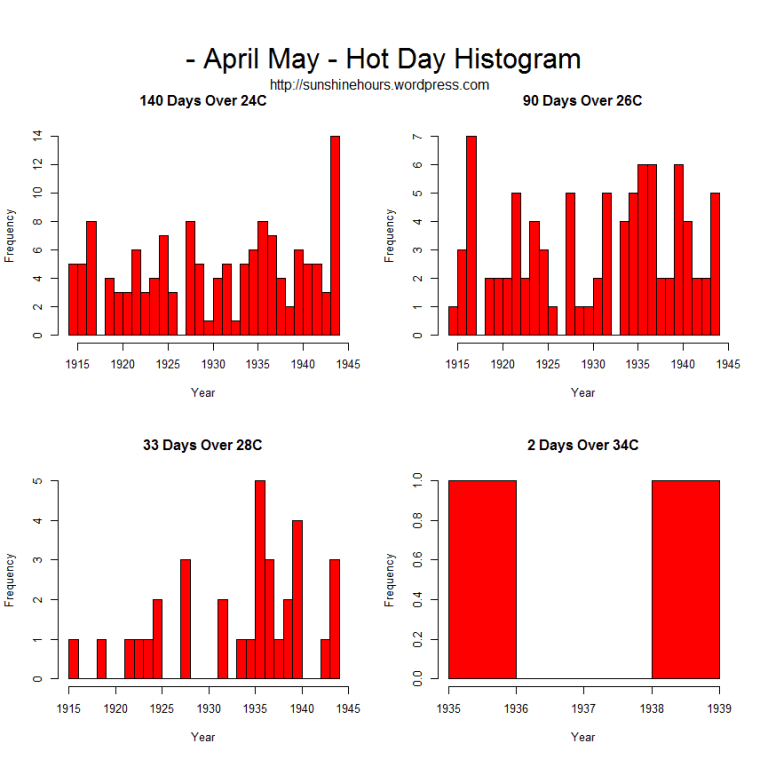
I’ve done two sets of histograms using the 75F (24C) boundary suggested by Jeff Masters. One for April/May and One for July/Aug.
In April/May 1944 there were 14 days 24C and above.
In July/Aug 1944 there were 40 days 24C and above.


Reblogged this on Climate Collections.
Maybe you should email ol’ Mr. Masters the links to this data. See if he has anything to say.