In the UK, 2018 saw the 2nd highest sunshine hours since 1929 at 1580.7
If you graph the annual sunshine in the UK versus Annual Tmax …
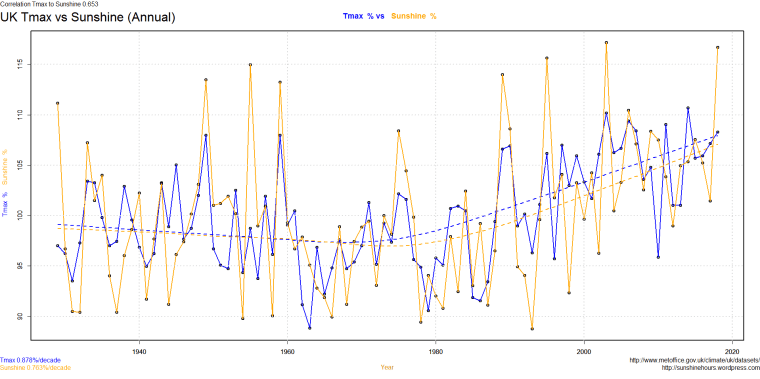
Does CO2 affect sunshine? Or is something else going on?
Data from here.
In the UK, 2018 saw the 2nd highest sunshine hours since 1929 at 1580.7
If you graph the annual sunshine in the UK versus Annual Tmax …
Does CO2 affect sunshine? Or is something else going on?
Data from here.

The chart needs work, the parameters are insufficiently specified, sunshine percentage goes from below 80% to above 115%, but does not specify what defines 100%. The Tmax percentages have no quantities at all.
From that graph it appears that the summer of 1976 was unexceptional, which is clear misrepresentation, as it was far and away the longest and hottest summer I have experienced in my 71-year existence.
The data shows that the summer of 1976 had the highest sunshine hours ever. But the rest of the year not as much.
Same with Tmax. Highest Summer. Rest of year not as much.
My graph is annual. 1976 was 20th in terms of sunshine.
Reblogged this on Climate Collections.