In the UK, 2018 saw the 2nd highest sunshine hours since 1929 at 1580.7
If you graph the annual sunshine in the UK versus Annual Tmax …
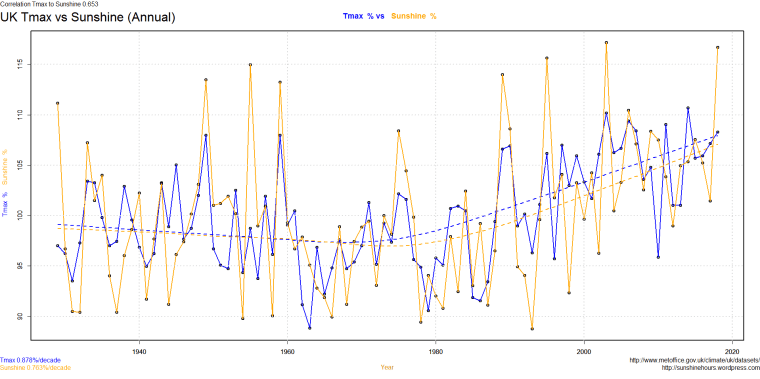
Does CO2 affect sunshine? Or is something else going on?
Data from here.
In the UK, 2018 saw the 2nd highest sunshine hours since 1929 at 1580.7
If you graph the annual sunshine in the UK versus Annual Tmax …
Does CO2 affect sunshine? Or is something else going on?
Data from here.
In general, more sunshine in winter made it colder and more sunshine in summer made it warmer.
2018 is the 2nd highest sunshine hours with 1580.7 hours. Only 6.1 hours below 2003.


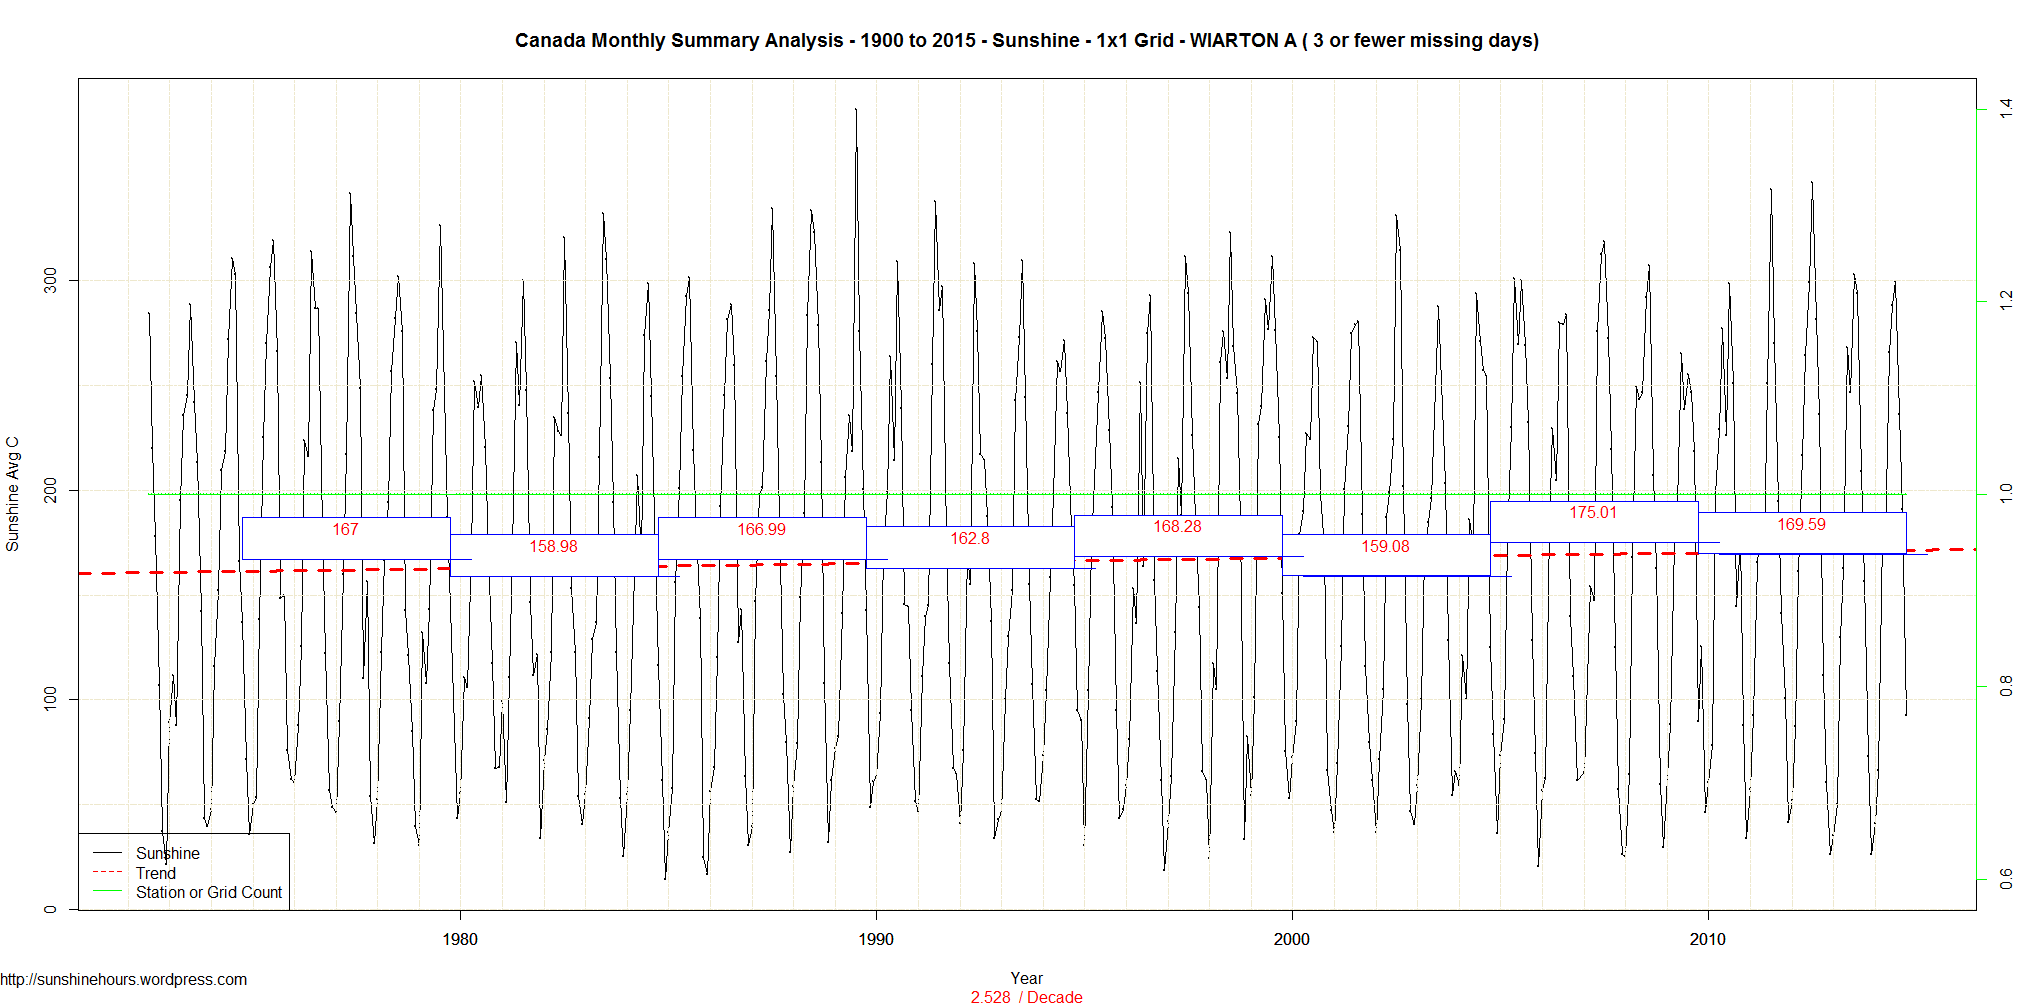
Canada has essentially quit recording bright sunshine hours. What a tragedy.
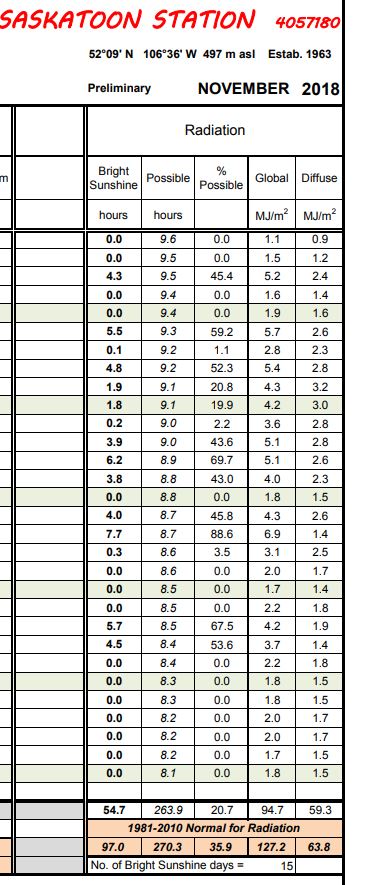
Environment Canada And Climate Change (I can’t believe they changed the name to that!) has dropped the ball. One exception is the Saskatchewan Research Council. They collect sunshine data at two locations.
This is the November data for Saskatoon.
November 2018 had 54.7 hours of Bright Sunshine.
20.7% of the 1981-2010 normal of 97 hours of bright sunshine.

3 graphs for UK Sunshine Data. 1929 on, 1998 to 2018 and 2008 to 2018.
The trend values (red for increasing) are in hours per decade.
For the last 10 years the numbers are all over the place.
July 43 hours/decade and August 34 hours/dec. And March -23 hours/dec.


Canada has essentially quit recording bright sunshine hours. What a tragedy.
Environment Canada And Climate Change (I can’t believe they changed the name to that!) has dropped the ball.
One exception is the Saskatchewan Research Council. They collect sunshine data at two locations.
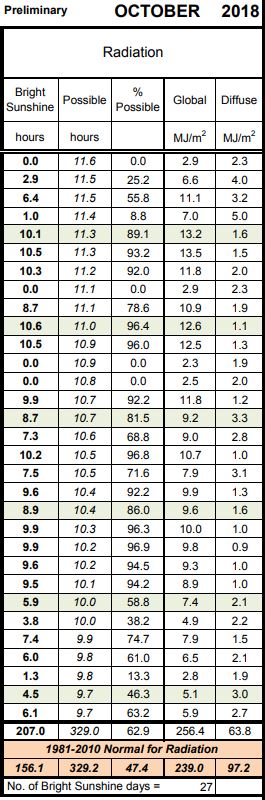
This is the October data for Saskatoon.
The normal is 156.1 hours of bright sunshine.
October 2018 had 207.0 hours.
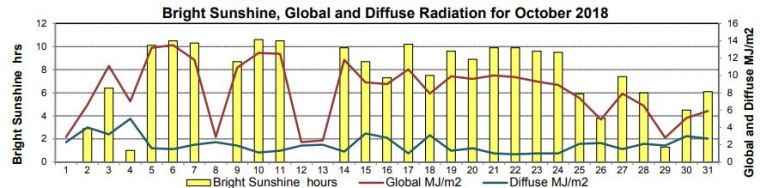
Sunshine in Germany was way higher than usual October 2018.
(Although I wish they had graphs like the UK available.) (And I wish they used the 1981-2010 mean)

Fifth sunniest October in UK
122% of average.
At NoTricksZone the insanity of Germany’s “plan” for saving the worlds from cheap electrcity is on display.
80GW of demand (the reddish line)
40 GW of installed solar producing almost nothing (the yellow)/
10 hours of sunshine in Germany for the whole month of December.
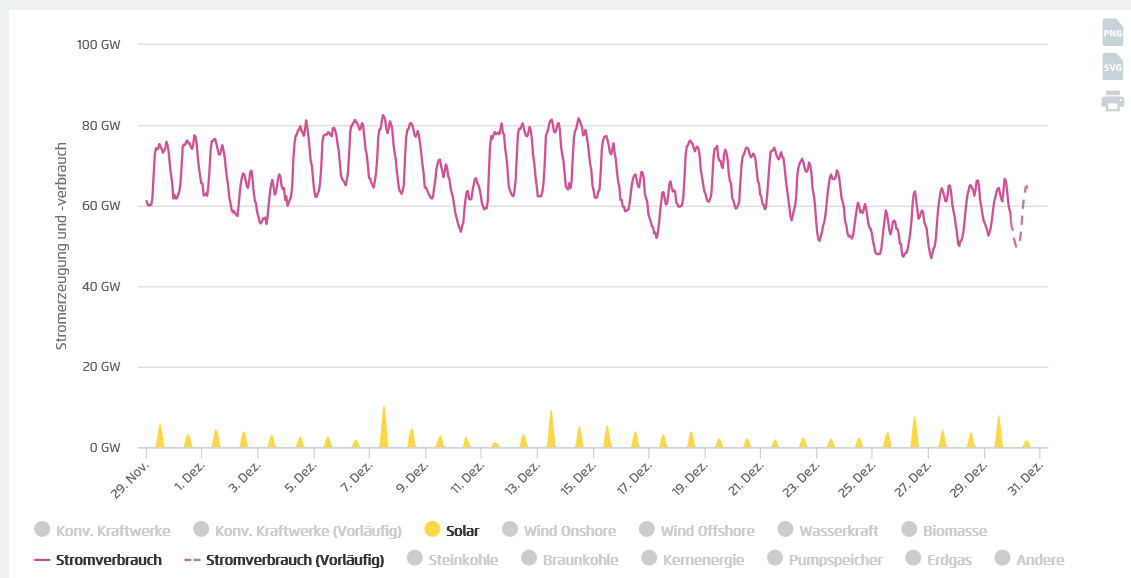
As Jo Nova says:
“Imagine what kind of havoc this kind of energy flux can do. Not one piece of baseload capital equipment can be retired, despite the fact that half of it is randomly unprofitable depending on cloud cover. Solar PV eats away the low cost competitive advantage. Capital sits there unused, spinning on standby, while wages, interest, and other costs keep accruing. So hapless baseload suppliers charge more for the hours that they do run, making electricity more expensive.
They just need batteries with three months supply.”
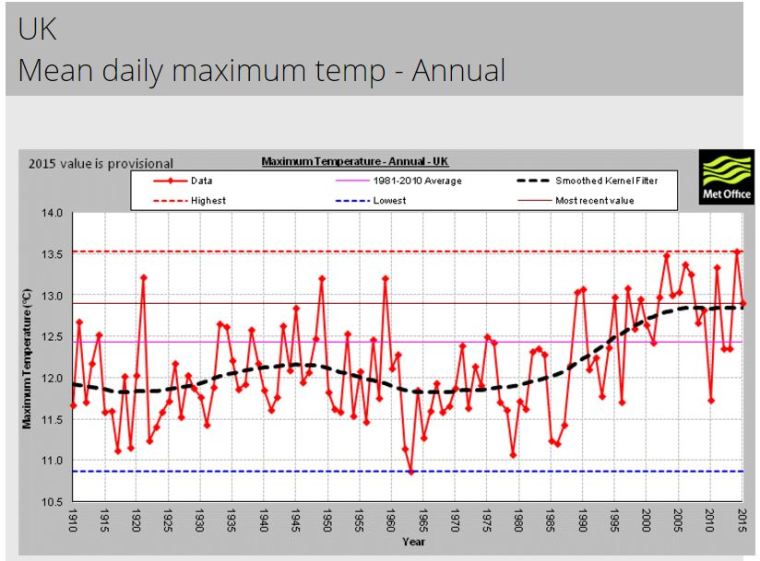
According to the UK Met Office 2015 was the 9th highest (since 1929) for sunshine.
Approximate 100 hours higher than the 1981-2010 average.
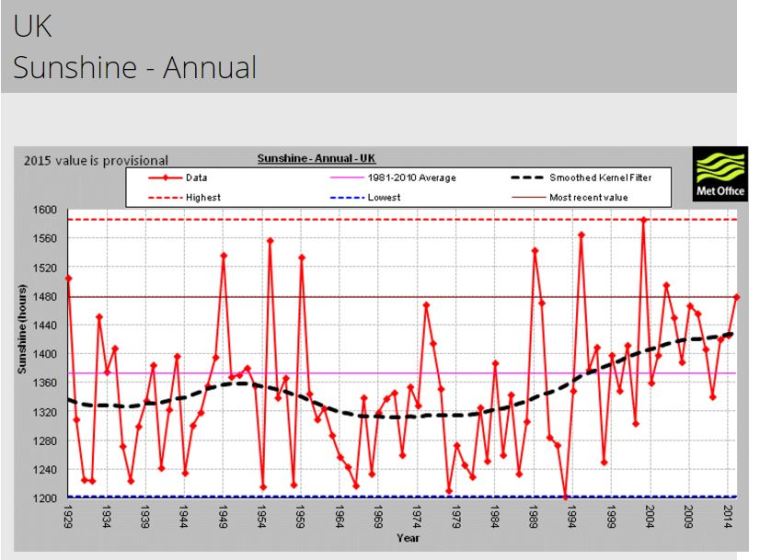
UK Max temperature graph looks similar to the sunshine graph.
Once up a time (June of 1978 to be precise) if you downloaded Environment Canada’s monthly summaries, you would have found 313 stations with “Bright Sunshine” hours.
Even two years ago, these stations were reporting sunshine data:
TORONTO LESTER B. PEARSON INT’L A
CARTWRIGHT
GOOSE A
VICTORIA INT’L A
COMOX A
VANCOUVER INT’L A
WIARTON A
As of today, only WIARTON A reports sunshine data and for May 2015 25 out of 31 days had no valid measurements.