Arctic Sea Ice Extent Sep 08 2014 – -976,000 sq km below the 1981-2010 mean. Data for Day 250. Data here.
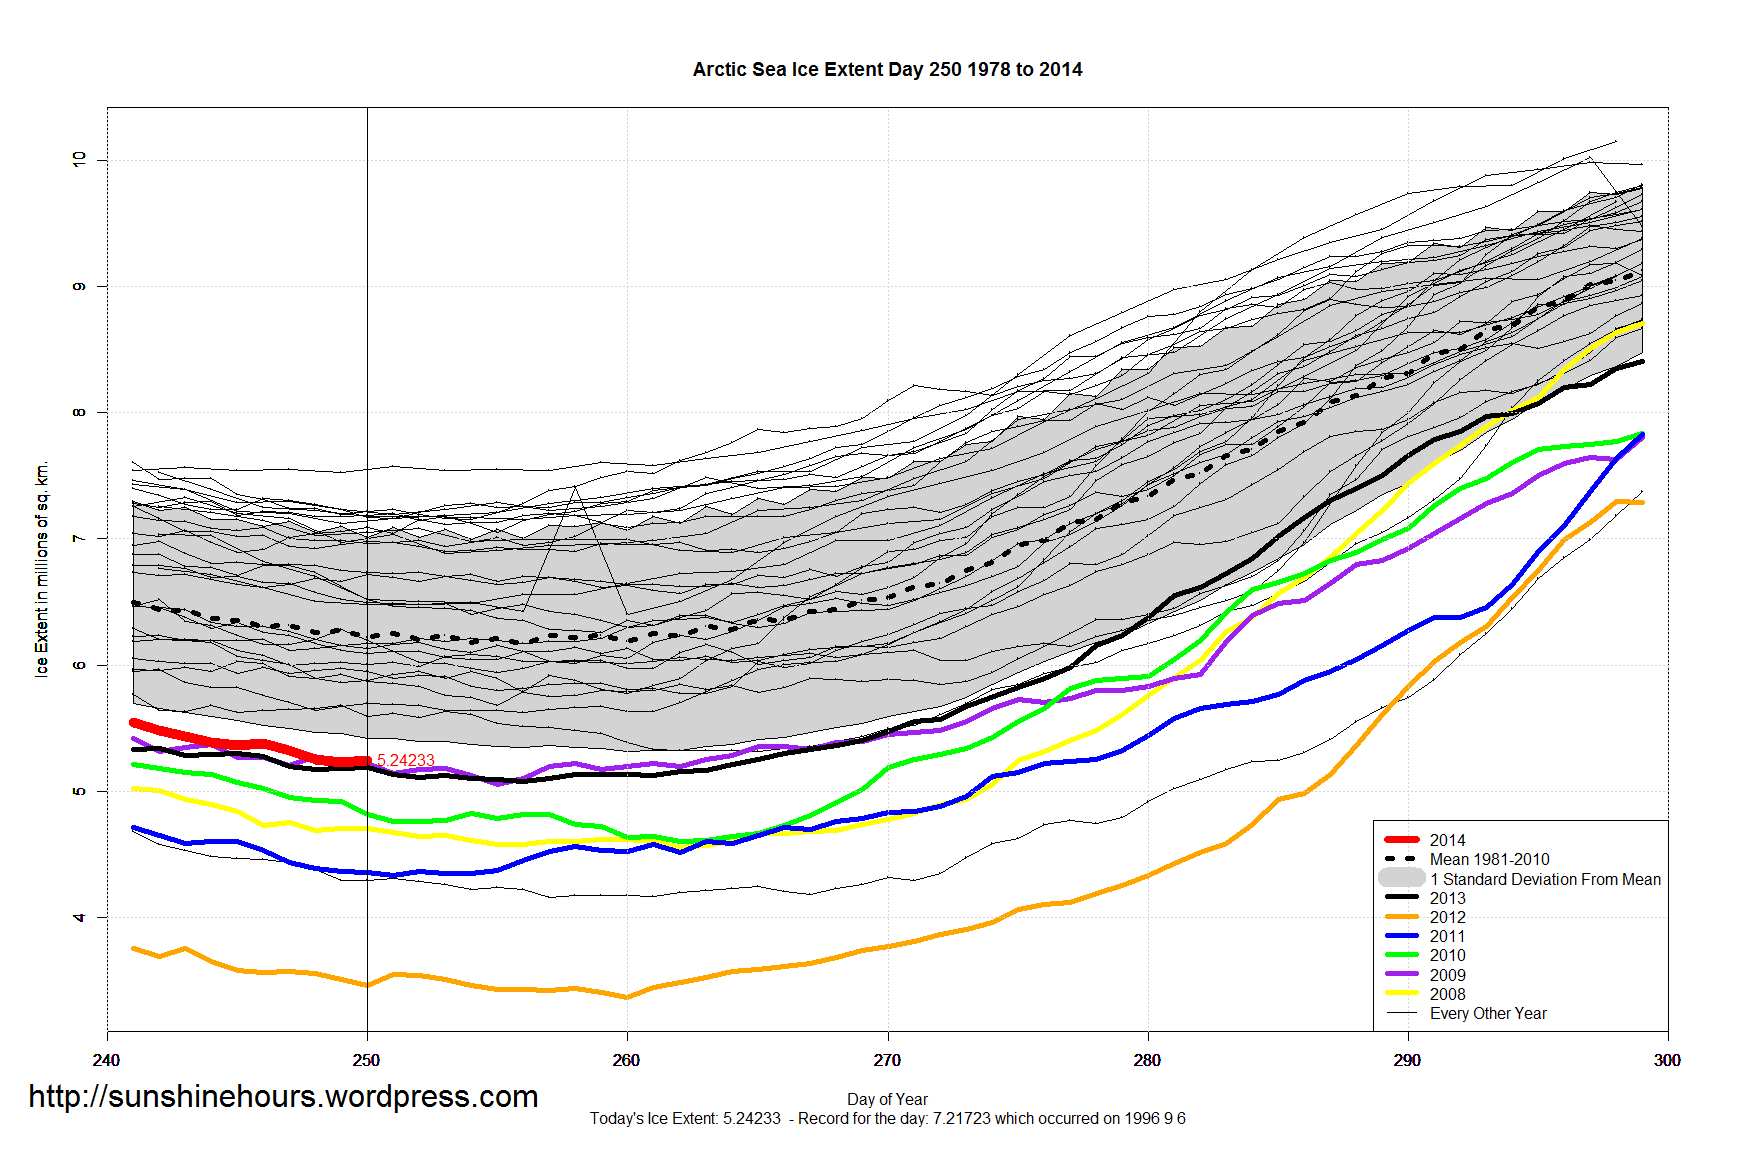

Arctic Sea Ice Extent Sep 08 2014 – -976,000 sq km below the 1981-2010 mean. Data for Day 250. Data here.
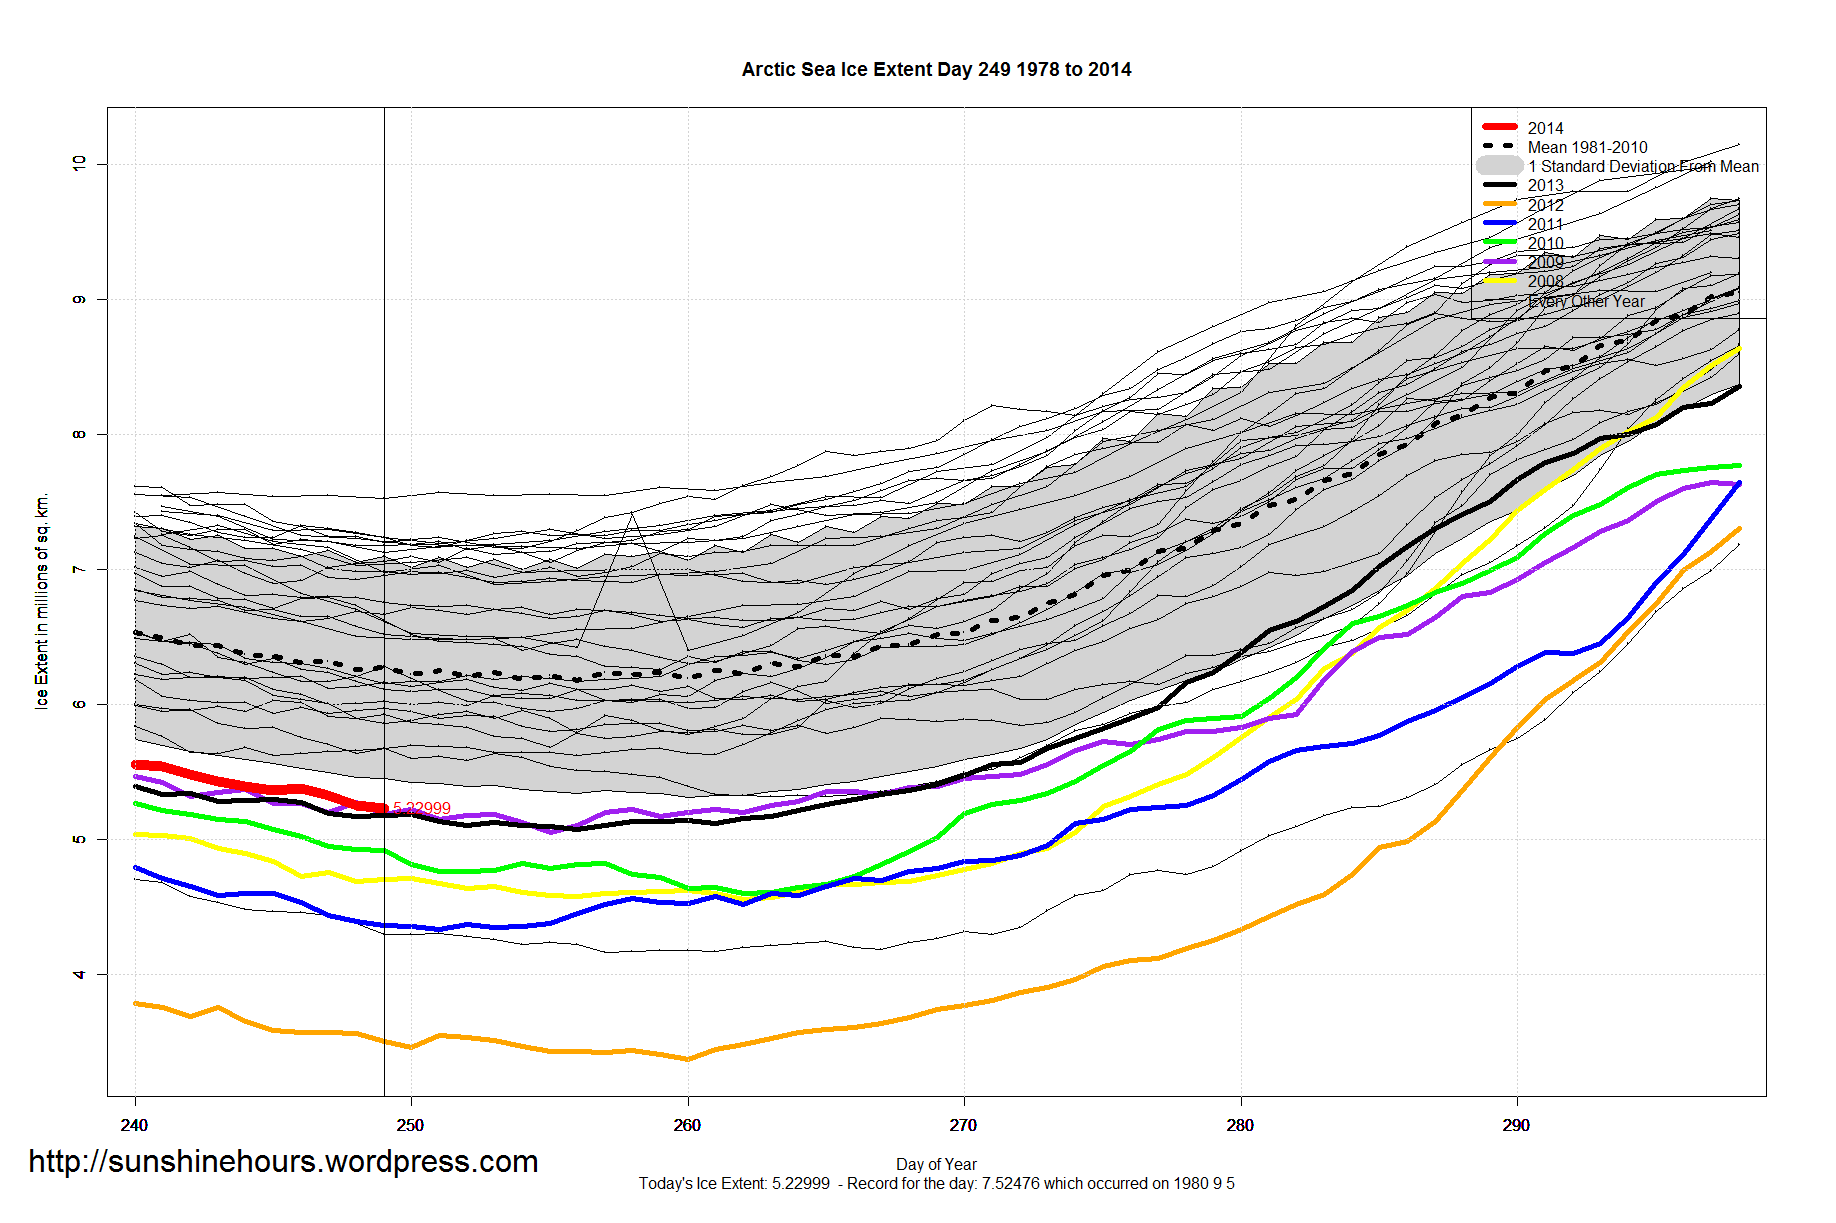
Arctic Sea Ice Extent Sep 07 2014 – -1,045,000 sq km below the 1981-2010 mean. Data for Day 249. Data here.

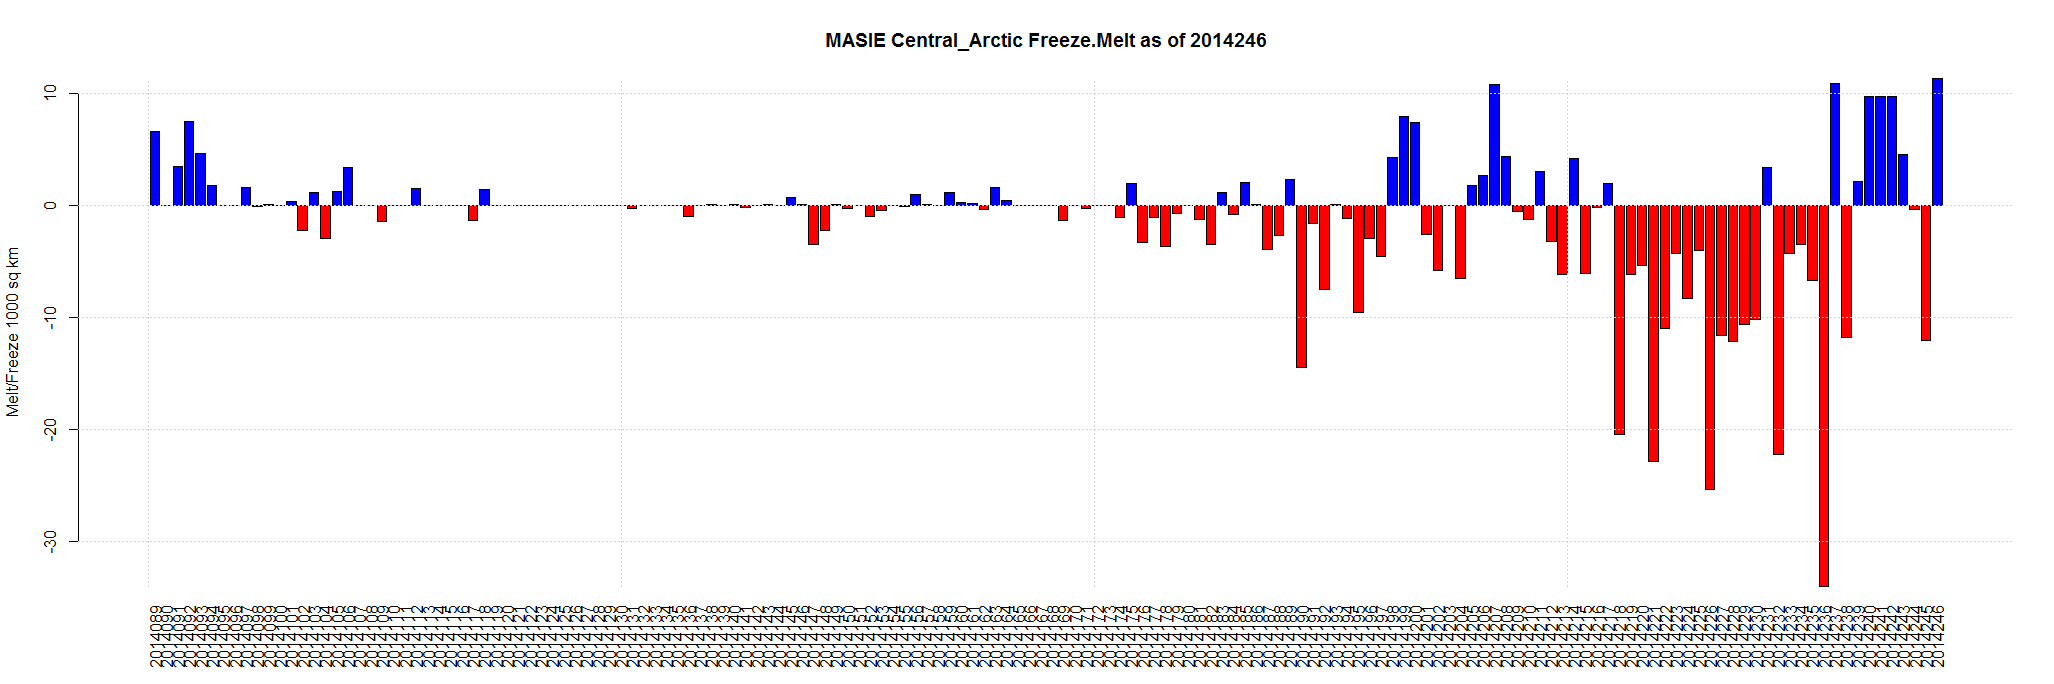
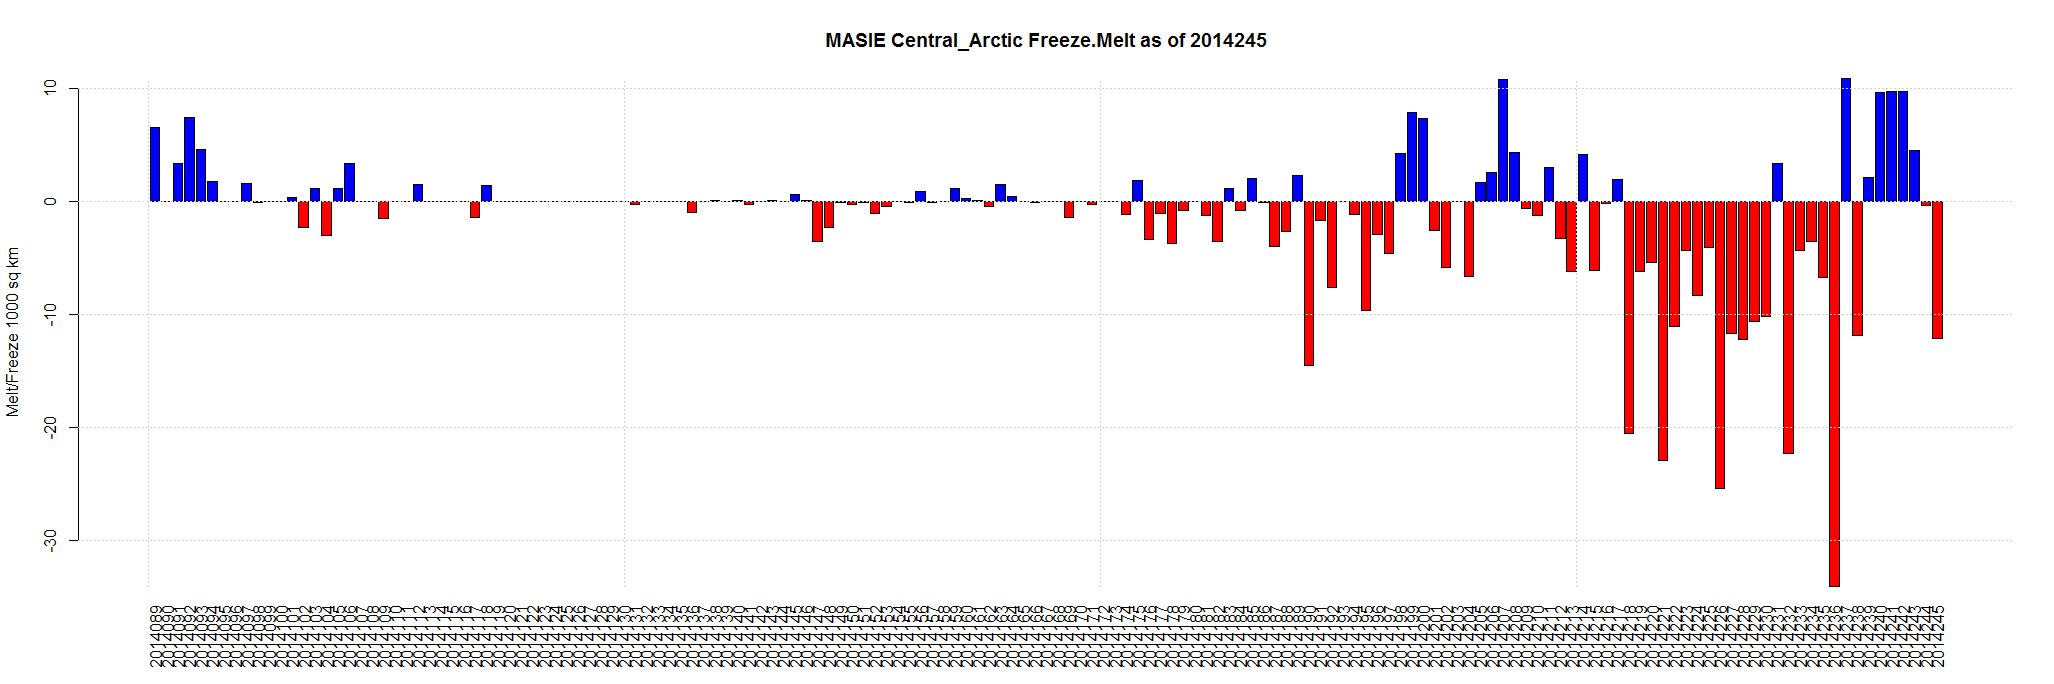
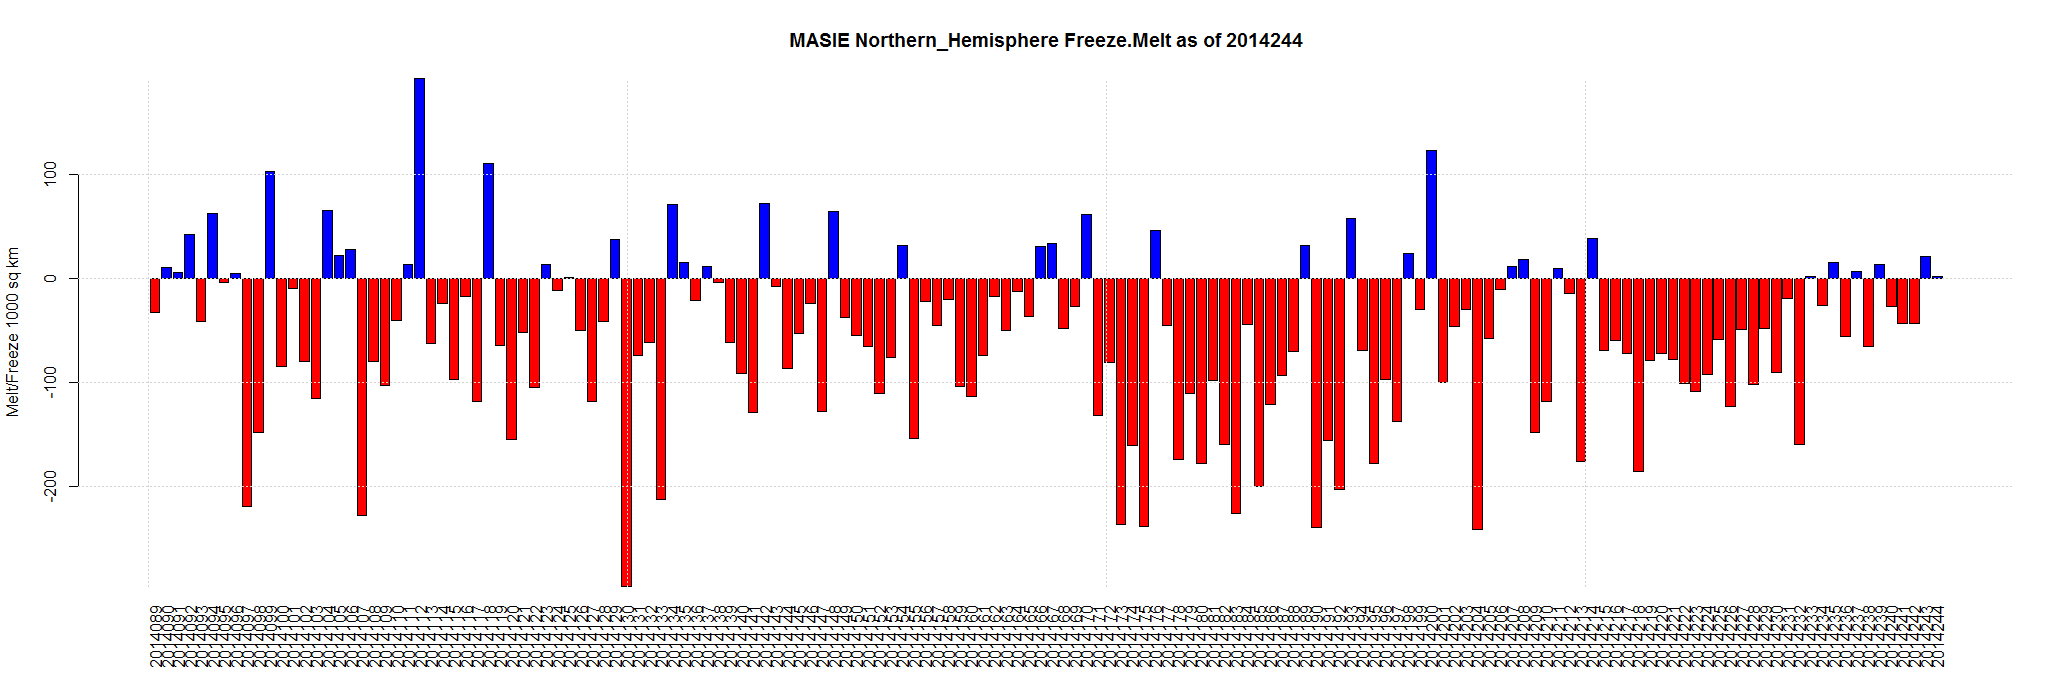
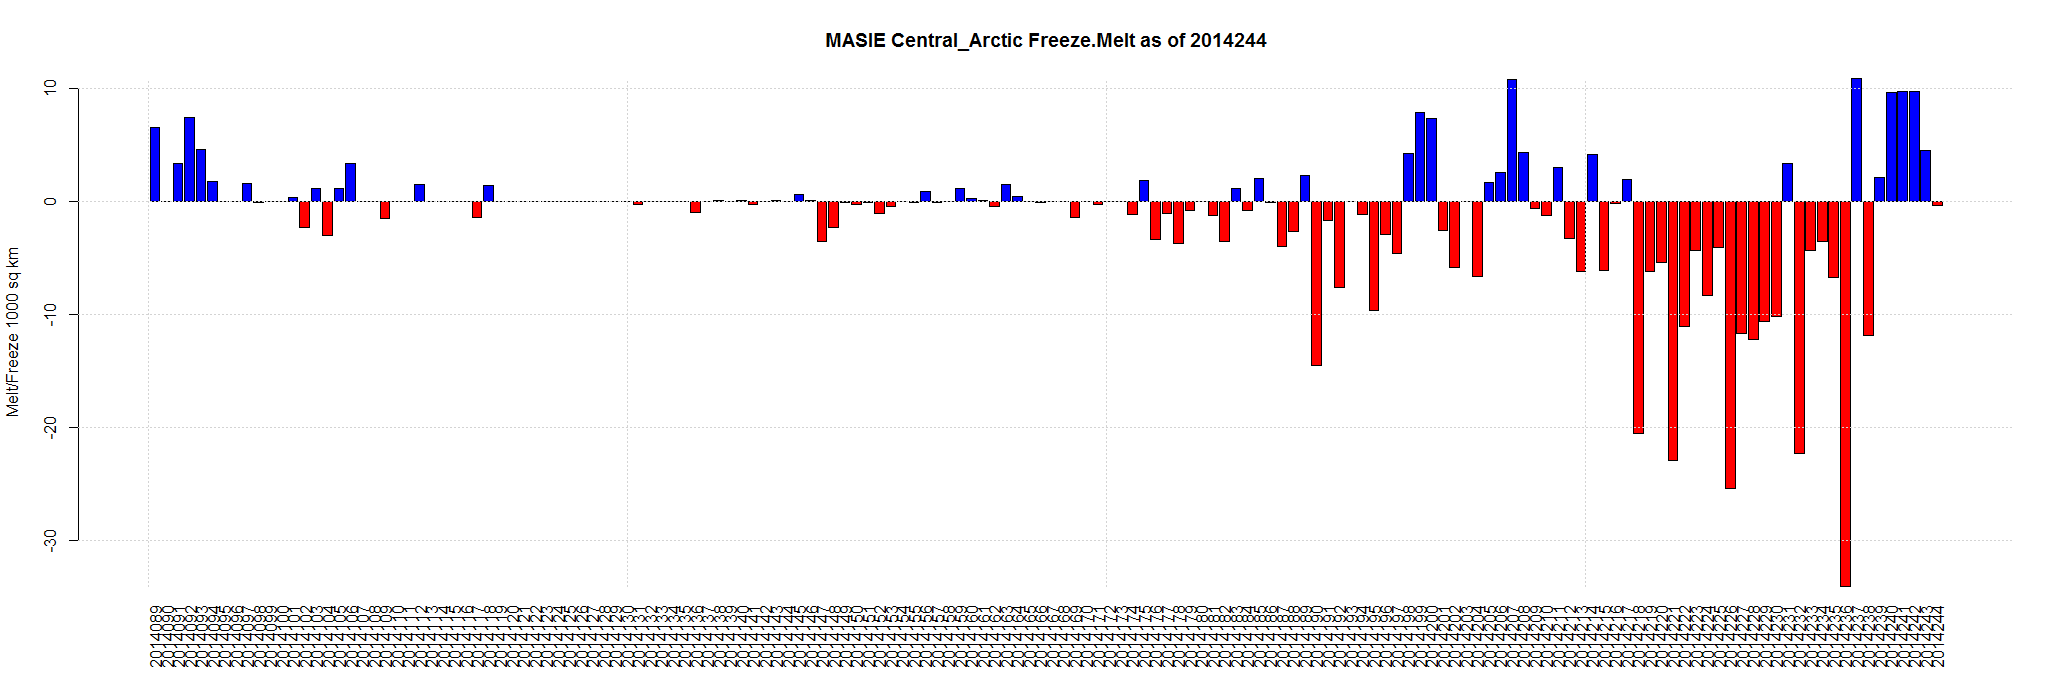
Sept 6 2014 MASIE Update – Central Arctic Takes a Tumble
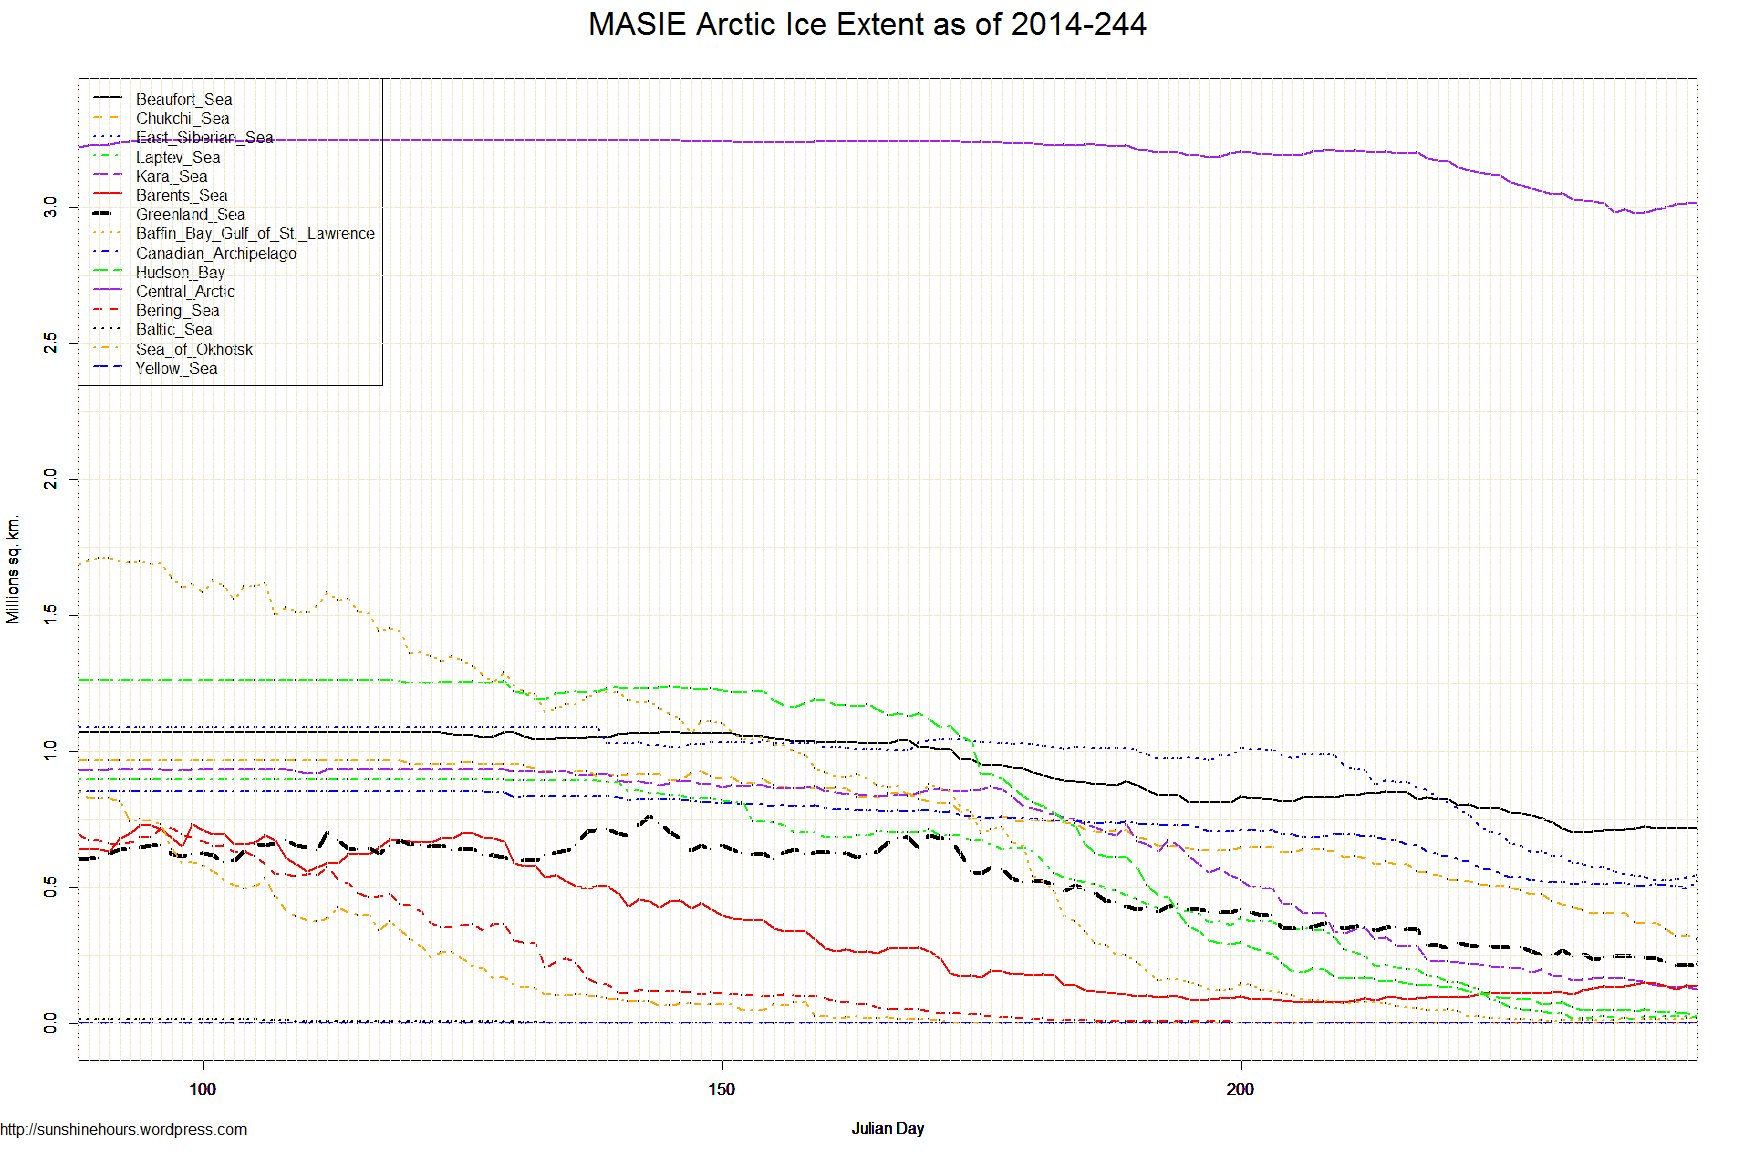
Data here. Click for bigger.
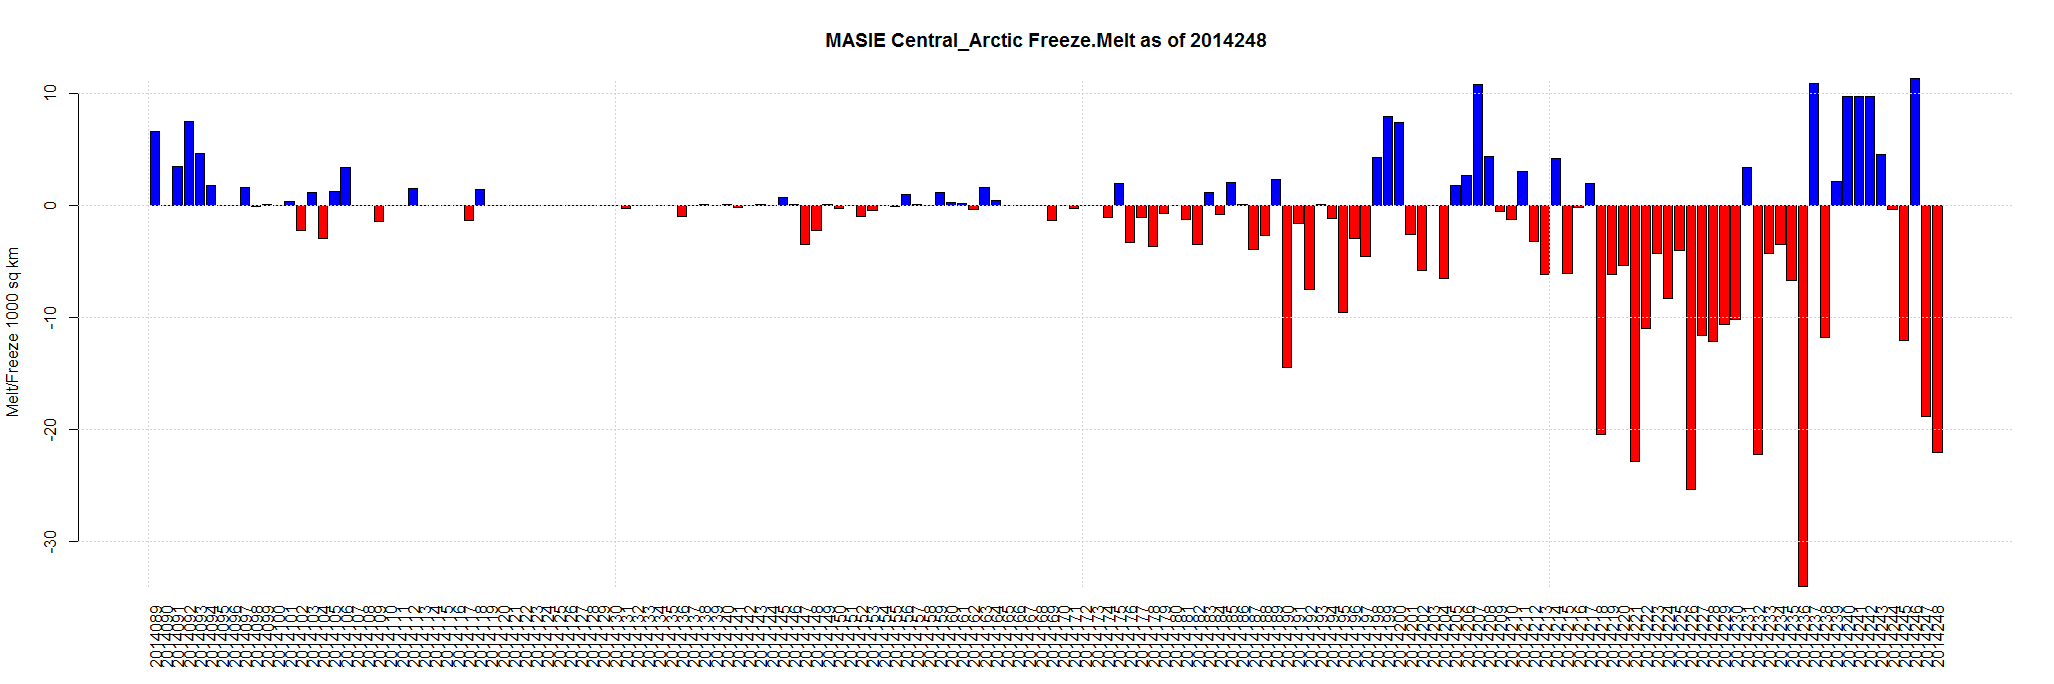
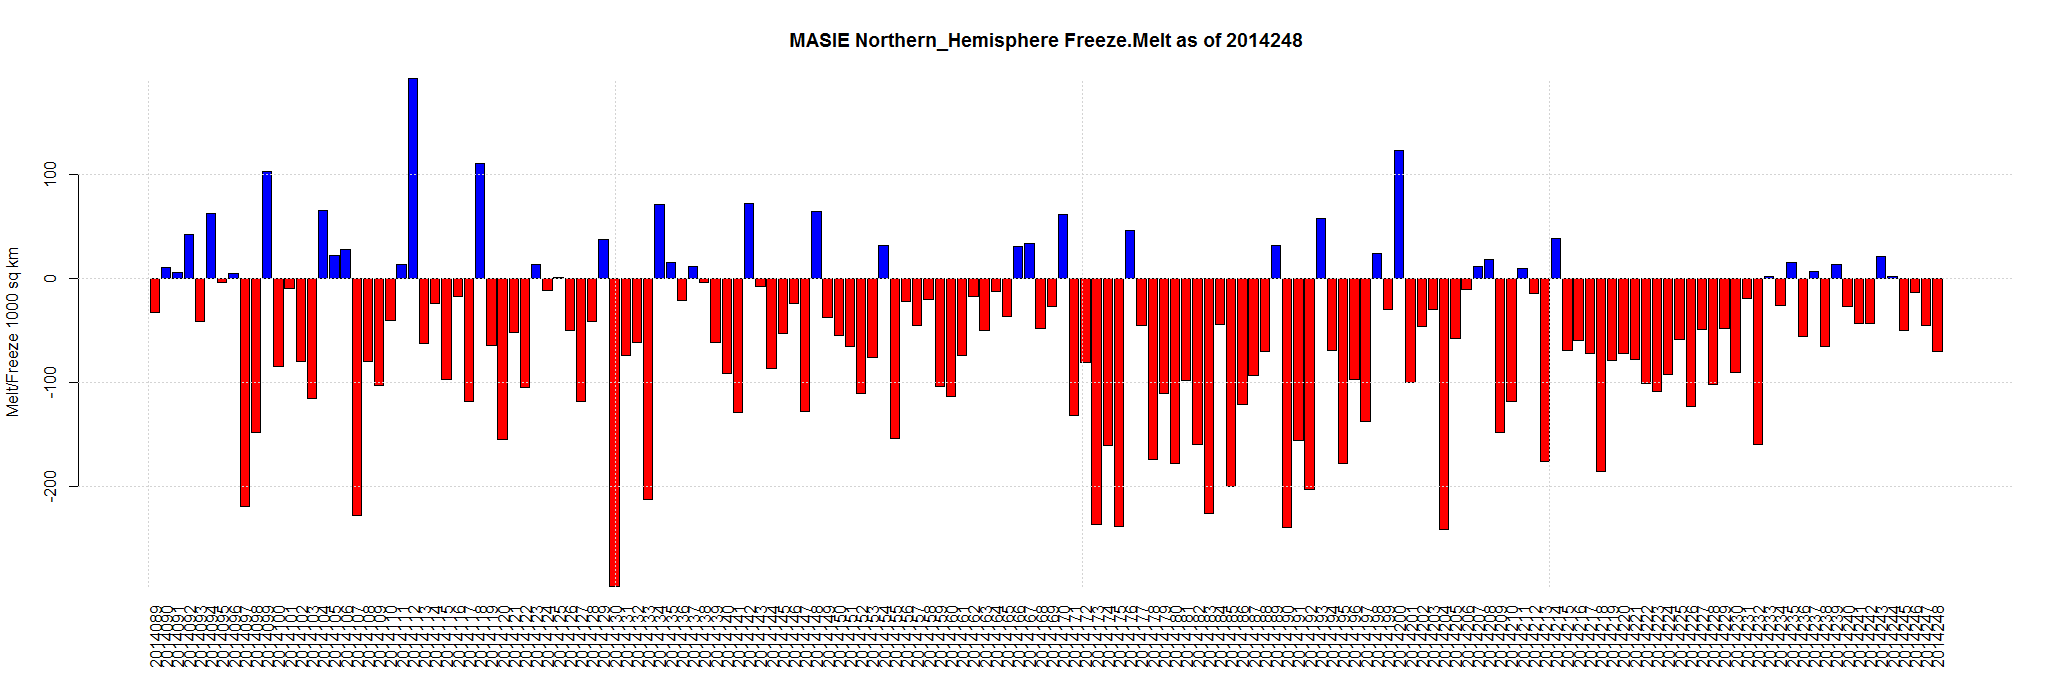
| Region | 161 days ago | End | Last 160 | Last 28 | Last 14 | Last 7 | Last 3 | Last 1 |
| Central Arctic | 3,221,921 | 2,973,233 | -248,689 | -195,406 | -48,016 | -27,861 | -29,620 | -22,069 |
| Chukchi Sea | 966,006 | 284,201 | -681,805 | -245,480 | -121,921 | -61,631 | -21,300 | -19,360 |
| Canadian Archipelago | 853,214 | 487,137 | -366,077 | -128,130 | -24,762 | -21,989 | -27,816 | -17,109 |
| Kara Sea | 933,859 | 101,124 | -832,735 | -127,704 | -66,221 | -35,730 | -27,780 | -10,296 |
| Barents Sea | 645,917 | 121,208 | -524,709 | 24,595 | -9,978 | -14,612 | -13,413 | -8,716 |
| Laptev Sea | 897,845 | 6,411 | -891,434 | -144,705 | -16,516 | -18,746 | -11,058 | -3,117 |
| Greenland Sea | 603,416 | 201,459 | -401,957 | -75,881 | -33,410 | -24,703 | -15,061 | -2,654 |
| Bering Sea | 697,324 | 0 | -697,324 | 0 | 0 | 0 | 0 | 0 |
| Baltic Sea | 15,337 | 0 | -15,337 | 0 | 0 | 0 | 0 | 0 |
| Sea of Okhotsk | 853,240 | 0 | -853,240 | 0 | 0 | 0 | 0 | 0 |
| Yellow Sea | 0 | 0 | 0 | 0 | 0 | 0 | 0 | 0 |
| Baffin Bay Gulf of St. Lawrence | 1,688,530 | 15,151 | -1,673,379 | -37,735 | 4,909 | 698 | 404 | 180 |
| Hudson Bay | 1,260,903 | 23,551 | -1,237,352 | -109,899 | -26,332 | -18,712 | -4,074 | 1,518 |
| East Siberian Sea | 1,087,137 | 555,583 | -531,554 | -258,848 | -18,480 | 28,081 | 12,026 | 2,675 |
| Beaufort Sea | 1,070,445 | 715,487 | -354,958 | -108,677 | 7,066 | -2,833 | 8,573 | 8,490 |
| Northern Hemisphere (Total) | 14,805,115 | 5,485,686 | -9,319,428 | -1,407,870 | -353,662 | -198,039 | -129,118 | -70,459 |
| NH (Average Loss per Day) | -57,885 | -50,281 | -25,262 | -28,291 | -43,039 | -70,459 |
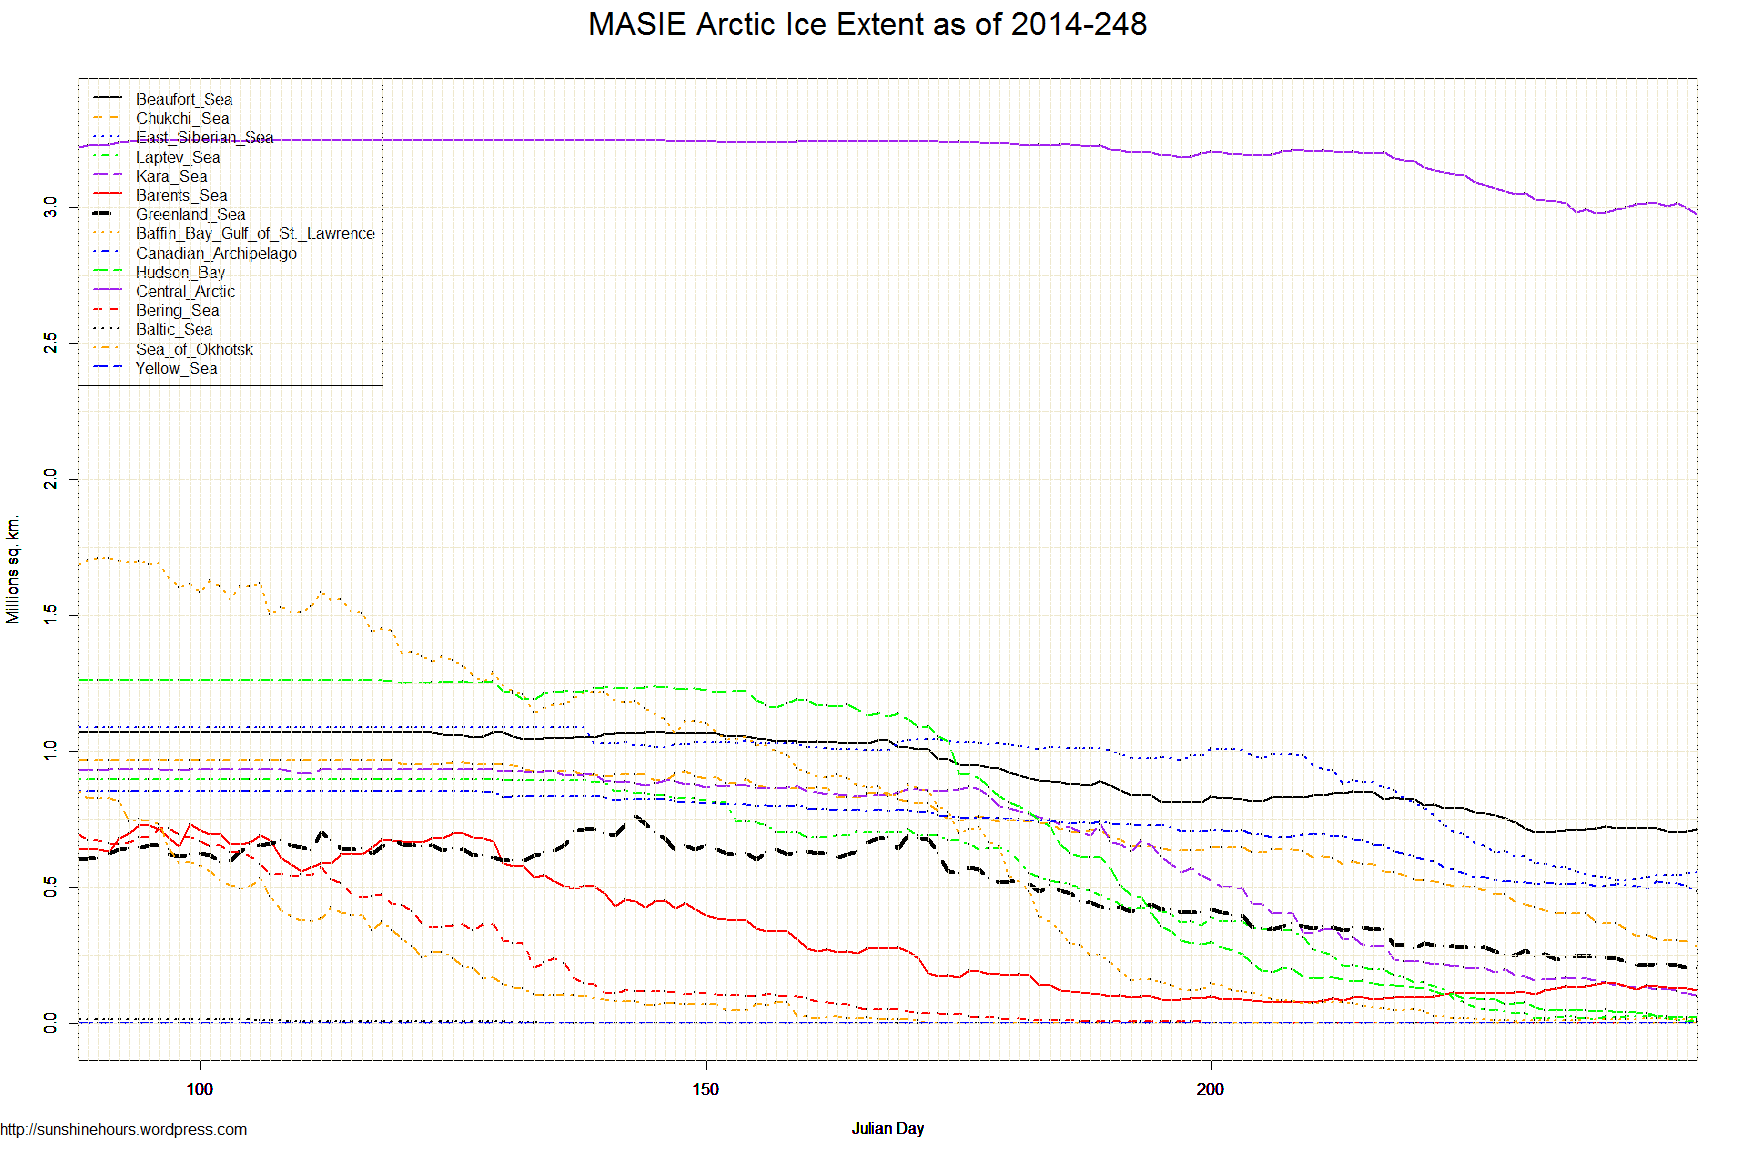
Arctic Sea Ice Extent Sep 06 2014 – -1,007,000 sq km below the 1981-2010 mean. Data for Day 248. Data here.

Arctic Sea Ice Extent Sep 05 2014 – -991,000 sq km below the 1981-2010 mean. Data for Day 247. Data here.


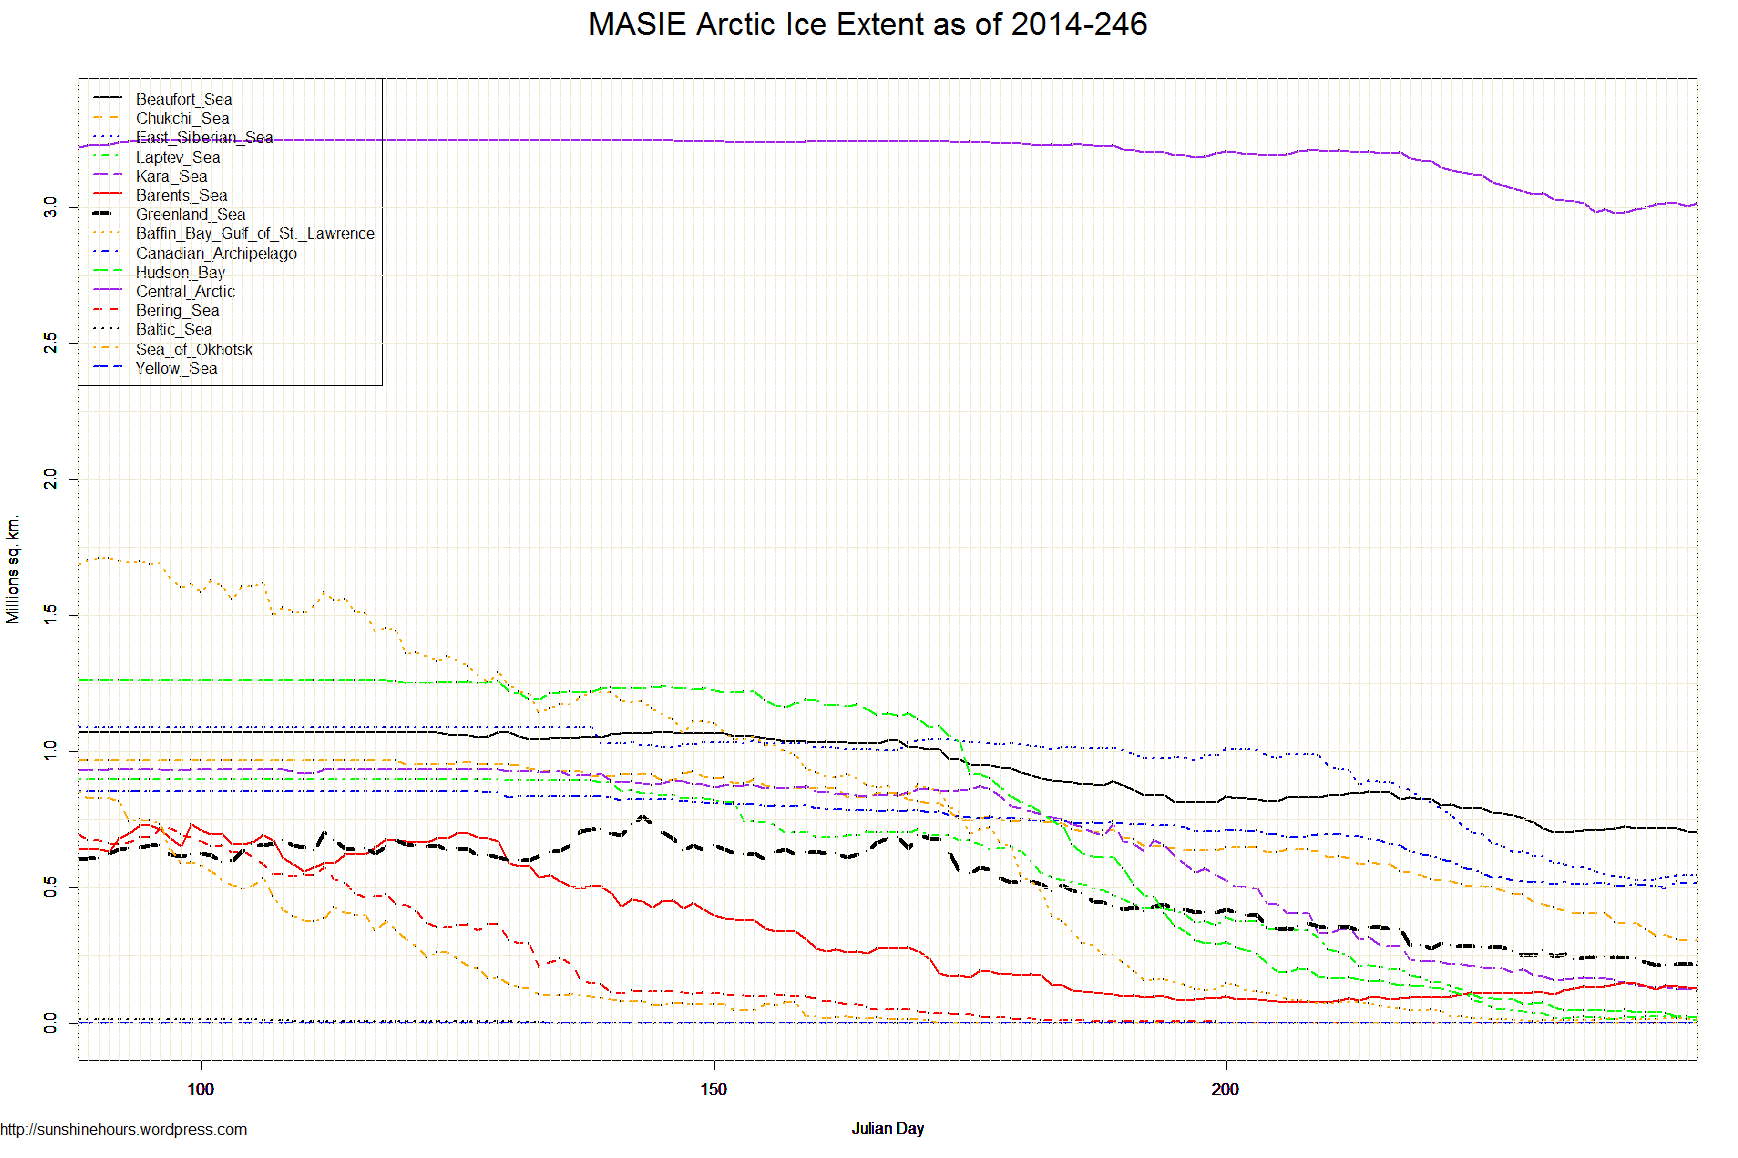
Sept 4 2014 MASIE Update – Tiny Melt – Central Arctic Up –
Data here. Click for bigger.

| Region | 159 days ago | End | Last 158 | Last 28 | Last 14 | Last 7 | Last 3 | Last 1 |
| Kara Sea | 933,859 | 119,969 | -813,890 | -114,911 | -37,590 | -30,727 | -11,437 | -8,935 |
| Laptev Sea | 897,845 | 12,289 | -885,556 | -165,768 | -6,774 | -12,837 | -14,783 | -5,179 |
| Hudson Bay | 1,260,903 | 22,601 | -1,238,303 | -117,548 | -36,542 | -28,844 | -16,160 | -5,024 |
| Barents Sea | 645,917 | 130,386 | -515,531 | 32,669 | 21,125 | -21,179 | -8,970 | -4,235 |
| Beaufort Sea | 1,070,445 | 704,681 | -365,764 | -126,294 | 954 | -18,528 | -13,253 | -2,233 |
| Greenland Sea | 603,416 | 215,742 | -387,674 | -70,759 | -33,057 | -27,558 | 1,389 | -778 |
| Chukchi Sea | 966,006 | 304,755 | -661,251 | -251,048 | -120,906 | -65,064 | -20,155 | -747 |
| Bering Sea | 697,324 | 0 | -697,324 | 0 | 0 | 0 | 0 | 0 |
| Baltic Sea | 15,337 | 0 | -15,337 | 0 | 0 | 0 | 0 | 0 |
| Sea of Okhotsk | 853,240 | 0 | -853,240 | 0 | 0 | 0 | 0 | 0 |
| Yellow Sea | 0 | 0 | 0 | 0 | 0 | 0 | 0 | 0 |
| Baffin Bay Gulf of St. Lawrence | 1,688,530 | 14,971 | -1,673,560 | -34,928 | 4,814 | 527 | -2,508 | 224 |
| Canadian Archipelago | 853,214 | 515,437 | -337,777 | -117,207 | 4,407 | 9,885 | 20,019 | 484 |
| East Siberian Sea | 1,087,137 | 545,338 | -541,800 | -312,116 | -43,178 | 9,623 | 5,997 | 1,781 |
| Central Arctic | 3,221,921 | 3,014,133 | -207,788 | -166,082 | -15,008 | 32,399 | -1,144 | 11,281 |
| Northern Hemisphere (Total) | 14,805,115 | 5,601,443 | -9,203,672 | -1,443,991 | -261,754 | -152,302 | -61,005 | -13,361 |
| NH (Average Loss per Day) | -57,885 | -51,571 | -18,697 | -21,757 | -20,335 | -13,361 |
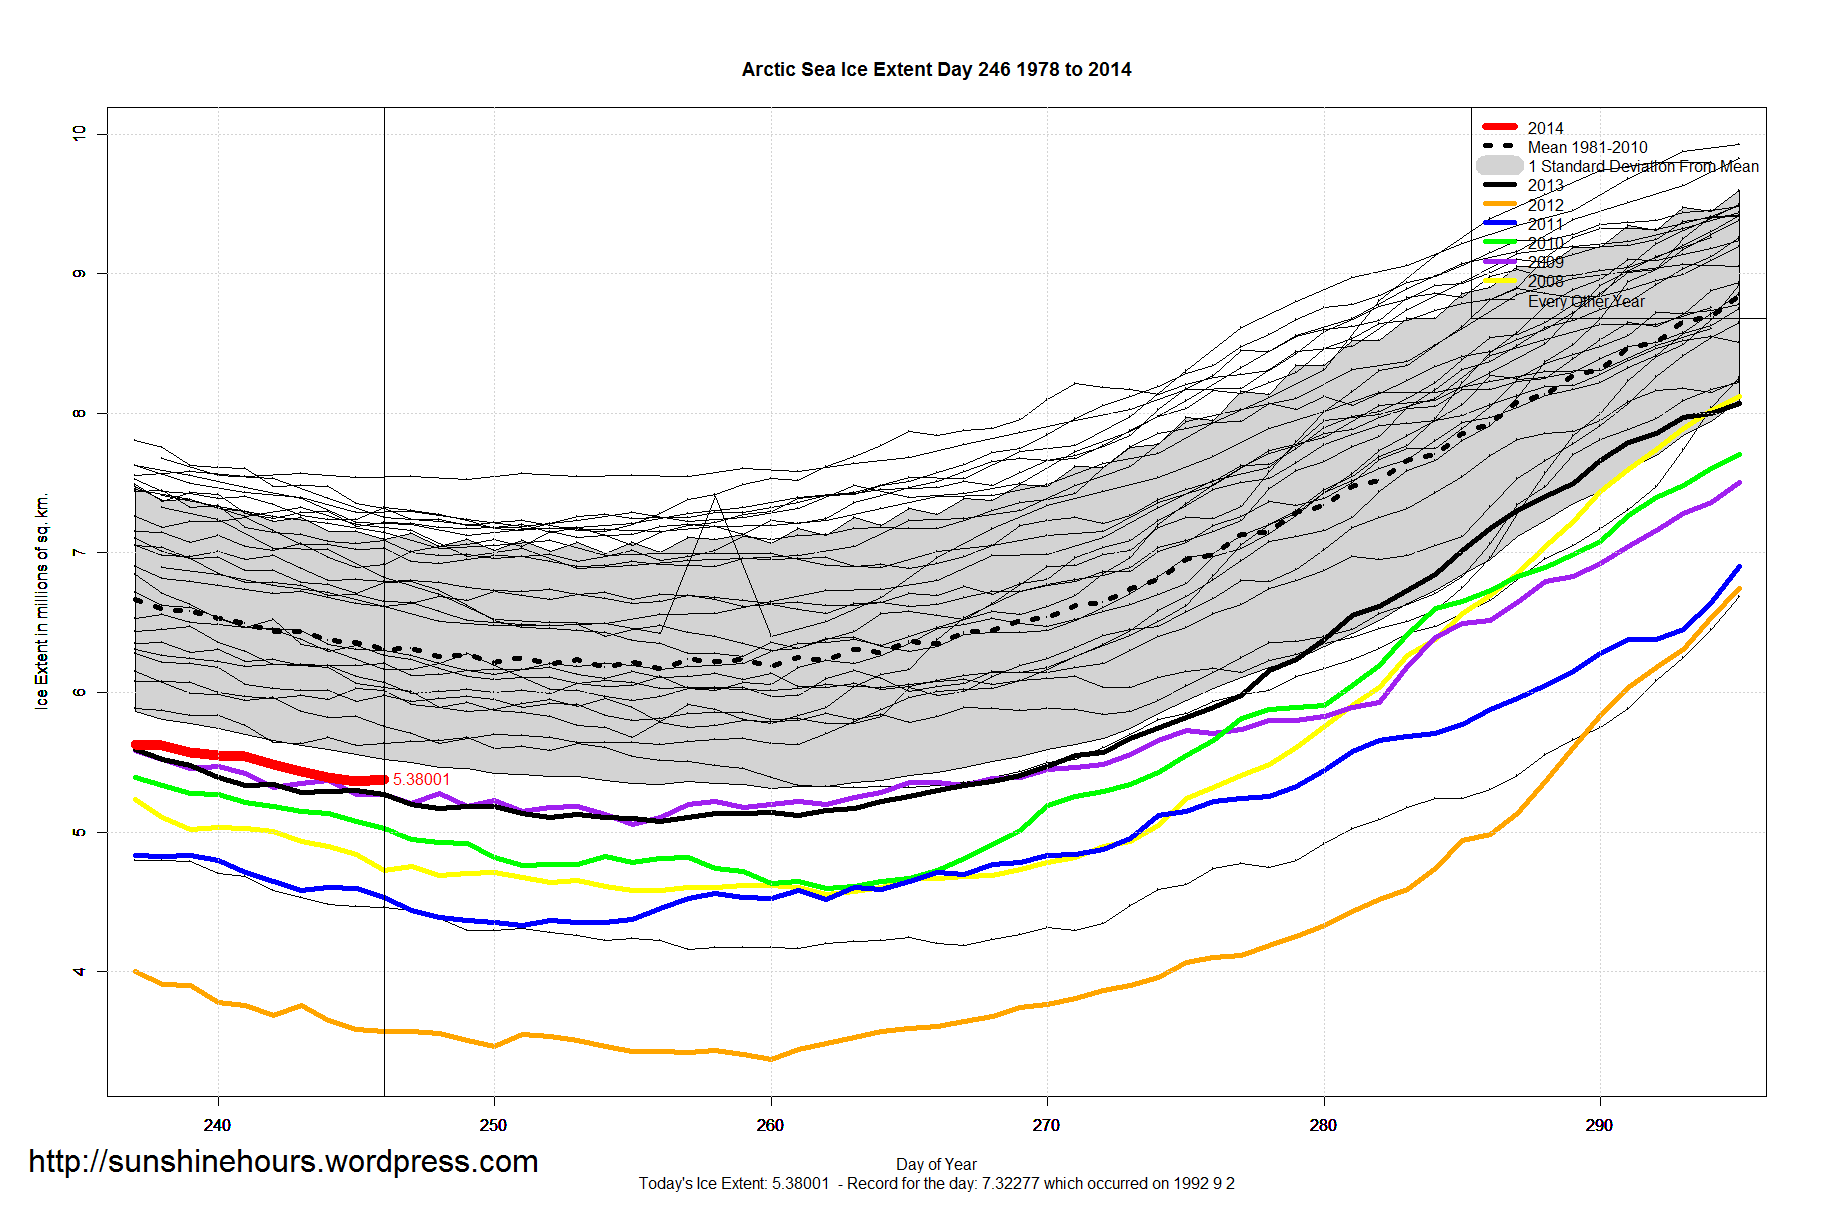
Arctic Sea Ice Extent Sep 04 2014 – -929,000 sq km below the 1981-2010 mean. Data for Day 246. Data here.

Sept 3 2014 MASIE Update – NH Down – Central Arctic Down
Data here. Click for bigger.


| Region | 158 days ago | End | Last 157 | Last 28 | Last 14 | Last 7 | Last 3 | Last 1 |
| Beaufort Sea | 1,070,445 | 706,914 | -363,531 | -115,531 | -9,078 | -10,448 | -10,434 | -12,506 |
| Central Arctic | 3,221,921 | 3,002,852 | -219,069 | -197,839 | -48,579 | 23,263 | -7,941 | -12,077 |
| Canadian Archipelago | 853,214 | 514,953 | -338,261 | -141,608 | -4,576 | 10,800 | 9,671 | -7,988 |
| Laptev Sea | 897,845 | 17,468 | -880,376 | -182,315 | -20,487 | 2,307 | -9,706 | -6,500 |
| Chukchi Sea | 966,006 | 305,501 | -660,505 | -255,760 | -132,078 | -68,205 | -16,772 | -5,280 |
| Baffin Bay Gulf of St. Lawrence | 1,688,530 | 14,747 | -1,673,783 | -40,930 | 3,666 | -2,166 | 285 | -3,473 |
| Barents Sea | 645,917 | 134,621 | -511,297 | 40,303 | 20,893 | -9,036 | 9,140 | -2,712 |
| East Siberian Sea | 1,087,137 | 543,557 | -543,580 | -325,227 | -70,484 | 2,390 | 15,083 | -1,379 |
| Greenland Sea | 603,416 | 216,520 | -386,896 | -130,527 | -53,267 | -26,916 | 2,158 | -179 |
| Bering Sea | 697,324 | 0 | -697,324 | 0 | 0 | 0 | 0 | 0 |
| Baltic Sea | 15,337 | 0 | -15,337 | 0 | 0 | 0 | 0 | 0 |
| Sea of Okhotsk | 853,240 | 0 | -853,240 | 0 | 0 | 0 | 0 | 0 |
| Yellow Sea | 0 | 0 | 0 | 0 | 0 | 0 | 0 | 0 |
| Hudson Bay | 1,260,903 | 27,625 | -1,233,279 | -112,541 | -48,860 | -17,652 | -14,242 | 188 |
| Kara Sea | 933,859 | 128,904 | -804,955 | -153,964 | -44,747 | -29,573 | -3,245 | 2,266 |
| Northern Hemisphere (Total) | 14,805,115 | 5,614,804 | -9,190,310 | -1,615,939 | -407,598 | -125,236 | -26,002 | -49,640 |
| NH (Average Loss per Day) | -58,167 | -57,712 | -29,114 | -17,891 | -8,667 | -49,640 |
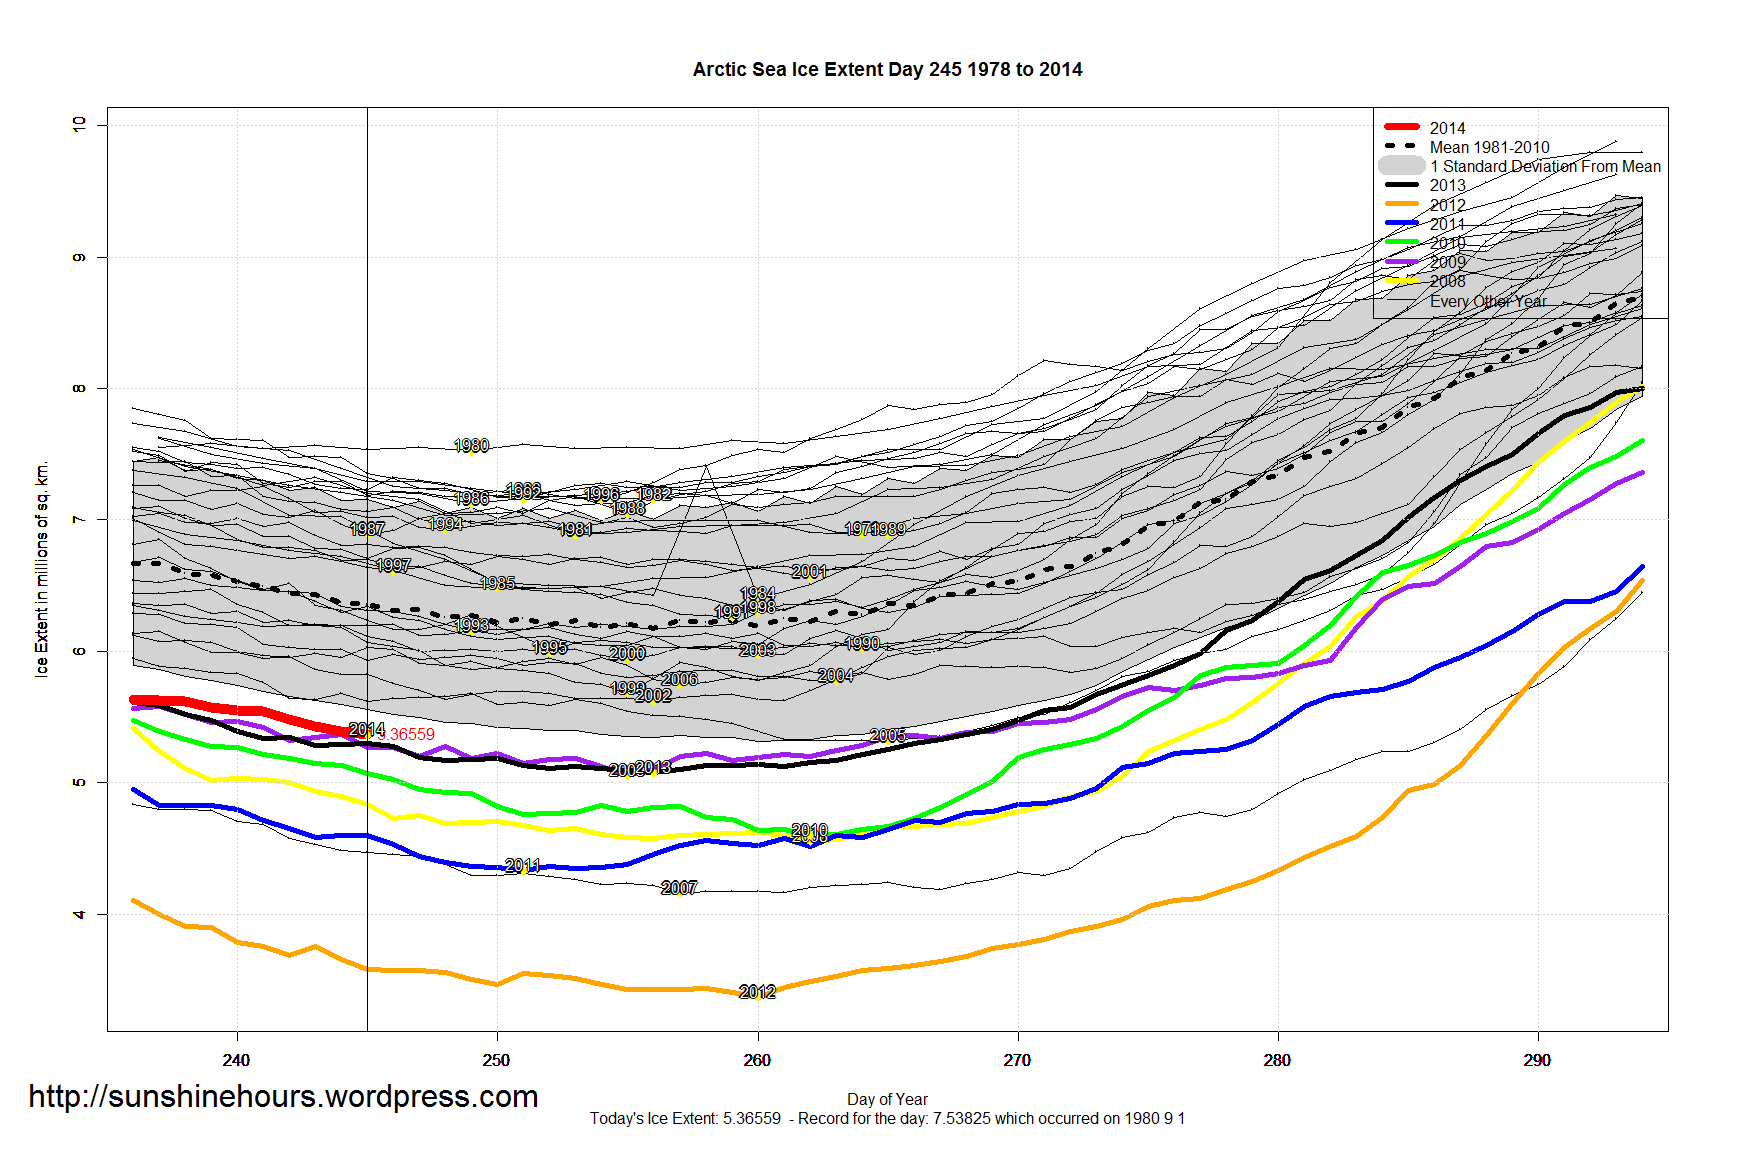
Arctic Sea Ice Extent Sep 03 2014 – -992,000 sq km below the 1981-2010 mean. Data for Day 245. Data here.
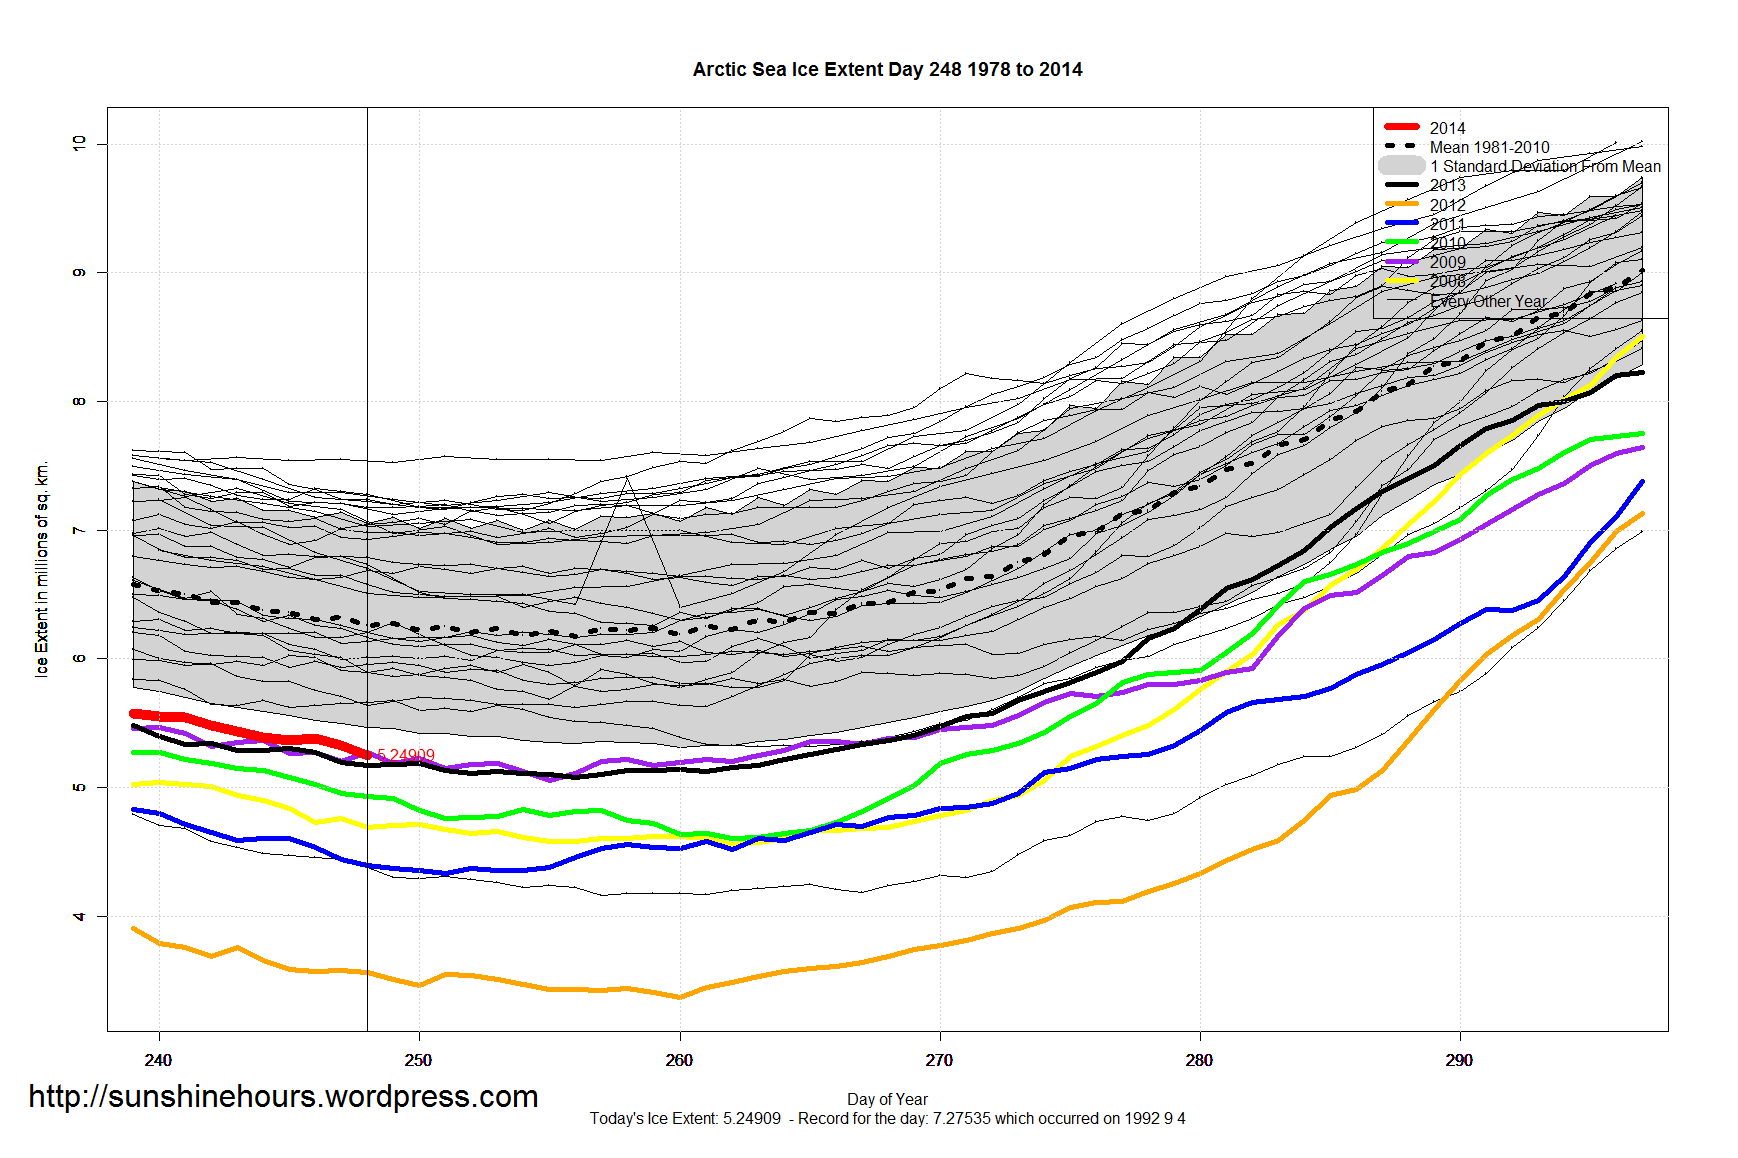
Click on the graph for full size to make the minimums easier to read. 2014 is on there, but I suspect it will change.

Sep 2 2014 MASIE Update – Melting has stopped for 2 days
Data here. Click for bigger.
| Region | 157 days ago | End | Last 156 | Last 28 | Last 14 | Last 7 | Last 3 | Last 1 |
| Chukchi Sea | 966,006 | 310,781 | -655,225 | -272,835 | -140,273 | -94,780 | -35,052 | -14,128 |
| Hudson Bay | 1,260,903 | 27,437 | -1,233,467 | -118,835 | -48,542 | -22,301 | -14,827 | -11,324 |
| Kara Sea | 933,859 | 126,637 | -807,222 | -156,230 | -50,304 | -37,917 | -10,217 | -4,768 |
| Laptev Sea | 897,845 | 23,968 | -873,876 | -174,345 | -14,258 | 4,246 | -1,189 | -3,104 |
| Barents Sea | 645,917 | 137,333 | -508,584 | 47,041 | 23,606 | 75 | 1,513 | -2,023 |
| Central Arctic | 3,221,921 | 3,014,929 | -206,992 | -183,800 | -33,133 | 23,529 | 13,836 | -348 |
| Bering Sea | 697,324 | 0 | -697,324 | 0 | 0 | 0 | 0 | 0 |
| Baltic Sea | 15,337 | 0 | -15,337 | 0 | 0 | 0 | 0 | 0 |
| Sea of Okhotsk | 853,240 | 0 | -853,240 | 0 | 0 | 0 | 0 | 0 |
| Yellow Sea | 0 | 0 | 0 | 0 | 0 | 0 | 0 | 0 |
| Baffin Bay Gulf of St. Lawrence | 1,688,530 | 18,220 | -1,670,310 | -40,563 | 8,444 | 798 | 3,767 | 741 |
| Beaufort Sea | 1,070,445 | 719,419 | -351,026 | -131,590 | -21,198 | 7,301 | 1,100 | 1,485 |
| Greenland Sea | 603,416 | 216,699 | -386,716 | -129,315 | -34,501 | -29,130 | -9,463 | 2,347 |
| East Siberian Sea | 1,087,137 | 544,936 | -542,201 | -341,332 | -69,682 | -1,791 | 17,434 | 5,595 |
| Canadian Archipelago | 853,214 | 522,941 | -330,273 | -136,823 | 2,661 | 8,992 | 13,815 | 27,523 |
| Northern Hemisphere (Total) | 14,805,115 | 5,664,444 | -9,140,671 | -1,638,628 | -377,181 | -140,980 | -19,281 | 1,996 |
| NH (Average Loss per Day) | -58,221 | -58,522 | -26,942 | -20,140 | -6,427 | 1,996 |
