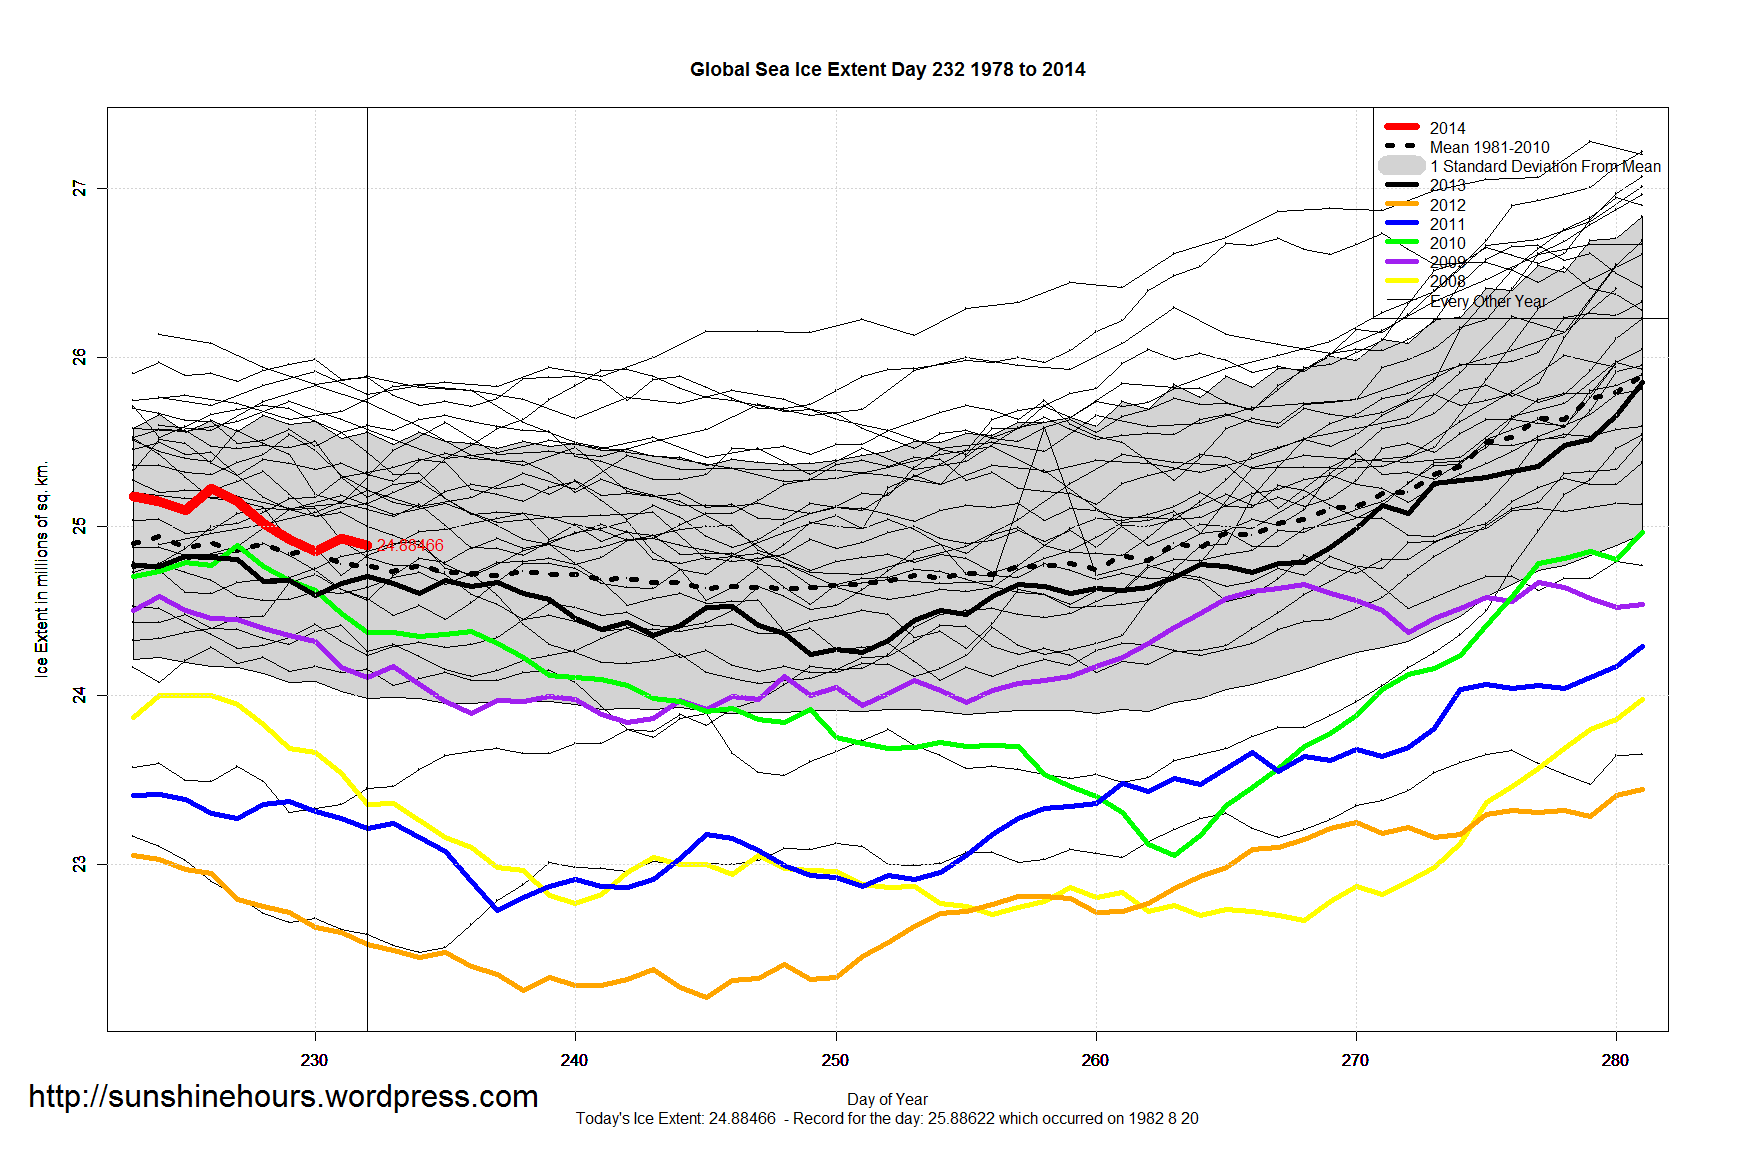
Arctic Sea Ice Extent Aug 23 2014 – -1,071,000 sq km below the 1981-2010 mean. Data for Day 234. Data here.
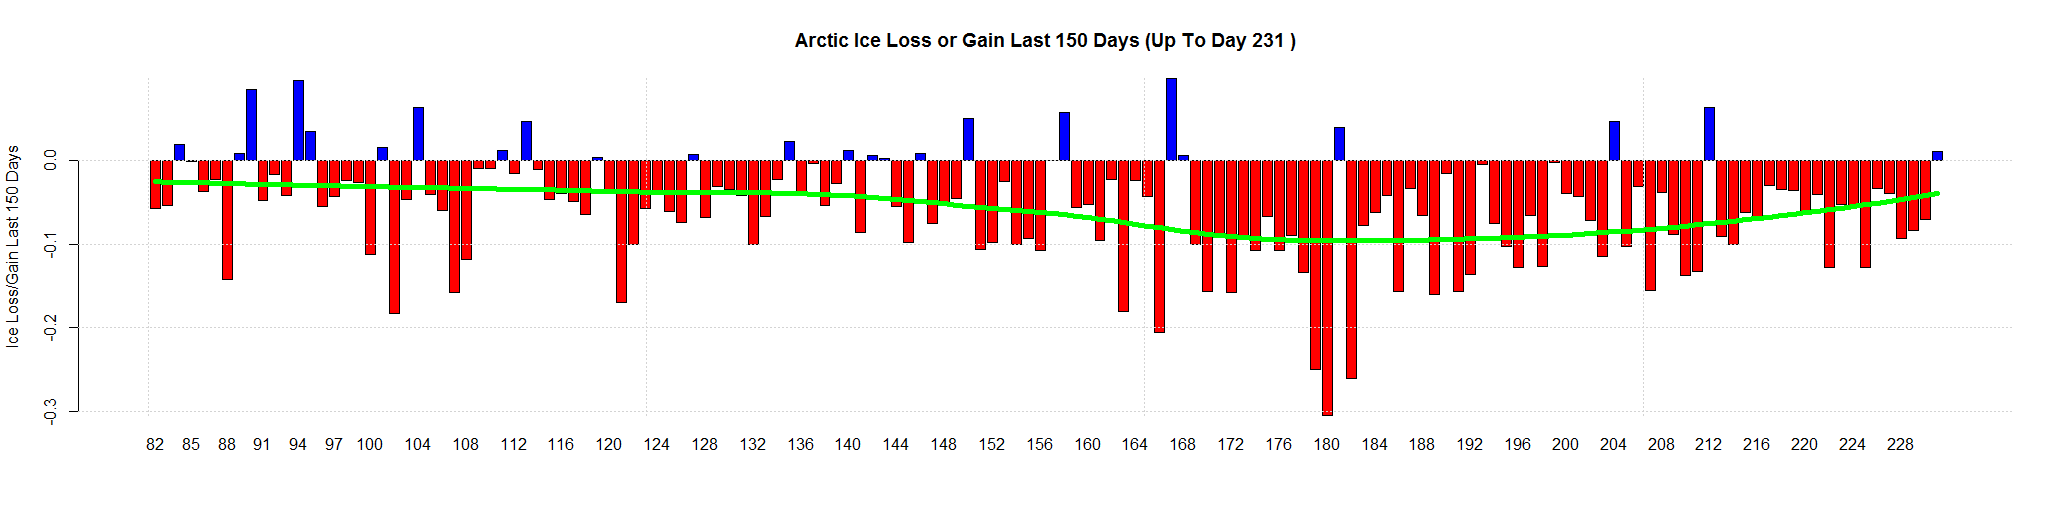
A 39,000 sq km gain. The second gain in 4 days,
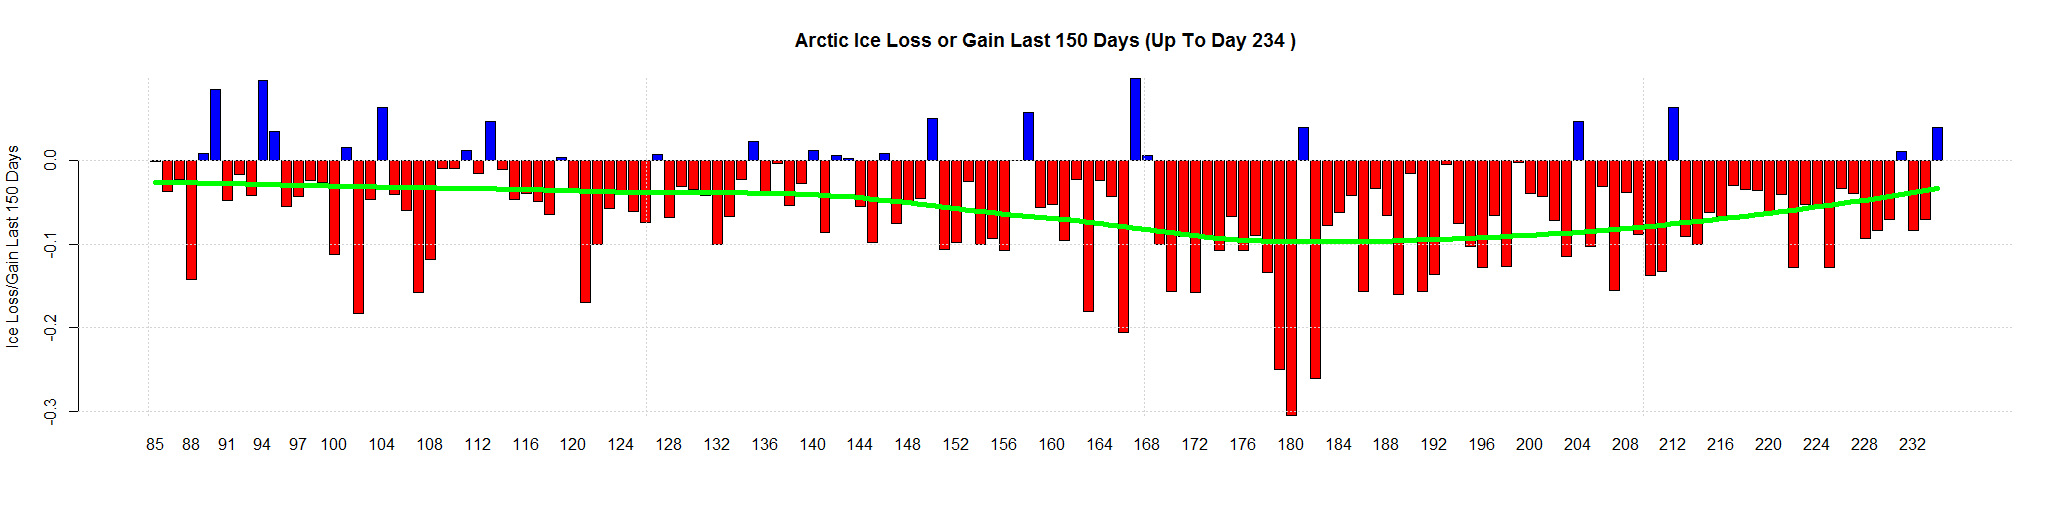
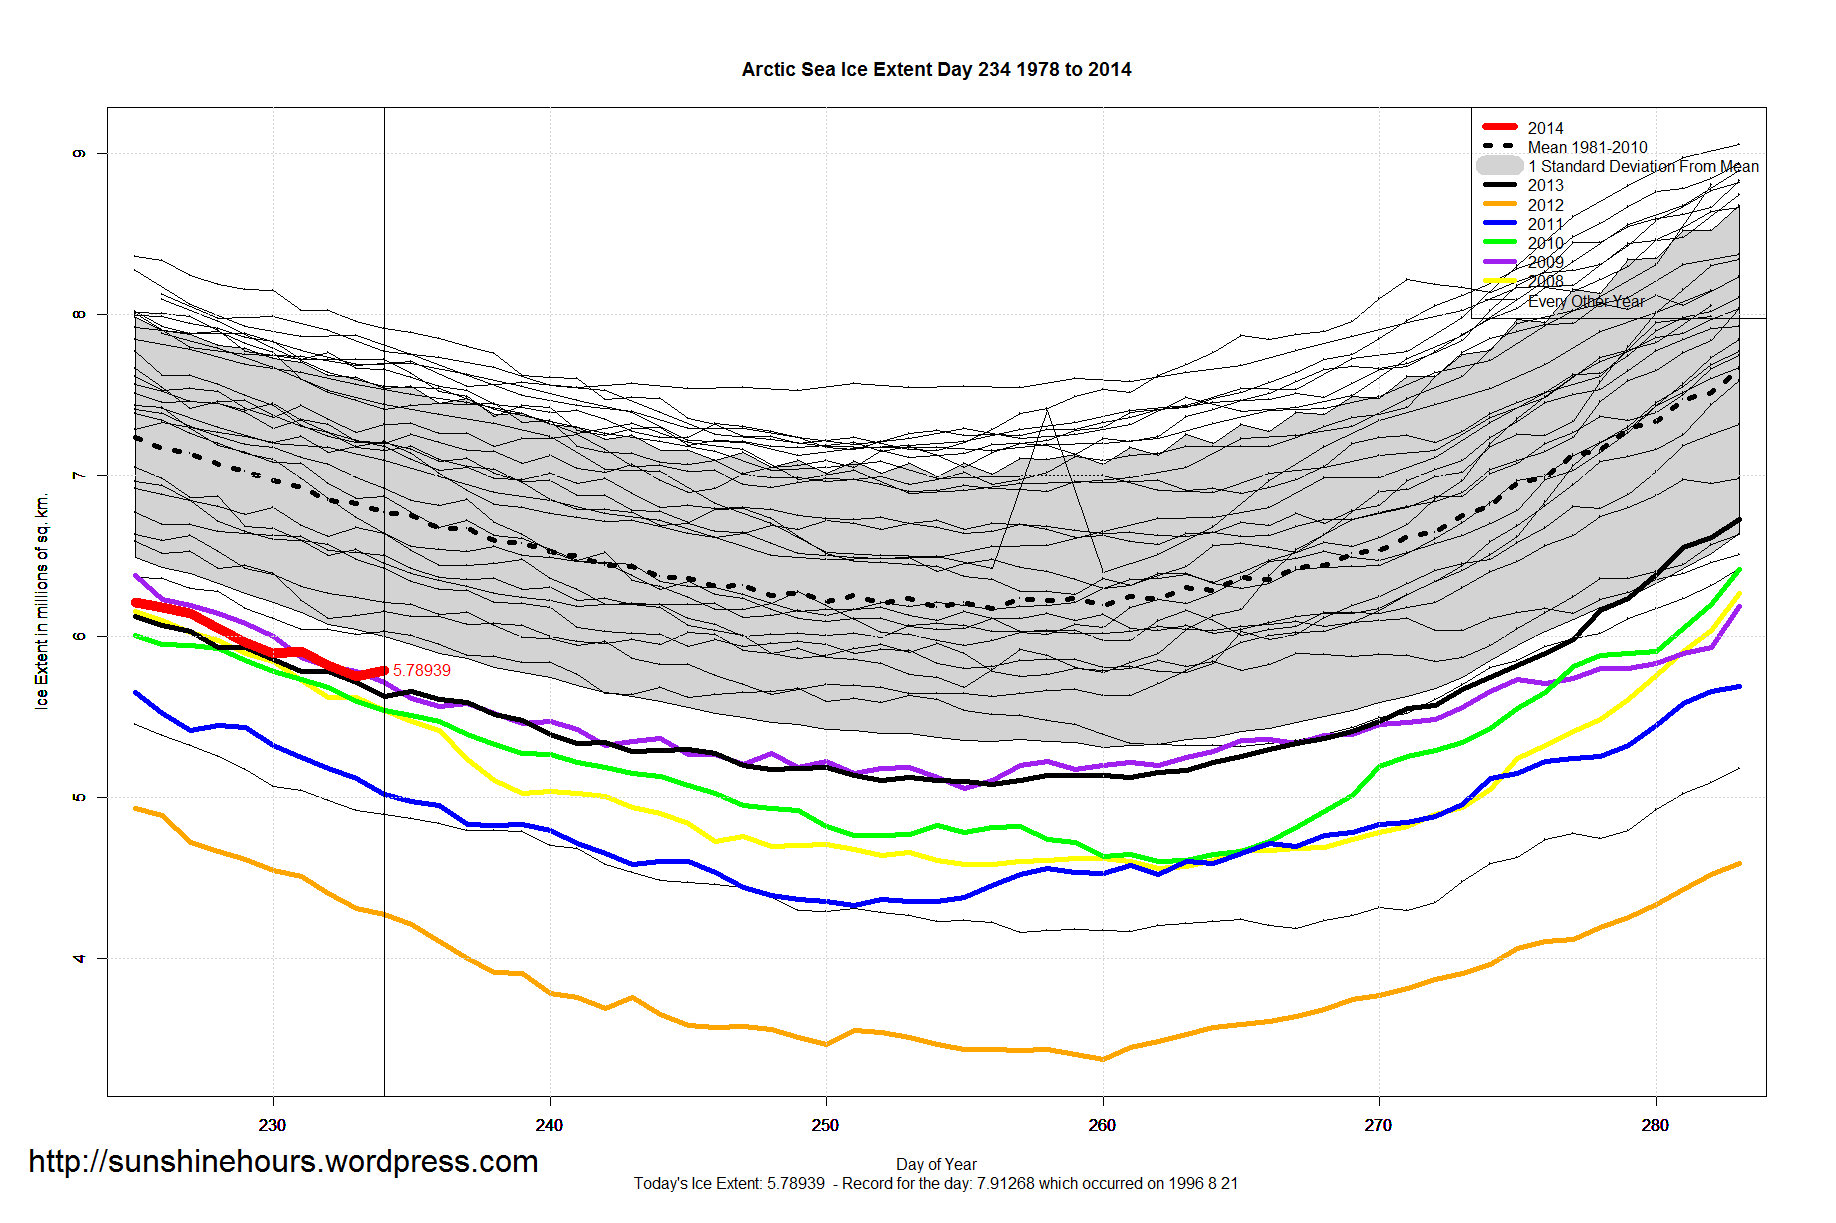

Arctic Sea Ice Extent Aug 23 2014 – -1,071,000 sq km below the 1981-2010 mean. Data for Day 234. Data here.
A 39,000 sq km gain. The second gain in 4 days,
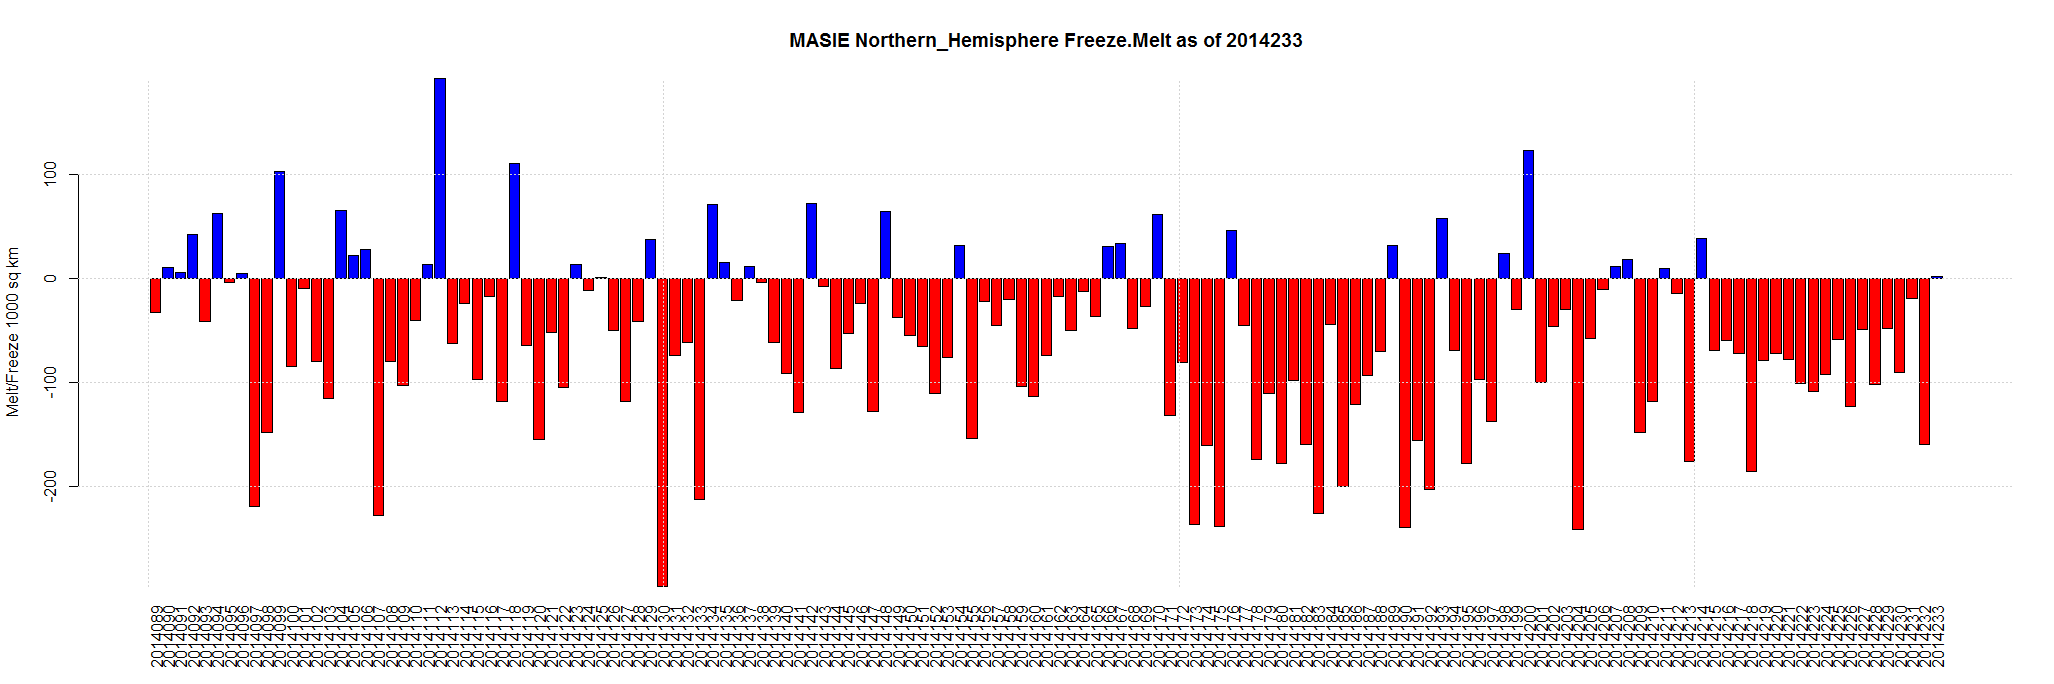
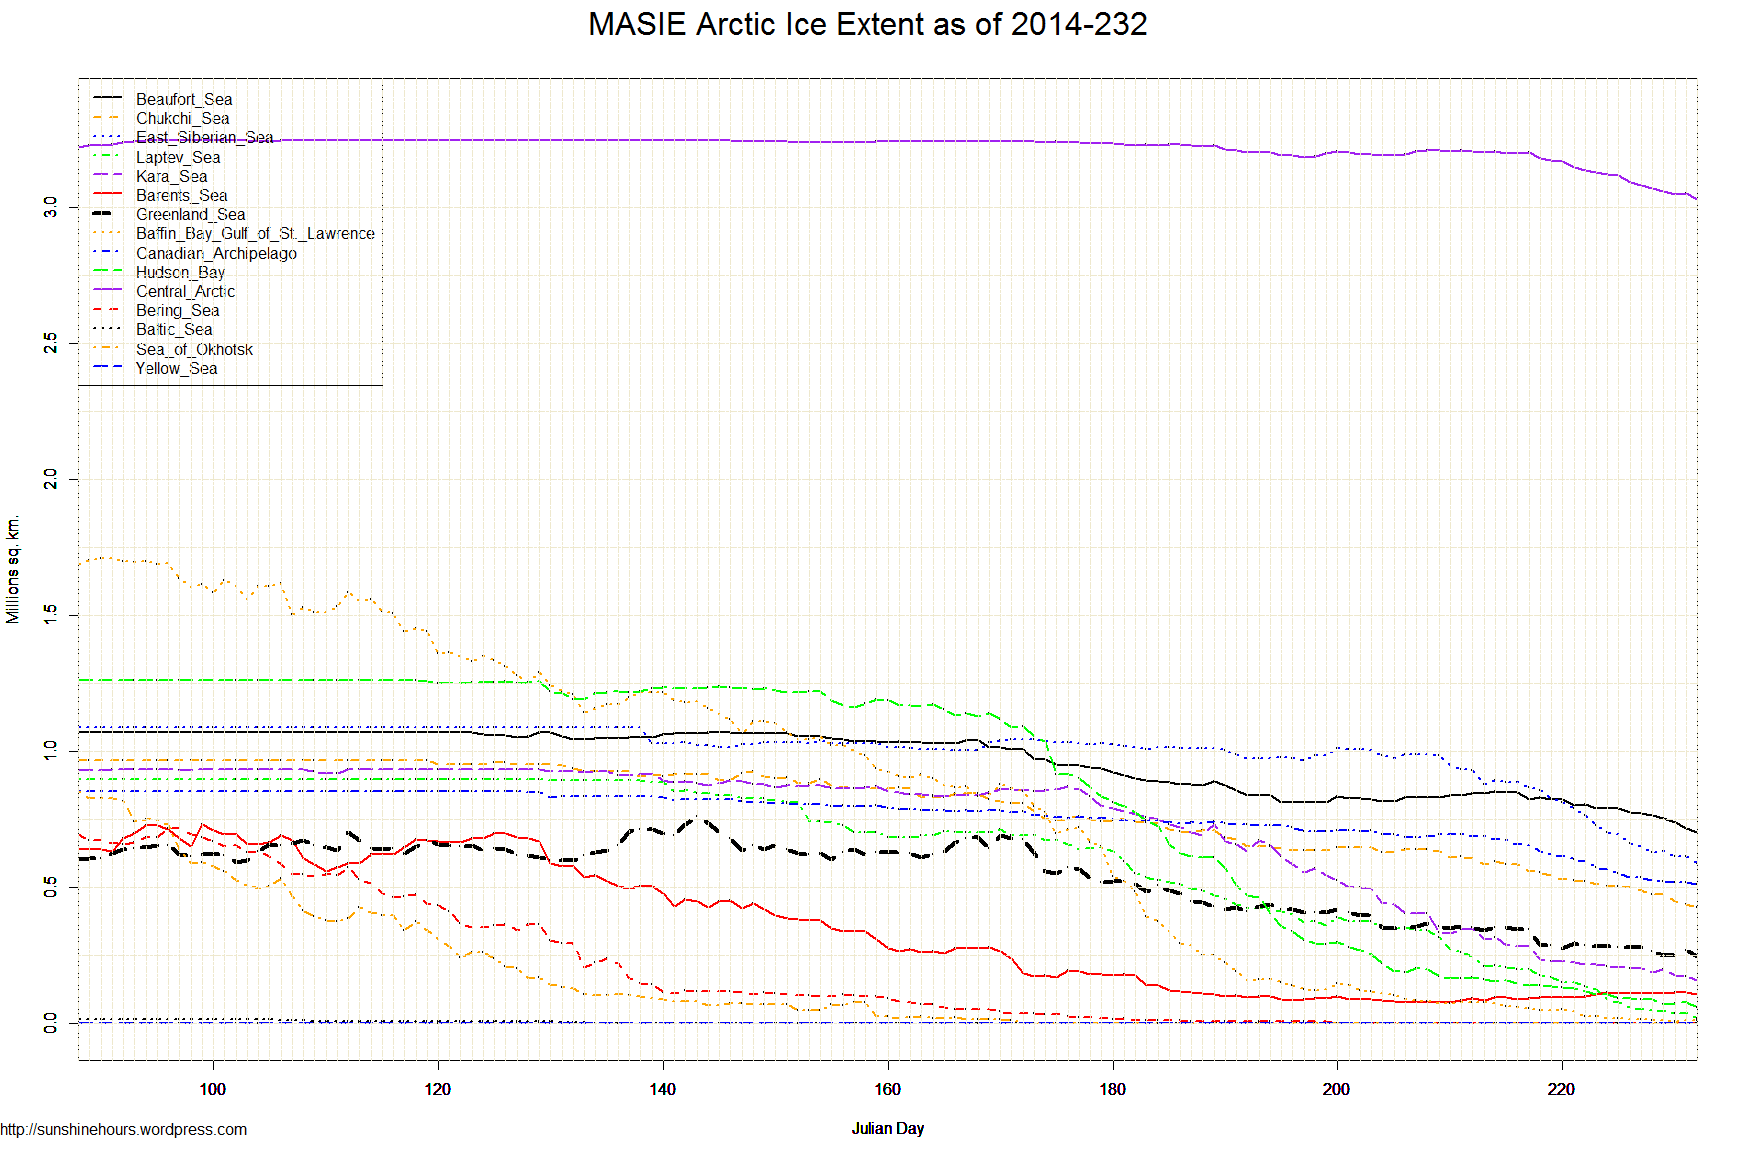
Aug 22 2014 MASIE Update – Tiny Increase – 6 regions showed an increase – 5 showed a drop
Data here. Click for bigger.
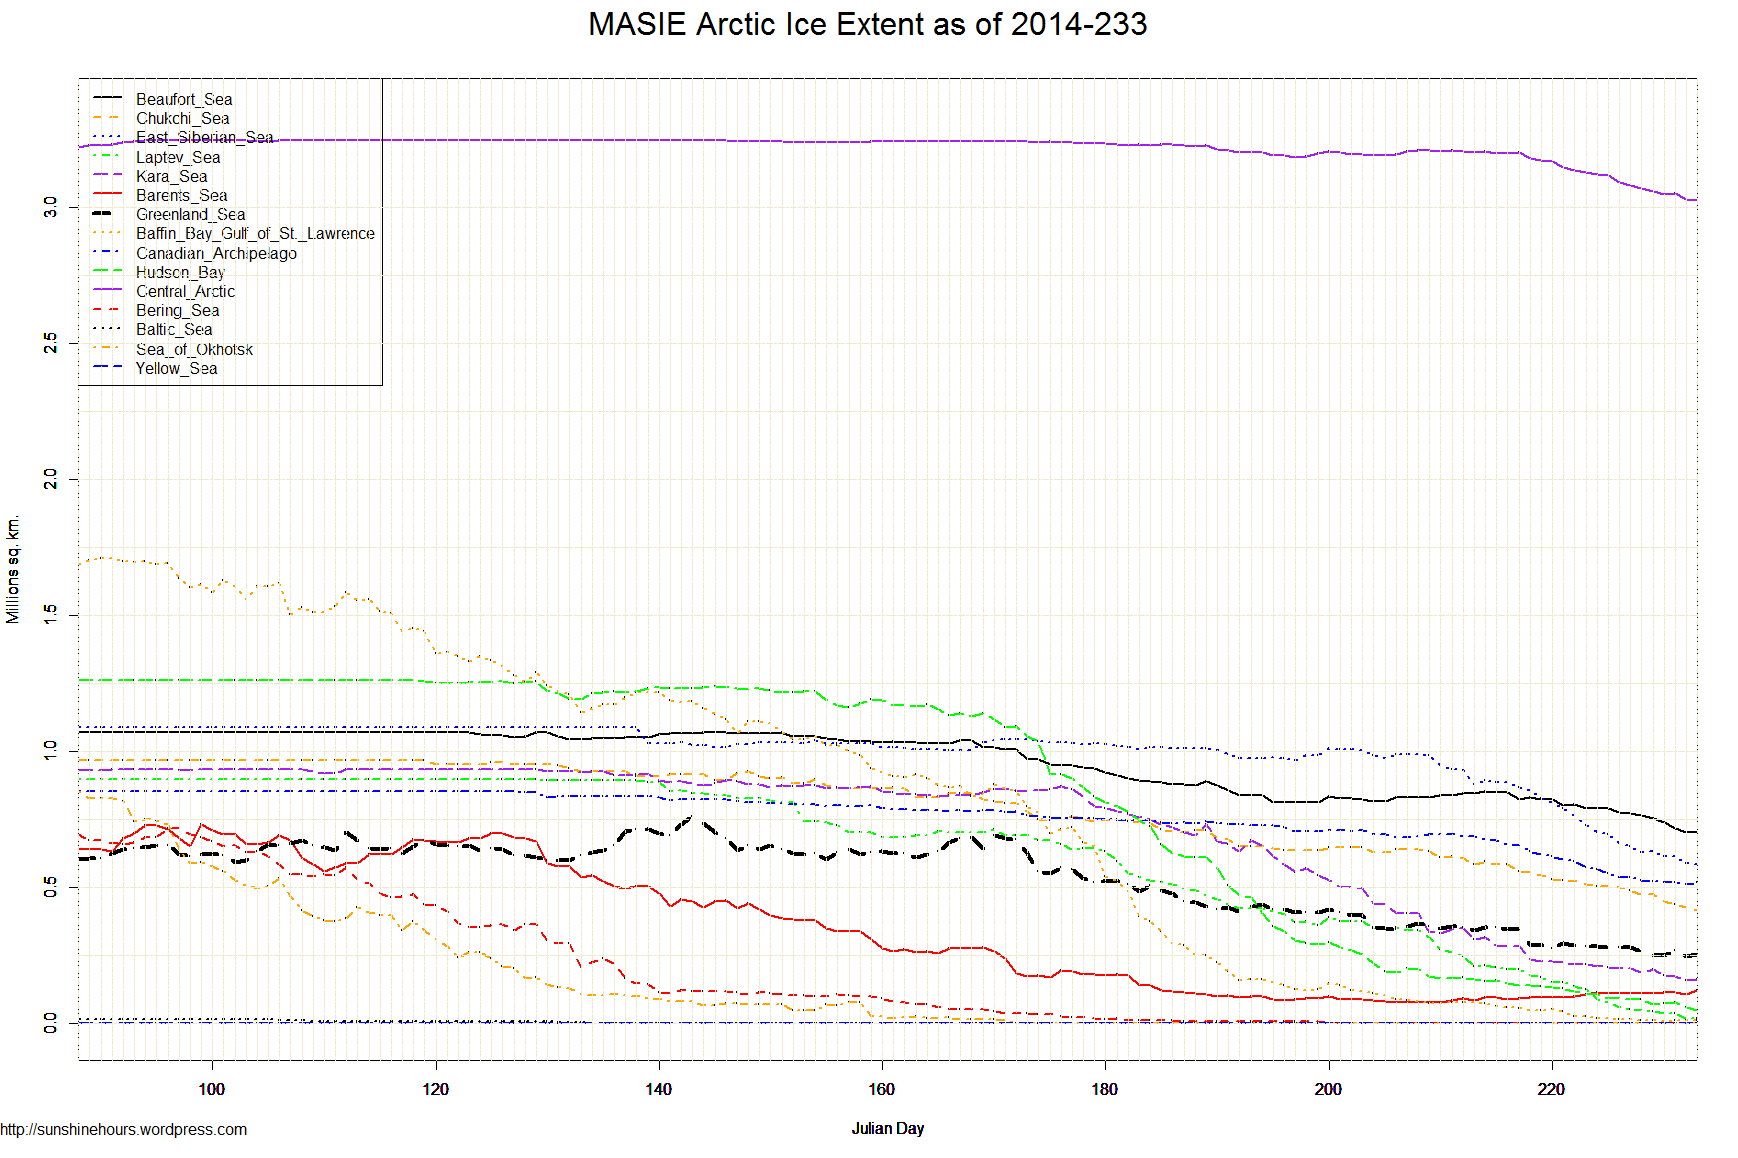
| Region | 146 days ago | End | Last 145 | Last 28 | Last 14 | Last 7 | Last 3 | Last 1 |
| Chukchi Sea | 966,006 | 414,888 | -551,119 | -213,679 | -131,138 | -84,122 | -36,167 | -10,773 |
| Hudson Bay | 1,260,903 | 49,883 | -1,211,020 | -141,278 | -87,674 | -43,060 | -26,096 | -9,259 |
| Central Arctic | 3,221,921 | 3,024,778 | -197,143 | -166,592 | -149,215 | -67,937 | -23,284 | -4,362 |
| East Siberian Sea | 1,087,137 | 584,188 | -502,949 | -391,822 | -245,053 | -77,401 | -30,430 | -4,327 |
| Laptev Sea | 897,845 | 18,201 | -879,644 | -328,371 | -150,205 | -42,348 | -20,026 | -863 |
| Bering Sea | 697,324 | 0 | -697,324 | -15 | 0 | 0 | 0 | 0 |
| Baltic Sea | 15,337 | 0 | -15,337 | 0 | 0 | 0 | 0 | 0 |
| Sea of Okhotsk | 853,240 | 0 | -853,240 | 0 | 0 | 0 | 0 | 0 |
| Yellow Sea | 0 | 0 | 0 | 0 | 0 | 0 | 0 | 0 |
| Baffin Bay Gulf of St. Lawrence | 1,688,530 | 10,260 | -1,678,270 | -92,978 | -39,638 | -4,648 | 484 | 104 |
| Beaufort Sea | 1,070,445 | 704,602 | -365,843 | -113,145 | -121,321 | -72,404 | -36,015 | 875 |
| Kara Sea | 933,859 | 161,310 | -772,549 | -276,831 | -66,476 | -42,057 | -15,631 | 3,751 |
| Greenland Sea | 603,416 | 254,242 | -349,174 | -96,417 | -32,266 | -26,568 | 3,042 | 5,443 |
| Canadian Archipelago | 853,214 | 517,621 | -335,593 | -176,855 | -104,532 | -20,359 | -2,659 | 6,591 |
| Barents Sea | 645,917 | 123,797 | -522,120 | 41,552 | 26,312 | 13,434 | 10,070 | 14,536 |
| Northern Hemisphere (Total) | 14,805,115 | 5,864,912 | -8,940,203 | -1,956,432 | -1,101,208 | -467,469 | -176,713 | 1,715 |
| NH (Average Loss per Day) | -61,234 | -69,873 | -78,658 | -66,781 | -58,904 | 1,715 |
Arctic Sea Ice Extent Aug 22 2014 – -1,115,000 sq km below the 1981-2010 mean. Data for Day 233. Data here.


* NOTE: The Antarctic data from NSIDC has a Missing column that is usually 0. Today it is 0.00054. So Global Sea Ice will be affected,
Global Sea Ice Extent Aug 22 2014 – 21,000 sq km above the 1981-2010 mean. Data for Day 233. Data here.


Aug 21 2014 MASIE Update – Bigger Drop
Data here. Click for bigger.

| Region | 145 days ago | End | Last 144 | Last 28 | Last 14 | Last 7 | Last 3 | Last 1 |
| East Siberian Sea | 1,087,137 | 588,515 | -498,622 | -398,333 | -268,938 | -107,813 | -44,380 | -25,526 |
| Central Arctic | 3,221,921 | 3,029,140 | -192,781 | -160,499 | -151,074 | -88,918 | -29,112 | -22,291 |
| Greenland Sea | 603,416 | 248,799 | -354,617 | -106,591 | -37,702 | -31,239 | -3,775 | -20,988 |
| Laptev Sea | 897,845 | 19,064 | -878,781 | -329,472 | -158,993 | -59,618 | -24,066 | -18,892 |
| Hudson Bay | 1,260,903 | 59,143 | -1,201,761 | -160,617 | -81,006 | -33,992 | -10,123 | -17,342 |
| Kara Sea | 933,859 | 157,559 | -776,300 | -282,627 | -77,321 | -49,383 | -43,044 | -16,092 |
| Beaufort Sea | 1,070,445 | 703,727 | -366,718 | -112,742 | -127,249 | -85,738 | -49,207 | -12,265 |
| Chukchi Sea | 966,006 | 425,660 | -540,346 | -202,362 | -130,142 | -79,760 | -50,568 | -11,918 |
| Canadian Archipelago | 853,214 | 511,030 | -342,184 | -183,684 | -121,614 | -42,312 | -12,514 | -8,499 |
| Barents Sea | 645,917 | 109,261 | -536,656 | 22,964 | 11,544 | -2,894 | -684 | -4,466 |
| Baffin Bay Gulf of St. Lawrence | 1,688,530 | 10,157 | -1,678,374 | -101,523 | -39,742 | -10,549 | -1,651 | -925 |
| Bering Sea | 697,324 | 0 | -697,324 | -15 | 0 | 0 | 0 | 0 |
| Baltic Sea | 15,337 | 0 | -15,337 | 0 | 0 | 0 | 0 | 0 |
| Sea of Okhotsk | 853,240 | 0 | -853,240 | 0 | 0 | 0 | 0 | 0 |
| Yellow Sea | 0 | 0 | 0 | 0 | 0 | 0 | 0 | 0 |
| Northern Hemisphere (Total) | 14,805,115 | 5,863,197 | -8,941,918 | -2,015,501 | -1,182,237 | -592,217 | -269,125 | -159,205 |
| NH (Average Loss per Day) | -61,668 | -71,982 | -84,446 | -84,602 | -89,708 | -159,205 |
Arctic Sea Ice Extent Aug 21 2014 – -1,076,000 sq km below the 1981-2010 mean. Data for Day 232. Data here.


Global Sea Ice Extent Aug 21 2014 – 59,000 sq km above the 1981-2010 mean. Data for Day 232. Data here.

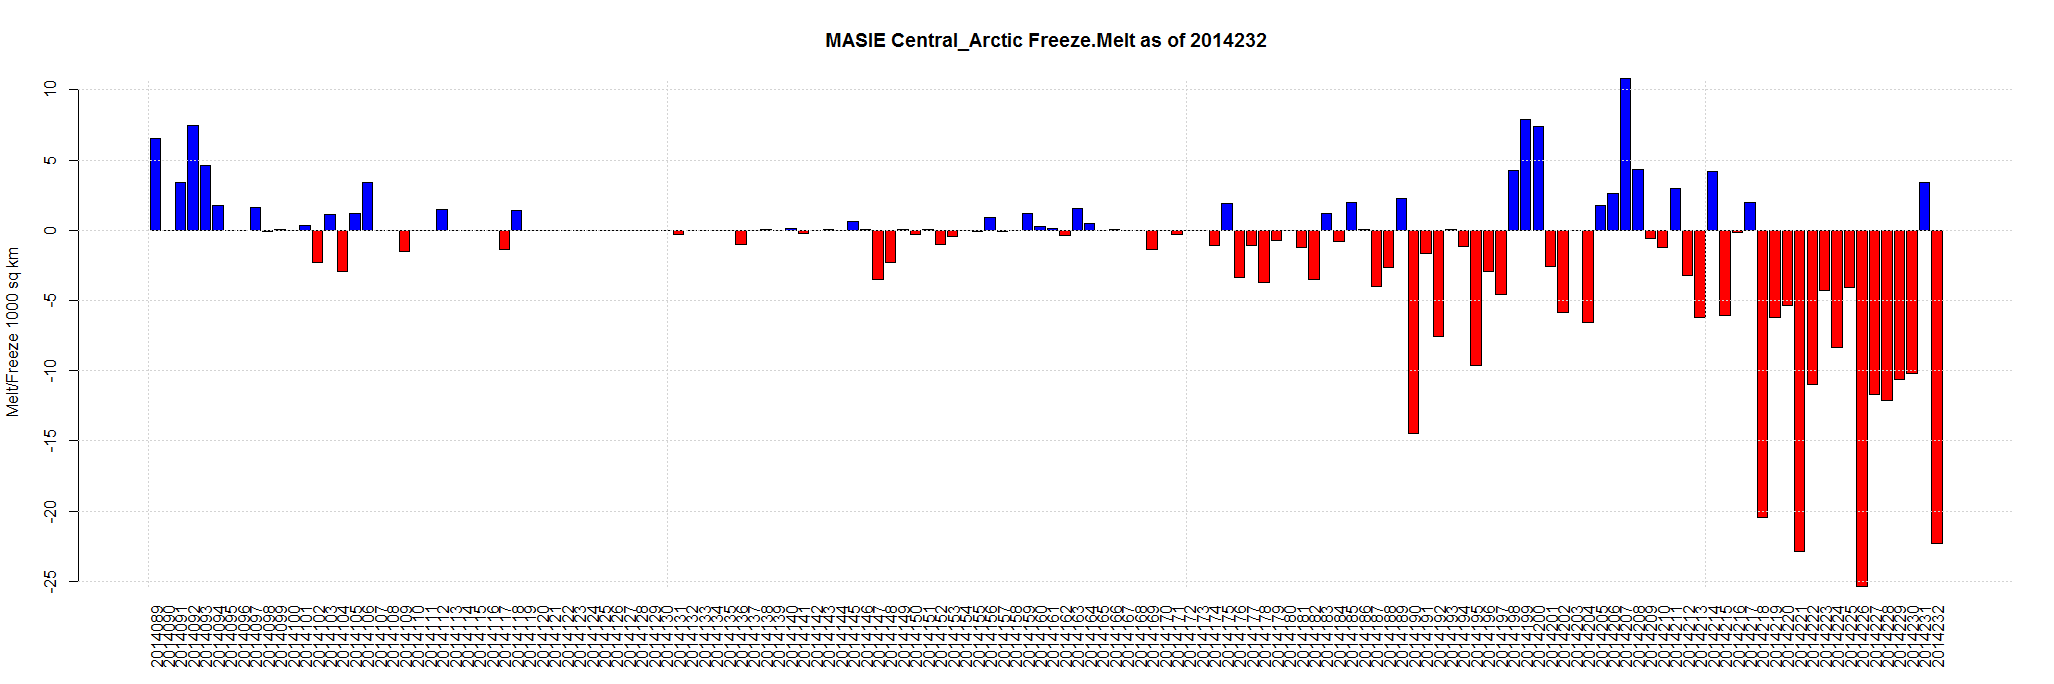
Aug 20 2014 MASIE Update – Tiny Melt … Central Arctic has more ice for first time in 2 weeks. 3 other regions also grew (see bottom table).
Data here. Click for bigger.


| Region | 144 days ago | End | Last 143 | Last 28 | Last 14 | Last 7 | Last 3 | Last 1 |
| Beaufort Sea | 1,070,445 | 715,992 | -354,453 | -109,619 | -106,453 | -73,473 | -47,818 | -24,625 |
| Chukchi Sea | 966,006 | 437,579 | -528,427 | -209,798 | -123,683 | -67,842 | -37,322 | -13,476 |
| Kara Sea | 933,859 | 173,651 | -760,208 | -323,859 | -109,217 | -37,863 | -13,479 | -3,290 |
| Canadian Archipelago | 853,214 | 519,529 | -333,685 | -190,576 | -137,031 | -46,510 | -8,249 | -751 |
| East Siberian Sea | 1,087,137 | 614,041 | -473,096 | -391,938 | -254,743 | -89,880 | -14,630 | -577 |
| Laptev Sea | 897,845 | 37,955 | -859,889 | -339,566 | -161,828 | -52,366 | -10,430 | -271 |
| Barents Sea | 645,917 | 113,727 | -532,190 | 23,174 | 19,410 | 295 | 857 | 0 |
| Bering Sea | 697,324 | 0 | -697,324 | -1,339 | 0 | 0 | 0 | 0 |
| Baltic Sea | 15,337 | 0 | -15,337 | 0 | 0 | 0 | 0 | 0 |
| Sea of Okhotsk | 853,240 | 0 | -853,240 | 0 | 0 | 0 | 0 | 0 |
| Yellow Sea | 0 | 0 | 0 | 0 | 0 | 0 | 0 | 0 |
| Hudson Bay | 1,260,903 | 76,484 | -1,184,419 | -176,798 | -63,681 | -30,661 | -11,236 | 505 |
| Baffin Bay Gulf of St. Lawrence | 1,688,530 | 11,082 | -1,677,449 | -106,453 | -44,596 | -9,842 | -1,516 | 1,305 |
| Central Arctic | 3,221,921 | 3,051,432 | -170,490 | -144,797 | -149,260 | -70,696 | -17,449 | 3,369 |
| Greenland Sea | 603,416 | 269,787 | -333,629 | -126,603 | -77,260 | -13,178 | 2,944 | 18,587 |
| Northern Hemisphere (Total) | 14,805,115 | 6,022,402 | -8,782,713 | -2,098,170 | -1,208,341 | -492,015 | -158,328 | -19,223 |
| NH (Average Loss per Day) | -60,991 | -74,935 | -86,310 | -70,288 | -52,776 | -19,223 |
Arctic Sea Ice Extent Aug 20 2014 – -1,084,000 sq km below the 1981-2010 mean. Data for Day 231. Data here.
The tiny blue bar all the way to the right is a 10,000 sq km gain.


Northern Sea Route: Ice conditions during the voyage were more severe than it is typical for this period of time.
http://en.portnews.ru/news/185639/
