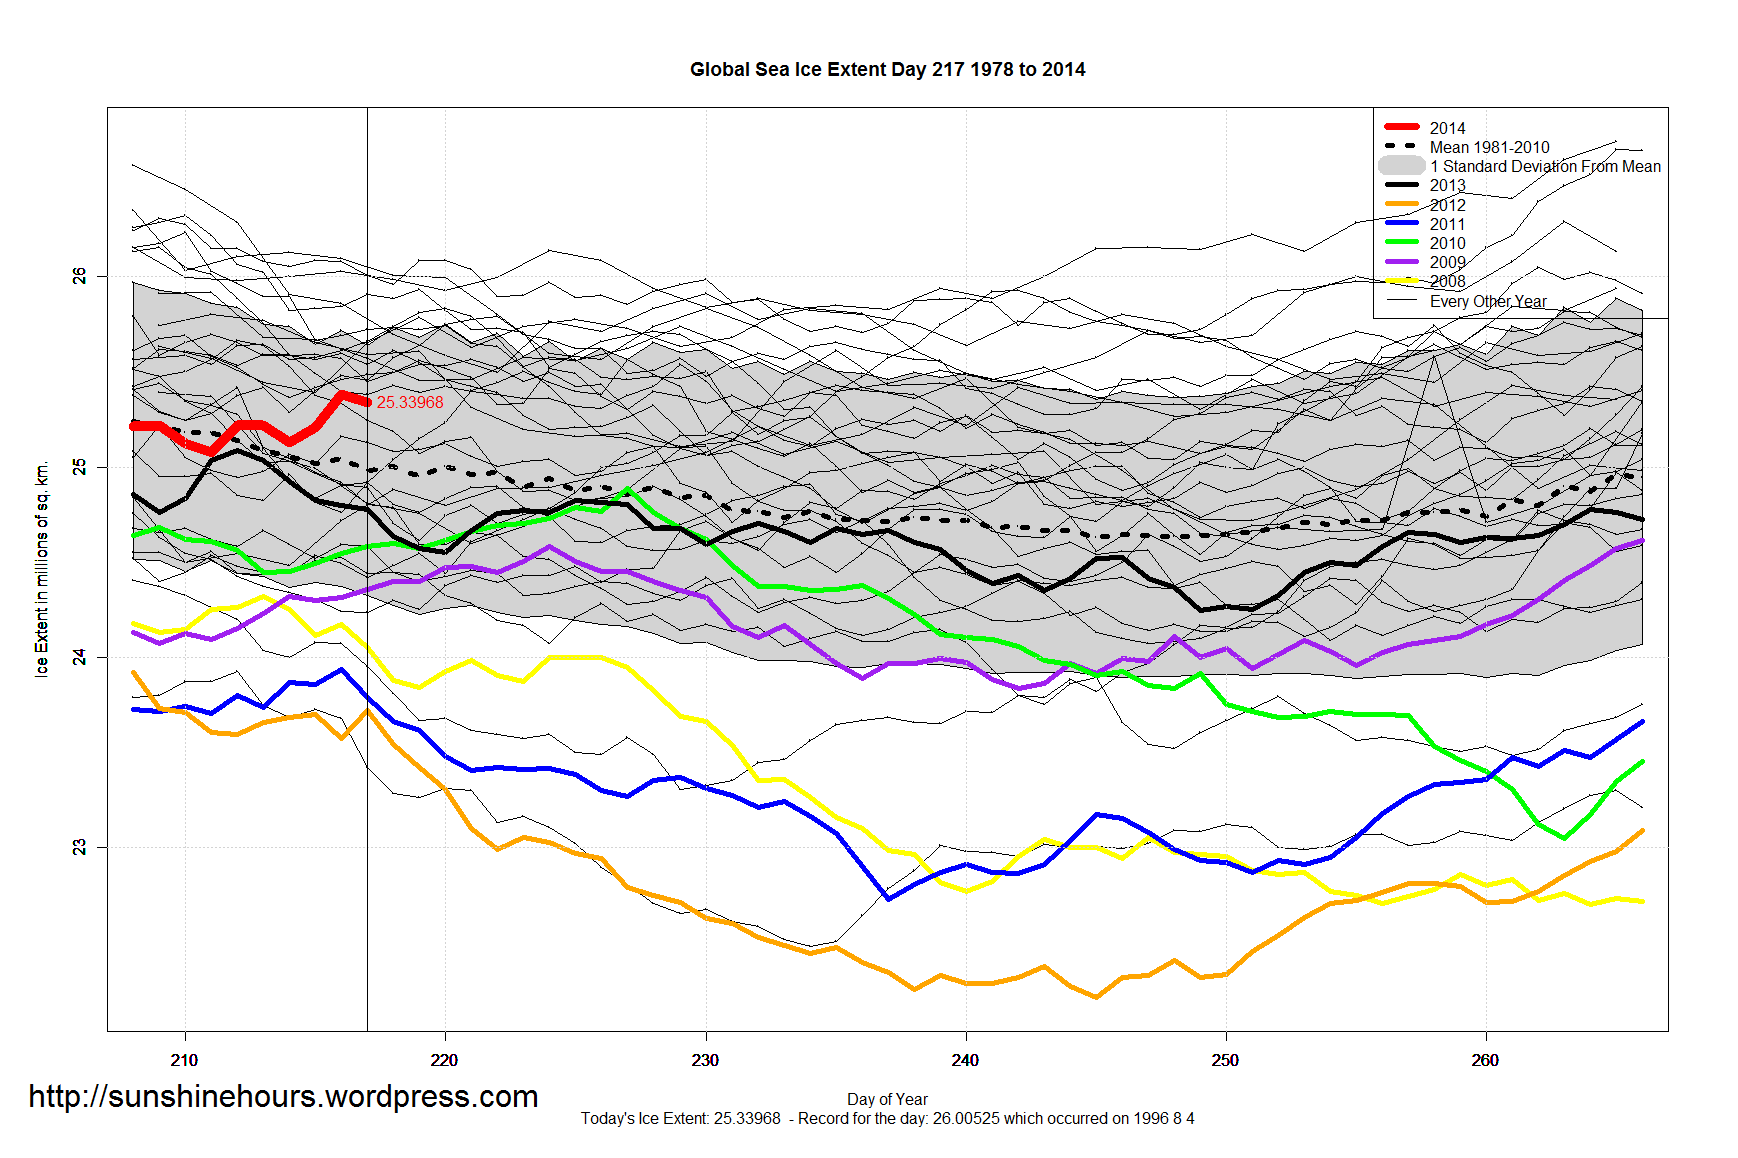
Global Sea Ice Extent is 293,000 sq km above the 1981-2010 mean. Still higher than any year (for day 217) since 2000.
Global Sea Ice Extent is 293,000 sq km above the 1981-2010 mean. Still higher than any year (for day 217) since 2000.
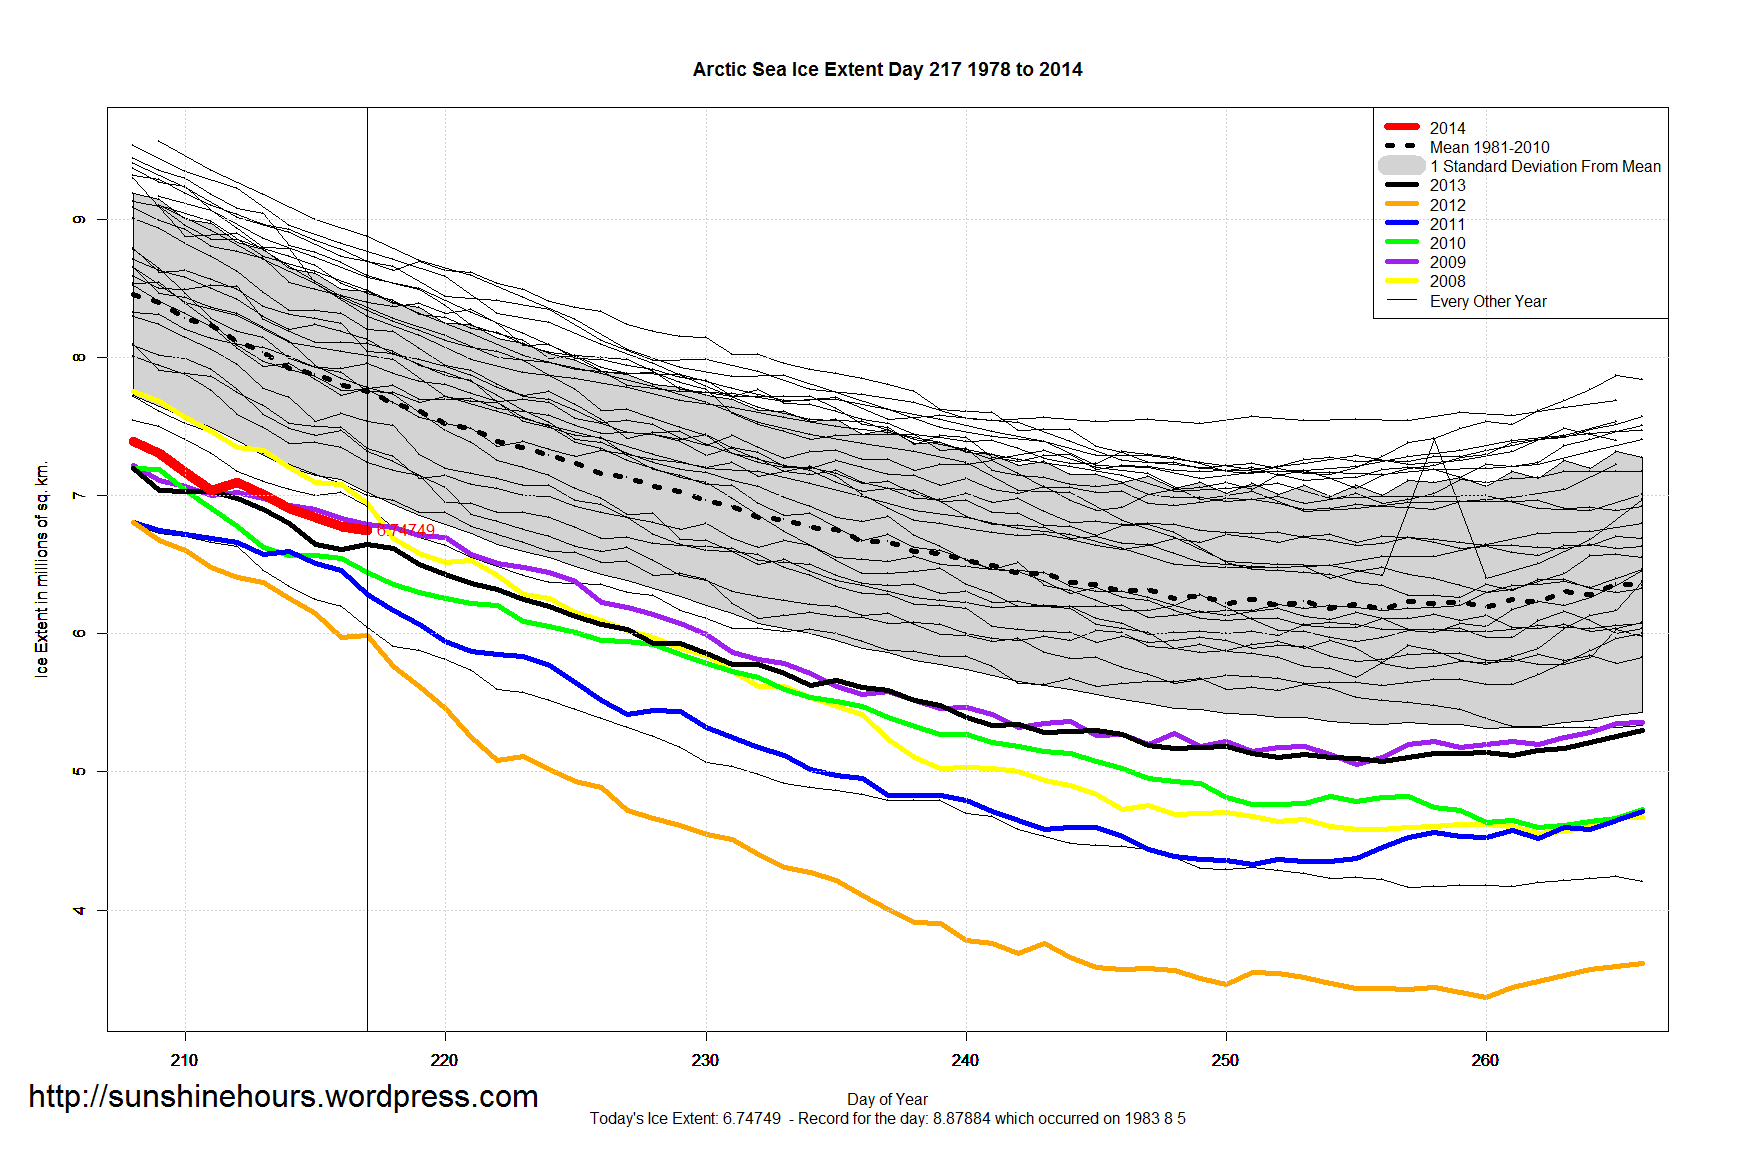
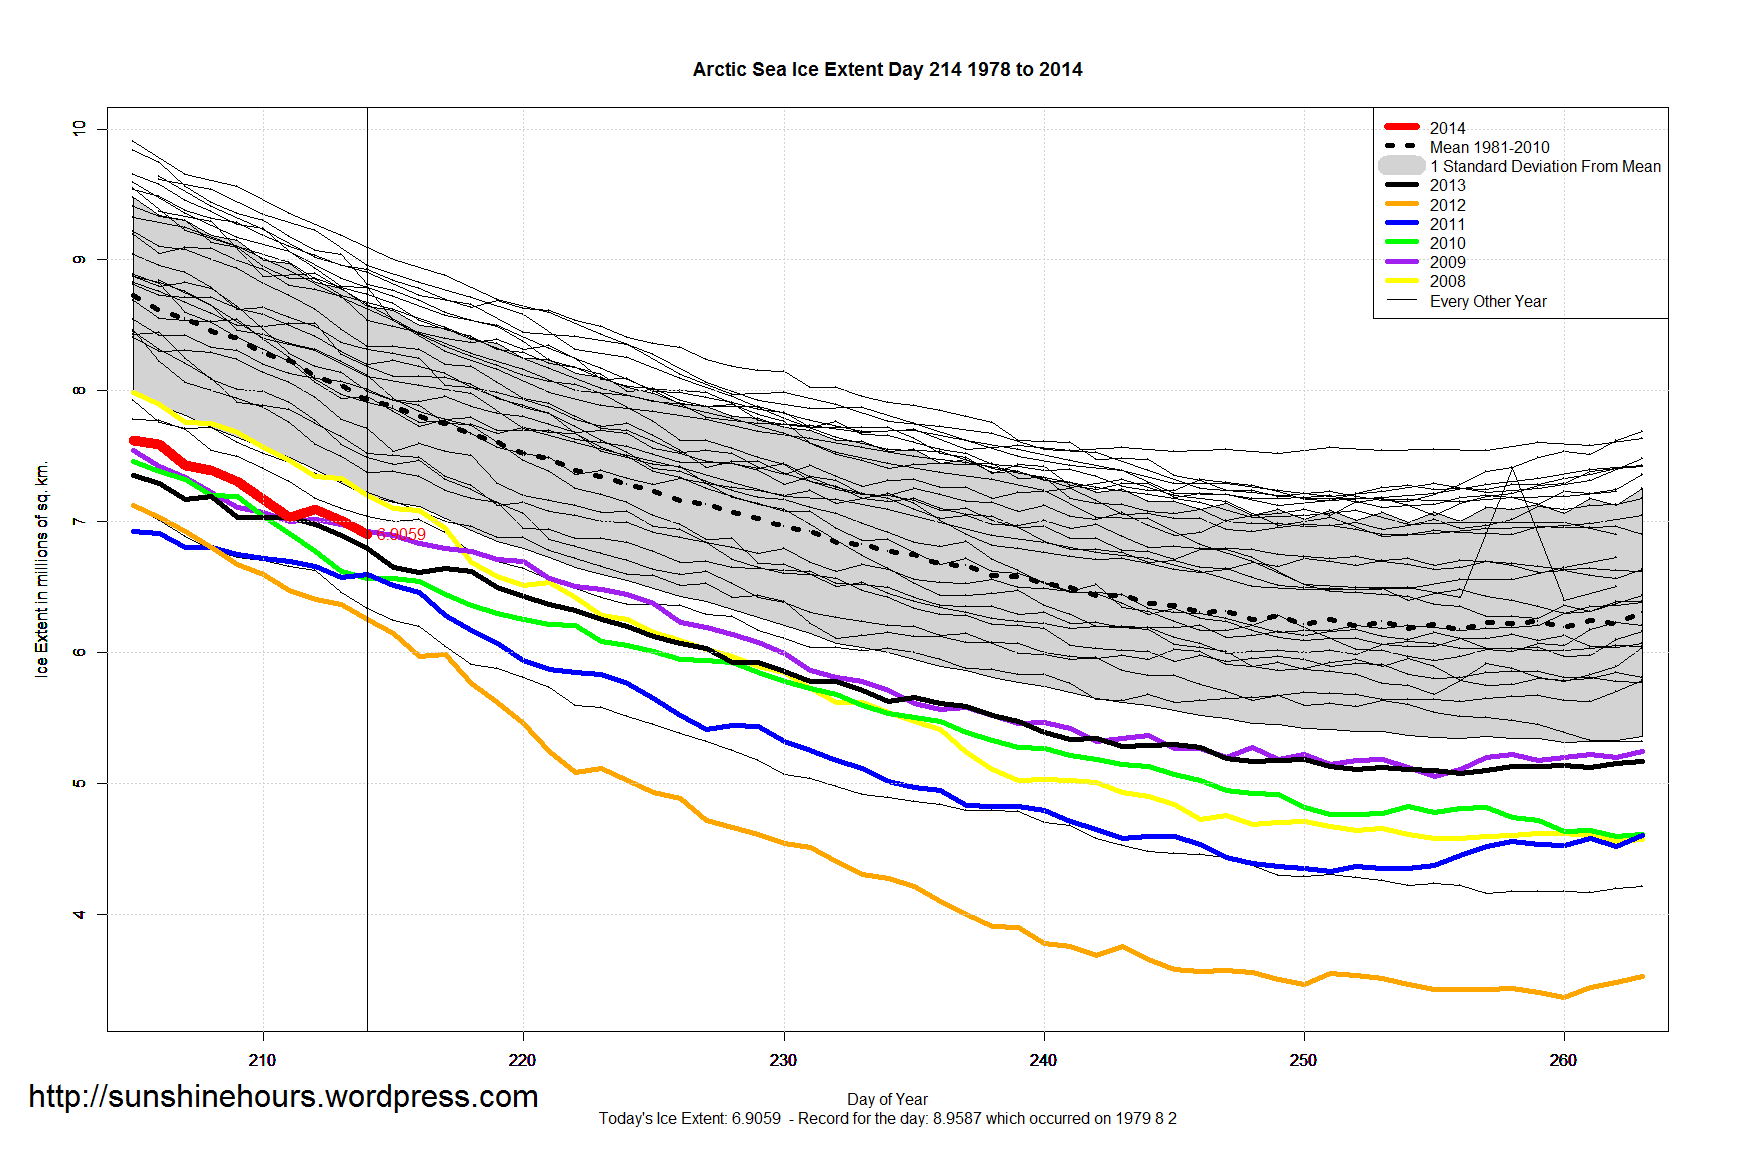
Arctic Sea Ice Extent is -1,064,000 sq km below the 1981-2010 mean. 13% below “normal’. Slowly approaching the Standard Deviation bounds.
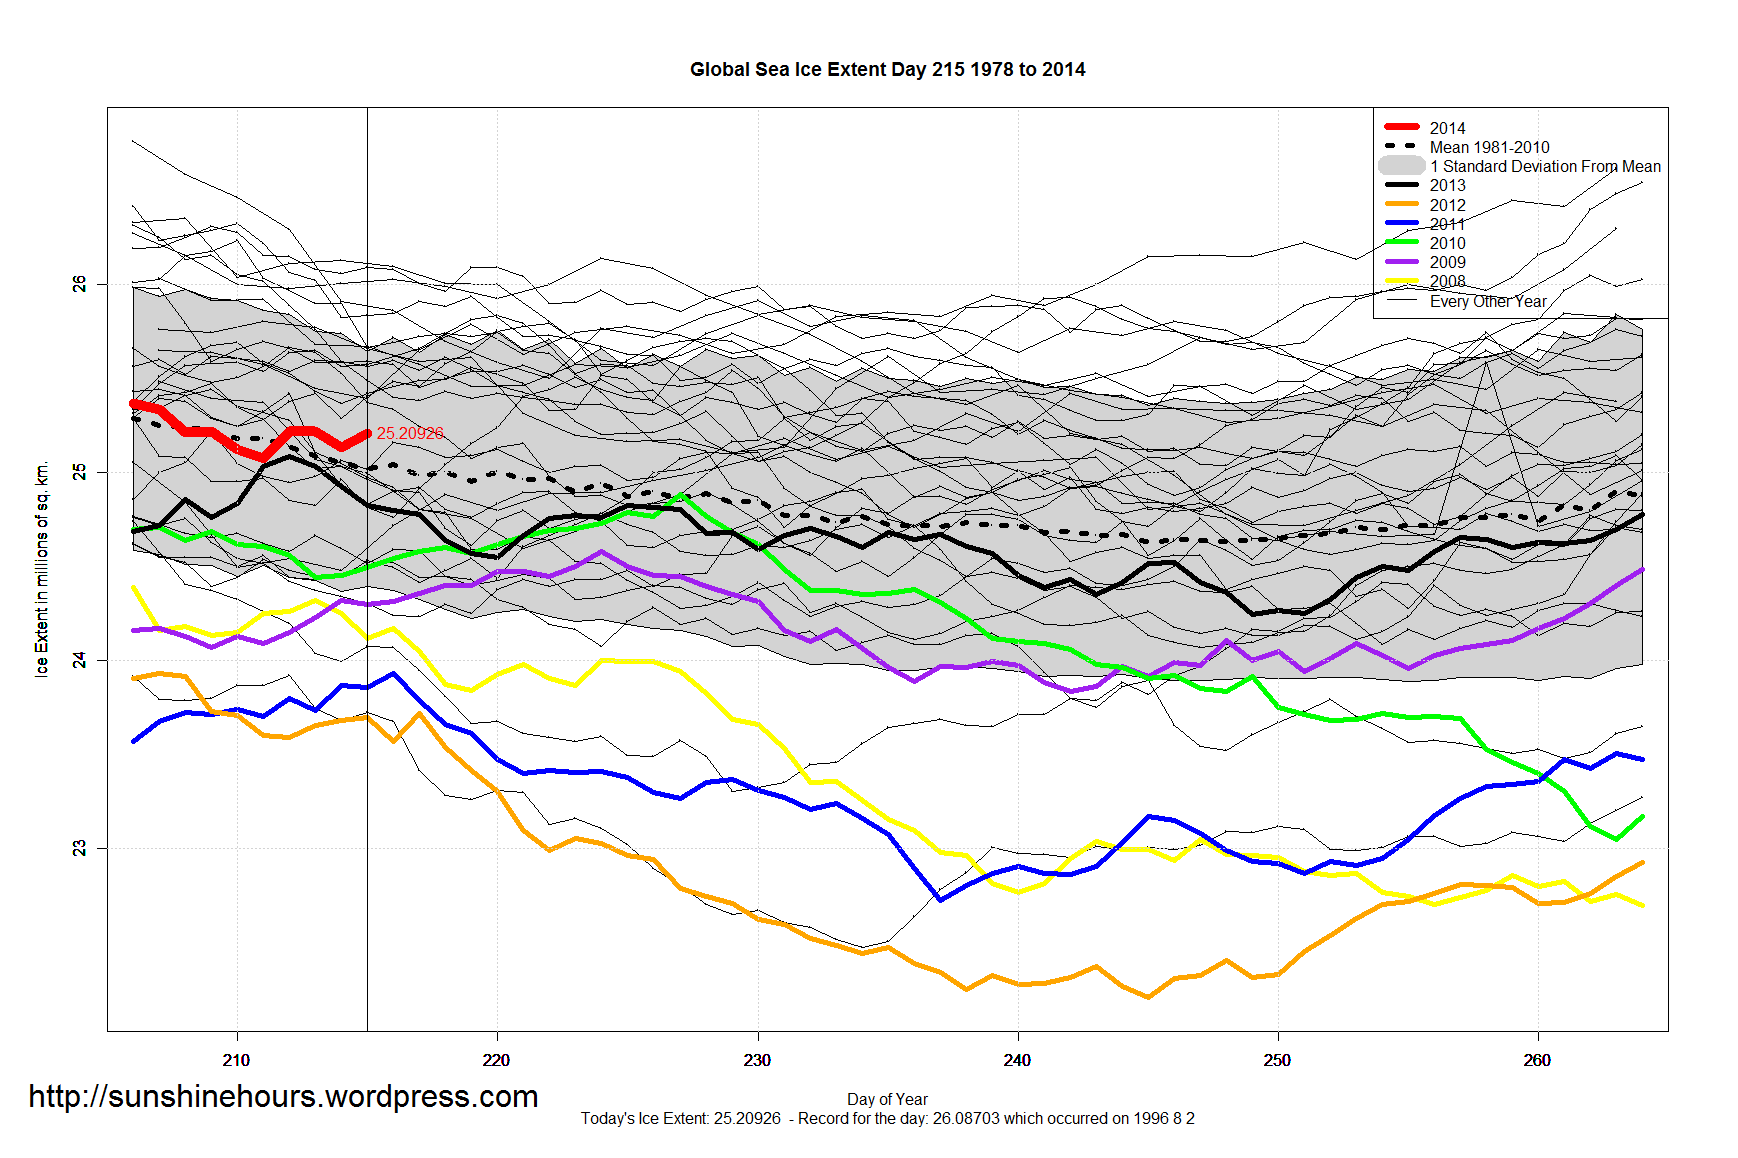
Thanks to an amazing rise in Antarctica, Global Sea Ice Extent is 305,000 sq km above the 1981-2010 mean.
It is the highest for this day since 2000.

Arctic Sea Ice Extent is -1,097,000 sq km below the 1981-2010 mean.

Global Sea Ice Extent is 135,000 sq km above the 1981-2010 mean.
Today’s global sea ice extent is the 2nd highest for this day from 2001 – 2014. 2004 was 200,000 sq km higher.
There have been no global daily records set in 2014. But there have been 72 in the top 5.
 Year First Second Third Fourth Fifth Top 5
2014    0     0      14    37     21    72
UPDATE: Antarctic and Arctic has been published. MASIE is still one day behind.
There have been no updates to NSIDC/NOAA Antarctic Sea Ice Extent for three days. Arctic Data is late for today. And MASIE did update their data, but it is one day older than it should be.
Data is usually found here and here and here.
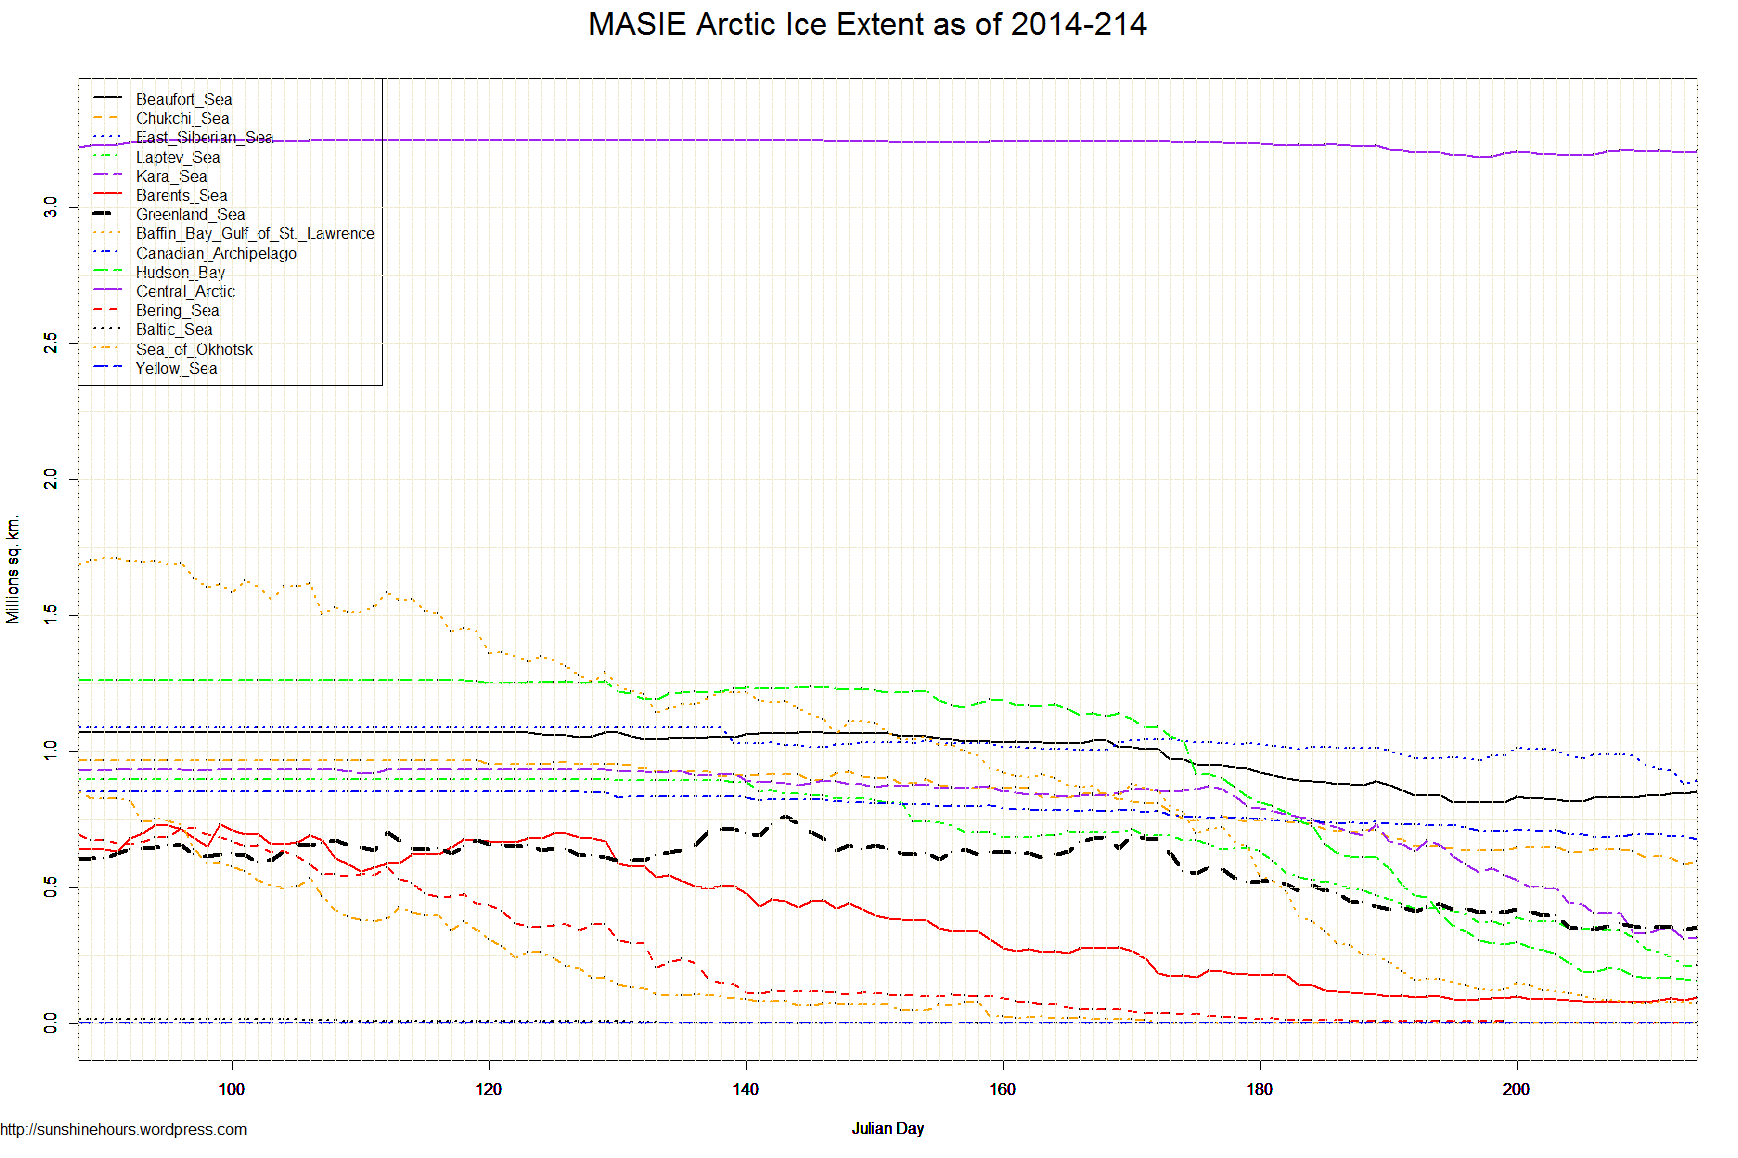
Aug 3 2014 MASIE Update – A Small Increase of 38,377 sq km Over Last Day After One Day of Large Melt
Data here. Click for bigger.
| Region | 127 days ago | End | Last 126 | Last 28 | Last 14 | Last 7 | Last 3 | Last 1 |
| Canadian Archipelago | 853,214 | 678,222 | -174,993 | -59,056 | -31,964 | -5,453 | -16,651 | -11,752 |
| Hudson Bay | 1,260,903 | 154,868 | -1,106,035 | -470,827 | -142,216 | -46,767 | -10,511 | -9,423 |
| Baffin Bay Gulf of St. Lawrence | 1,688,530 | 72,548 | -1,615,982 | -222,026 | -74,009 | -12,198 | -3,903 | -5,166 |
| Bering Sea | 697,324 | 0 | -697,324 | -13,405 | -787 | -15 | 0 | 0 |
| Baltic Sea | 15,337 | 0 | -15,337 | 0 | 0 | 0 | 0 | 0 |
| Sea of Okhotsk | 853,240 | 0 | -853,240 | 0 | 0 | 0 | 0 | 0 |
| Yellow Sea | 0 | 0 | 0 | 0 | 0 | 0 | 0 | 0 |
| Laptev Sea | 897,845 | 213,039 | -684,806 | -299,328 | -177,916 | -128,045 | -48,350 | 1,065 |
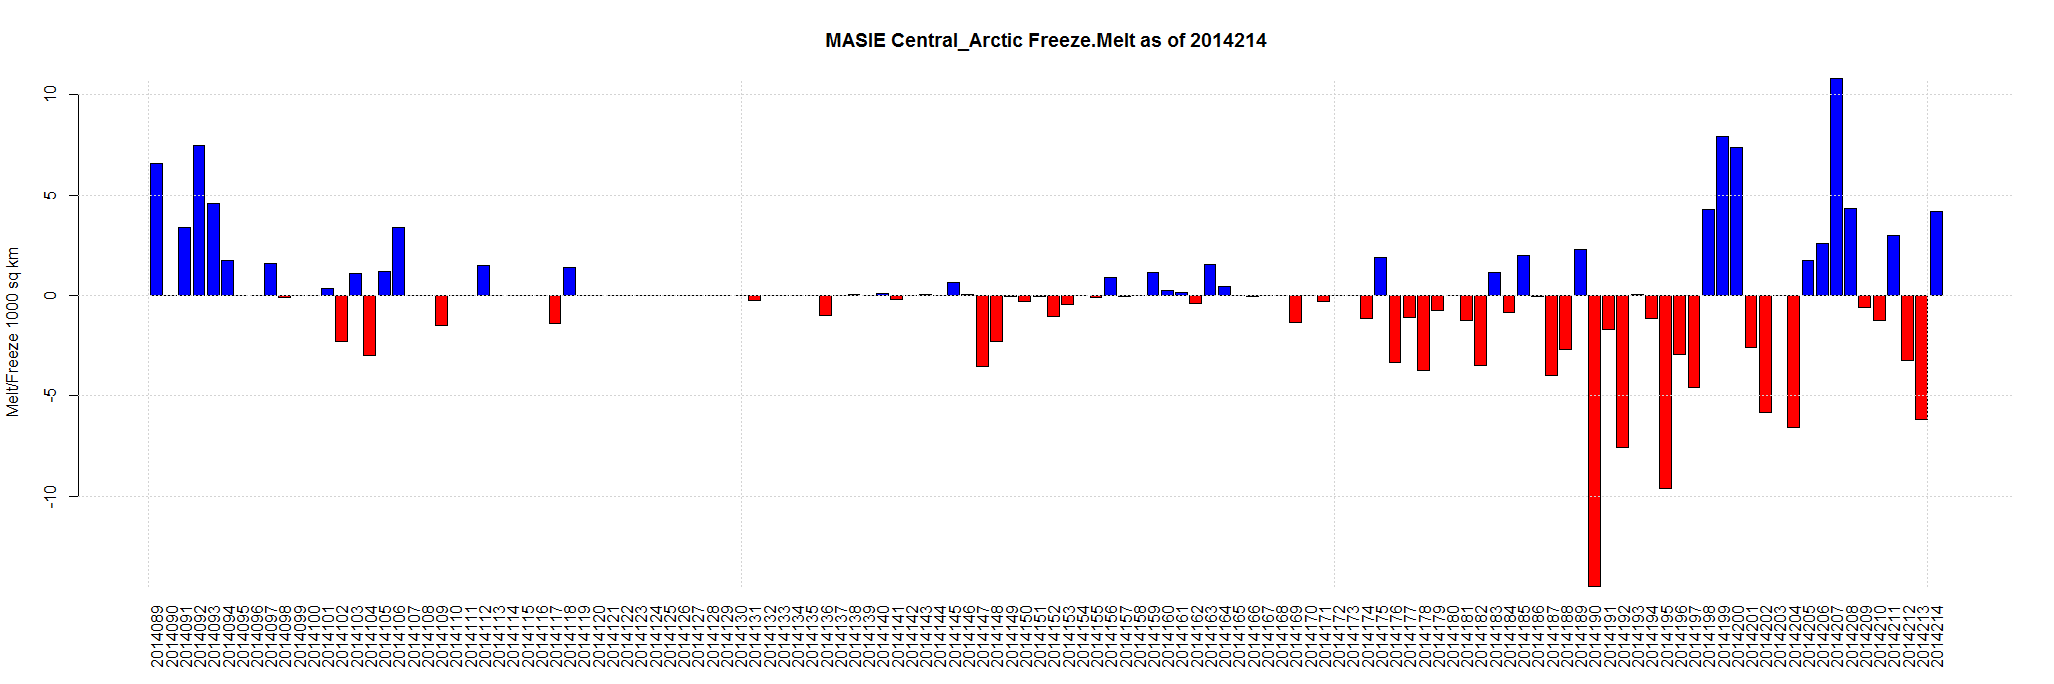
| Central Arctic | 3,221,921 | 3,204,988 | -16,933 | -26,471 | 335 | 213 | -5,250 | 4,155 |
| Kara Sea | 933,859 | 316,087 | -617,772 | -405,670 | -211,854 | -88,561 | -32,050 | 5,956 |
| Beaufort Sea | 1,070,445 | 853,649 | -216,796 | -26,044 | 17,008 | 21,899 | 15,406 | 6,230 |
| Barents Sea | 645,917 | 94,618 | -551,299 | -22,313 | -4,471 | 14,771 | 10,681 | 8,820 |
| Greenland Sea | 603,416 | 352,030 | -251,385 | -128,335 | -67,740 | -4,757 | -4,791 | 10,542 |
| Chukchi Sea | 966,006 | 595,526 | -370,480 | -109,807 | -53,034 | -46,281 | -17,421 | 11,210 |
| East Siberian Sea | 1,087,137 | 895,505 | -191,632 | -117,524 | -117,504 | -95,415 | -39,689 | 16,740 |
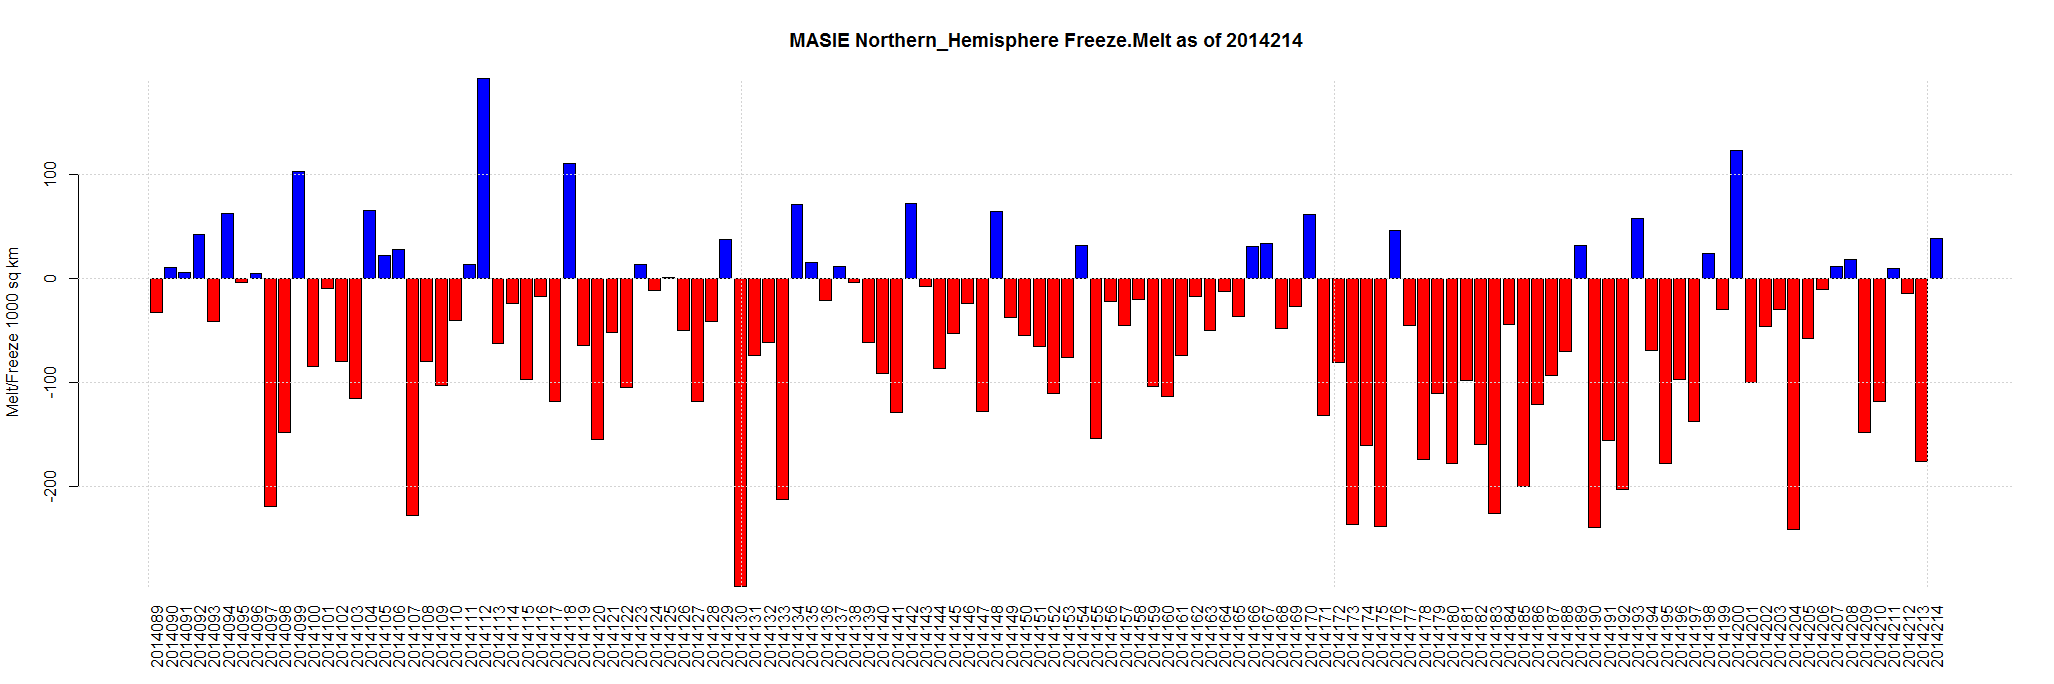
| Northern Hemisphere (Total) | 14,805,115 | 7,432,223 | -7,372,892 | -1,901,176 | -864,149 | -390,610 | -152,529 | 38,377 |
| NH (Average Loss per Day) | -58,054 | -67,899 | -61,725 | -55,801 | -50,843 | 38,377 |
(NOTE: Antarctic data has not been updated for 2 days. So I cannot post the Antarctic or Global update)
Arctic Sea Ice Extent is -1.1 million sq km below the 1981-201 mean. It is higher than it was in 2007, 2010, 2011, 2012 and 2013.
Aug 1 2014 MASIE Update – A Tiny Melt After a Tiny Freeze
Data here. Click for bigger.

| Region | 125 days ago | End | Last 124 | Last 28 | Last 14 | Last 7 | Last 3 | Last 1 |
| Laptev Sea | 897,845 | 247,621 | -650,224 | -277,930 | -126,952 | -98,950 | -67,618 | -13,768 |
| Chukchi Sea | 966,006 | 607,114 | -358,893 | -128,343 | -31,108 | -21,454 | -26,346 | -5,833 |
| East Siberian Sea | 1,087,137 | 929,618 | -157,520 | -84,380 | -55,246 | -46,393 | -57,488 | -5,577 |
| Canadian Archipelago | 853,214 | 689,829 | -163,385 | -56,733 | -15,813 | -4,647 | -5,214 | -5,044 |
| Greenland Sea | 603,416 | 352,537 | -250,879 | -154,607 | -57,742 | 1,878 | -4,771 | -4,284 |
| Central Arctic | 3,221,921 | 3,207,011 | -14,910 | -22,494 | 17,639 | 15,641 | -1,496 | -3,227 |
| Bering Sea | 697,324 | 0 | -697,324 | -12,503 | -7,345 | -15 | -15 | 0 |
| Baltic Sea | 15,337 | 0 | -15,337 | 0 | 0 | 0 | 0 | 0 |
| Sea of Okhotsk | 853,240 | 0 | -853,240 | 0 | 0 | 0 | 0 | 0 |
| Yellow Sea | 0 | 0 | 0 | 0 | 0 | 0 | 0 | 0 |
| Baffin Bay Gulf of St. Lawrence | 1,688,530 | 76,967 | -1,611,563 | -297,142 | -45,383 | -26,272 | 1,116 | 516 |
| Kara Sea | 933,859 | 349,954 | -583,906 | -401,937 | -219,670 | -88,187 | 13,883 | 1,817 |
| Hudson Bay | 1,260,903 | 169,271 | -1,091,632 | -556,349 | -124,336 | -21,890 | -3,460 | 3,892 |
| Barents Sea | 645,917 | 92,367 | -553,550 | -48,112 | -399 | 10,122 | 15,240 | 8,430 |
| Beaufort Sea | 1,070,445 | 846,933 | -223,512 | -42,622 | 34,421 | 29,185 | 13,772 | 8,689 |
| Northern Hemisphere (Total) | 14,805,115 | 7,570,363 | -7,234,752 | -2,083,522 | -631,934 | -250,981 | -122,396 | -14,389 |
| NH (Average Loss per Day) | -57,878 | -74,412 | -45,138 | -35,854 | -40,799 | -14,389 |
Global Sea Ice Extent is 33,000 sq km above the 1981-2010 mean.

