Words of the Day: “Bird Vaporization” and “Streamers”

The title of this post is not one I ever expected to write … even when I write a post mocking the evil greenies.

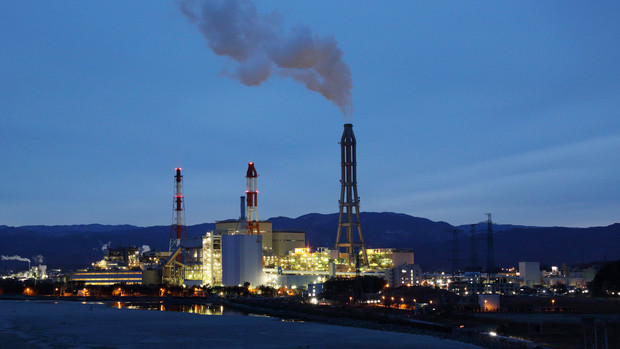
“Investigators from the National Fish and Wildlife Forensics Laboratory, in a report kept confidential until this week, describe the power towers as a “mega trap” that claims layers of species in the same food chain. The lab is part of the U.S. Fish and Wildlife Service.

“There were hundreds upon hundreds of butterflies (including monarchs, Danaus plexippus) and dragonfly carcasses,” the investigators said. “Some showed singeing, and many appeared to have just fallen from the sky. … Birds were also observed feeding on the insects. At times birds flew into the solar flux and ignited.””

Forensics lab staff observed a falcon or falcon-like bird with a plume of smoke streaming from its tail as it passed through the heat zone. The bird lost stability and descended, but the team could not locate it. The investigators could not identify many burning objects, which they call streamers.

“We observed many streamer events,” the report said. “It is claimed that these events represent the combustion of loose debris, or insects. Although some of the events are likely that, there were instances in which the amount of smoke produced by the ignition could only be explained by a larger flammable biomass such as a bird. Indeed, OLE (office of law enforcement) staff observed birds entering the solar flux and igniting, consequently becoming a streamer.

OLE staff observed an average of one streamer event every two minutes.

Read the rest … if you can.

http://www.pe.com/local-news/topics/topics-environment-headlines/20140408-solar-ivanpah-project-described-as-deadly-trap-for-wildlife.ece

(h/t Master Resource Blog)


Embed from Getty Images

Sweden: Coal To Play Important Role In Future

Thanks to anti-fracking activities in Europe by environmentalists, the only plentiful fuel available cheap enough to use against Putin’s control is Coal.

I’ve mentioned Poland and Germany and Japan. Now it is Sweden’s turn.

“In the wake of the Ukraine crisis and Germany’s nuclear shutdown, Swedish-state-owned Vattenfall is supplying even more energy from coal. Vattenfal’s chief executive officer told Swedish public television that coal power will have an important role to play in the future.

The state-owned power company, which runs Sweden’s hydro and nuclear plants, had its annual general meeting on Monday. Despite getting badly burned by buying the now-devalued Dutch company Nuon, Vattenfall has plans to buy up even more foreign coal companies.

The Swedish state is the owner of Vattenfall. The government’s representative at the meeting says that, despite setting a goal of reducing carbon emissions, the government has no objection to Vattenfall investing in coal, and leaves such decisions to the company board.”

http://www.thegwpf.org/sweden-coal-to-play-important-role-in-future/

If Europe had jumped into fracking as soon as possible, the natural gas would have been coming on stream by now and they could be replacing coal with cleaner, lower CO2 gas. But Europe bet the farm on wind and solar. Idiots.

Embed from Getty Images

The Streak – 1933/1934 and 2011/2012

The Hockey Schtick blog brought a recent paper to my attention.

The abstract says:

A recent observation in NOAA’s National Climatic Data Center’s monthly assessment of the state of the climate was that contiguous US average monthly temperatures were in the top third of monthly ranked historical temperatures for thirteen straight months from June 2011 — June 2012. The chance of such a streak occurring randomly was quoted as (1/3)13, or about one in 1.6 million.”

I’m not going to discuss the “chances”. But I am going to simply note the following.

The NOAA ranks months temperature and precipitation based on the number of months from 1895. So 2012 was the 118th year. If a month is ranked 118 (as of 2012) then it was the warmest month from 1895 to 2012.

Using the same 12 month June to June time frame and using data from October 2012 ( before NOAA’s recent update) it took me about 10 minutes to find out a similar streak.

From June 1933 to to June 1934 8 months were ranked 100 and above. 2 of them were ranked 118.

From June 2011 to June 2012 8 months were ranked 100 and above. 1 of them was ranked 118.


year Month Rank
1933 6 118
1933 7 104
1933 9 116
1933 12 115
1934 1 114
1934 4 107
1934 5 118
1934 6 108


year Month Rank
2011 7 114
2011 8 117
2012 1 115
2012 2 104
2012 3 118
2012 4 116
2012 5 117
2012 6 107

What are the odds of that occurring 80 years apart!


Japan Chooses Coal Over Renewable Energy

Japan isn’t as dumb as Environmentalists hoped. After working hard to shutdown Japans nuclear power because of the earthquake/tidal wave, Japan is choosing coal instead of renewables.

“Prime Minister Shinzo Abe is pushing Japan’s coal industry to expand sales at home and abroad, undermining hopes among environmentalists that he’d use the Fukushima nuclear accident to switch the nation to renewables.

A new energy plan approved by Japan’s cabinet on April 11 designates coal an important long-term electricity source while falling short of setting specific targets for cleaner energy from wind, solar and geothermal. The policy also gives nuclear power the same prominence as coal in Japan’s energy strategy.”

“Before the accident, Japan got 62 percent of its electricity from fossil fuels, and nuclear made up about a third, according to government figures. Since then, utilities reverted to fossil fuels such as liquefied natural gas and coal to replace nuclear capacity taken offline. Those thermal power sources generated about 90 percent of Japan’s electricity in fiscal 2012, according to figures in the energy plan.”

http://www.bloomberg.com/news/2014-04-13/post-fukushima-japan-chooses-coal-over-renewable-energy.html

japan_nuclear

Japan Will Encourage Coal Use In Eastern Europe

Thanks to anti-fracking activities in Europe by environmentalists, the only plentiful fuel available cheap enough to use against Putin’s control is Coal.

“The government plans to support Ukraine and other Eastern European nations in the construction of next-generation coal-fired power plants that can generate power with less fuel, according to informed sources.

Under the initiative, Japan would stand behind the nations’ efforts to use coal—abundant in Eastern Europe—instead of natural gas, the supply of which makes them dependent on Russia. The government is expected to announce the initiative at the meeting of energy ministers from Japan and other Group of Seven industrialized nations to be held in Rome from May 5.

Japan’s support will involve the construction of coal-fired power plants using technologies known as supercritical steam pressure and ultra supercritical pressure to spin the turbines, enabling these nations to obtain electricity while using less fuel and emitting less carbon dioxide.”

http://the-japan-news.com/news/article/0001241034

Embed from Getty Images

Other Than Germany … COAL!

Poland is suggesting that coal make a big comeback in the European Union in order to thwart Putin’s use of Natural Gas as a weapon.

“Polish Prime Minister Donald Tusk says the country’s giant coal fields should become a cornerstone in Europe’s defense against a newly aggressive Russia.”

(Too bad the EU has fought against fracking to the point of insanity)

But the sentence that jumped out at me is

Poland burns over 50 million tons of coal a year, more than any European nation other than Germany, “

Wait! I thought Germany was the poster boy for green energy!

Yes indeed. BP Statistical Review of World Energy says Germany burned more coal than any other European nation and it burned 3.9% more coal in 2012 than it did in 2011.

Why? The shutdown of some of its nuclear power plants.

Country 2012 Change
Austria 2.0 -23.8%
Azerbaijan ^ 3.8%
Belarus ^ 1.2%
Belgium 3.0 -9.5%
Bulgaria 7.0 -13.4%
Czech Republic 16.6 -7.8%
Denmark 2.5 -23.4%
Finland 2.9 -15.1%
France 11.4 20.1%
Germany 79.2 3.9%
Greece 7.5 -0.5%
Hungary 3.0 -1.9%
Republic of Ireland 1.5 16.9%
Italy 16.2 0.3%
Kazakhstan 35.0 2.6%
Lithuania 0.2 -5.5%
Netherlands 8.5 8.2%
Norway 0.7 -0.5%
Poland 54.0 -4.0%
Portugal 2.9 31.4%
Romania 6.7 -9.5%
Slovakia 3.2 -3.5%
Spain 19.3 24.2%
Sweden 1.5 -25.7%
Switzerland 0.1 6.5%
Turkey 31.3 -5.6%
Turkmenistan
Ukraine 44.6 6.9%
United Kingdom 39.1 24.0%
Uzbekistan 1.2 -0.3%
Other Europe & Eurasia 22.2 -1.7%


“It’s not the oil that’s dirty, it’s the politics. “

If oil is moving around North America, the best way to do it is via pipeline, not via railroads (which is happening). The latest delay in Keystone XL is disgusting.


“Republicans are denouncing President Obama’s latest delay on the Keystone XL pipeline, six long years after it was proposed. But for cold political fury they have nothing on Terry O’Sullivan, who runs the Laborers’ International Union that represents a half-million construction workers.

This is once again politics at its worst,” Mr. O’Sullivan said in a public statement that deserves to be quoted at length. “In another gutless move, the Administration is delaying a finding on whether the pipeline is in the national interest based on months-old litigation in Nebraska regarding a state level challenge to a state process—and which has nothing to with the national interest. They waited until Good Friday, believing no one would be paying attention. The only surprise is they didn’t wait to do it in the dark of night.

It’s not the oil that’s dirty, it’s the politics. Once again, the Administration is making a political calculation instead of doing what is right for the country. This certainly is no example of profiles in courage. It’s clear the Administration needs to grow a set of antlers, or perhaps take a lesson from Popeye and eat some spinach.

“This is another low blow to the working men and women of our country for whom the Keystone XL Pipeline is a lifeline to good jobs and energy security.”

The pipeline is expected to create some 2,000 new jobs from construction and thousands more related to the project. Many of those jobs would go to Mr. O’Sullivan’s union members, who do not live on San Francisco’s Pacific Heights like billionaire donor Tom Steyer who opposes Keystone.”


We don’t want this:


Could Climate Change Have Caused the Polar Vortex?

According to Time Magazine: “Climate change skeptics are pointing to the record cold weather as evidence that the globe isn’t warming. But it could be that melting Arctic ice is making sudden cold snaps more likely—not less

Do you want to see what a cold snap really looks like according to the NOAA?

February 1936 – Coldest Month in USA History (click on the image for the full effect)

cag_[ Statewide Temperature Anomalies (Feb 1936) ]


In 2014, Feb was -1.69°F below the 1901-2000 average. In February 1936 the USA was -8.59°F below average. Big difference.

NOAA_Feb_1936_Lower_48


In North Dakota, February 1936 was 26.0°F below the 1901-2000 average. The whole month averaged -14.1°F below 0.

NOAA_Feb_1936_North_Dakota

In comparison, lets take a look at Feb 2014:

cag_[ Statewide Temperature Anomalies (Feb 2014) ]

USA March 1910 versus March 2014 (according to the NOAA)

March 1910 (Before Global Warming) 7.94°F Above the 1901-2000 Average

cag_[ Divisional Temperature Anomalies (Mar 1910) ]


Some of those divisions are 16F above normal.

March 2014 (After Global Warming)  -0.99°F Below the 1901-2000 Average

cag_[ Divisional Temperature Anomalies (Mar 2014) ]

http://gis.ncdc.noaa.gov/map/cag/#app=cdo

PS I just randomly picked 1934 without checking. And then I noticed 1910 … but I’ll post the 1934 map so it doesn’t go to waste.

March 1934 (Before Global Warming) 1.28°F Above the 1901-2000 Average

cag_[ Divisional Temperature Anomalies (Mar 1934) ]


Could CO2 have lowered the rate of natural warming in the oceans?

As a minor followup to my post “Could CO2 have lowered the rate of natural warming?” lets consider ocean warming.

From 1900 to 1945 oceans were warming at a rate of  0.0116188C per year.

After 1945 oceans were warming at a rate of 0.00654978C per year.

Which means the massive 1945 increase in CO2 after 1945 slowed the  rate of ocean warming by 0.00506902C per year. Which is a drop off 44%.

Could_CO2_SST

Woodfortrees Url is here.