The NOAA says September 2013 was the 6th warmest September in the USA.
2013 was behind 1998, 1931, 1933 , 2005 , 1990 and just edged out 1939 and 1922.

The NOAA says September 2013 was the 6th warmest September in the USA.
2013 was behind 1998, 1931, 1933 , 2005 , 1990 and just edged out 1939 and 1922.
There were no NSIDC sea ice updates today. I emailed NSIDC to ask why and got this prompt and polite reply.
“Thank you for contacting the National Snow and Ice Data Center.Because our data provider, the National Oceanic and Atmospheric Administration (NOAA), has shut down the data stream as part of the government shutdown, we are temporarily unable to update the product.
I apologize for the inconvenience.
Best regards,
xxxxxxxx xxxxxxxxxx
NSIDC User Services”
According to the NOAA August 2013 was the 92nd warmest out of 119. That means only 28 were warmer.
These are the 28: 1901,1913,1934,1936,1937,1938,1943,1947,1955,1958,1959,1969,1970,1983,1984,1988,1995,1998,2000,2001,2003,2005,2006,2007,2010,2011,2012
It was cool in the east though. The numbers below are the rank out of 119.
So North Carolina (for example) was 13th warmest out of 119. Which means 107 Augusts in NC were warmer.
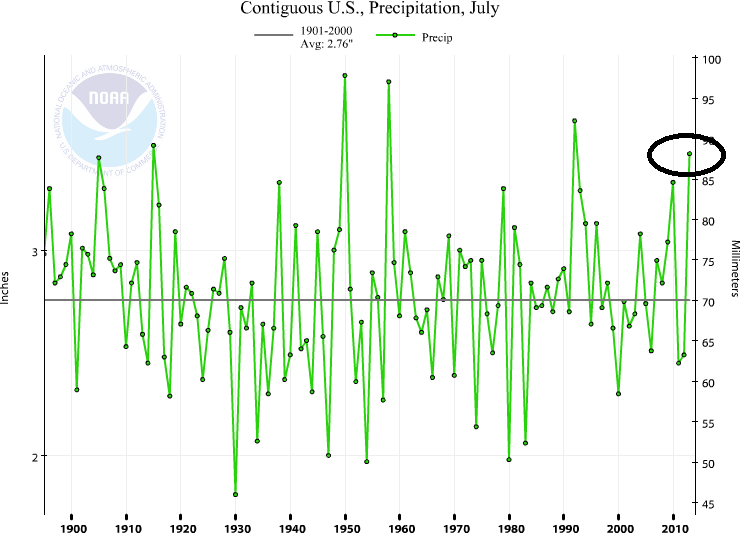
With all the claims about 2012 being the worst drought in USA history (total joke), I thought I would mention that July 2013 was the 5th wettest July ever according to the NOAA.
Only 1950, 1958, 1992 and 1915 were wetter. July 2013 was .71 inches above the 1901 – 2000 average. July 1930 was the driest.
The 1895 to 2013 trend for precipitation in July is 0. Flat. No trend at all. Perfectly average.
Year To Date precipitation for 2013 is 23rd wettest. 1.54″ above the long term average.
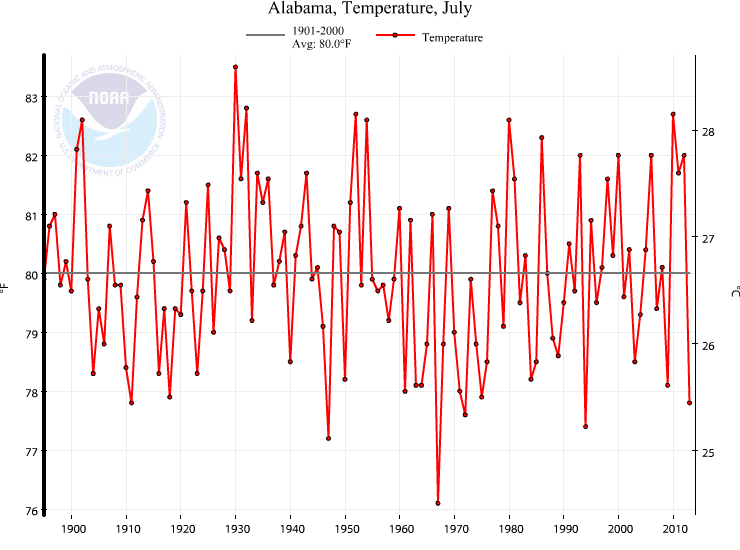
Alabama had the 5th coldest July since 1895 according to the NOAA.
July 2013 in Alabama was tied for 5th coldest with 1911.
Only 4 July’s were colder. 1967,1947,1994 and 1972. The two warmest July’s were 1930 and 1932.
Even with all the manipulation of NOAA data to cool the past and warm the present, there were 29 July’s warmer than July 2013 in the USA according to the NOAA.
These July’s were warmer than July 2013.
1901,1917,1921,1930,1931,1933,1934,1935,1936,1937,1939,1954,1955,1964,1966,1977,1980,1988,1998,1999,2001,2002,2003,2005,2006,2007,2010,2011,2012
1936 was the 2nd warmest. 1934 was the 4th warmest. And 1901 was the 6th warmest. According to the NOAA. I suspect 1936 was really the warmest, but NOAA data says otherwise today.
The USA population (along with UHI) has risen from 128 million in 1936 to 319 million.
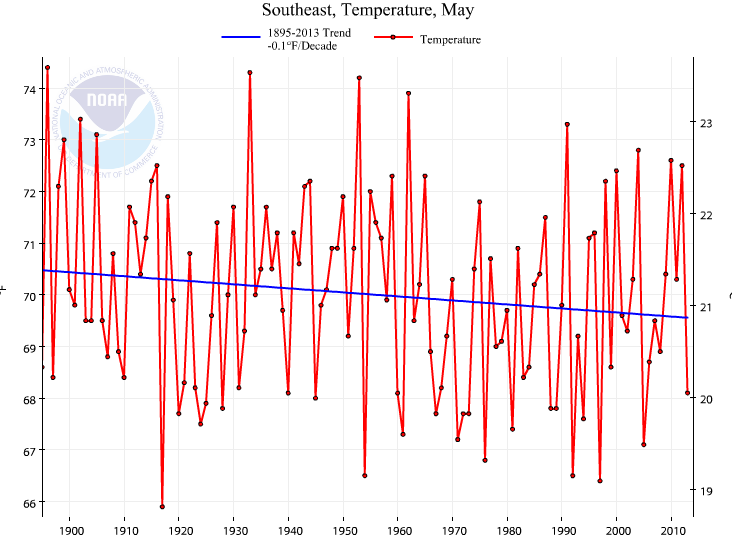
Just a reminder for those AGW cult members. According to the NOAA, May in the Southeast USA has been cooling at -0.1F/decade since 1895.
The Southeast states were cold in May 2013 according to the NOAA. Florida had the 11th coldest May in its history. Which means 108 were warmer.
Georgia had its 12th coldest, Louisiana 13th, South Carolina 14th and Alabama 15th.
Brrr.
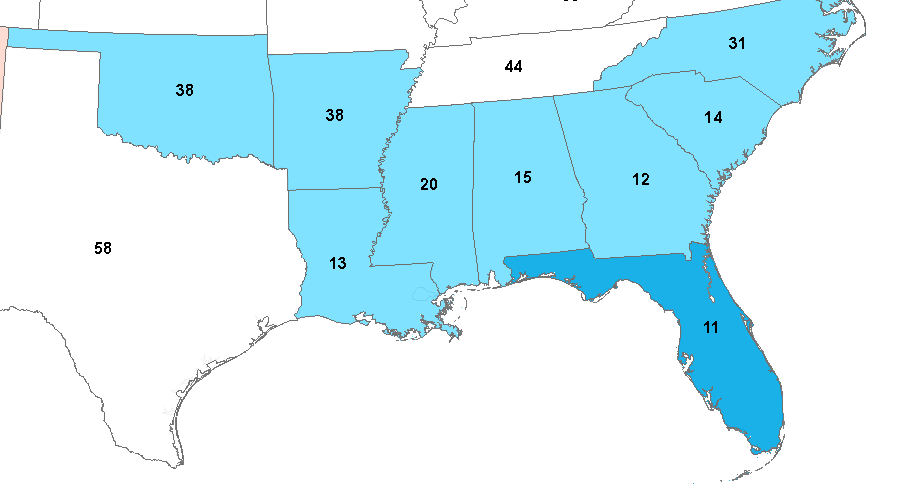
None of the states were ranked higher than 99 out of 119. Which means only California snuck into the top 20 warmest May’s.
Rank: (1=Coldest & 119 = Warmest)
| State | May_2013 | May Rank | Coldest May | Coldest May F |
| Florida | 73.9 | 11 | 1940 | 72.5 |
| Georgia | 68.6 | 12 | 1997 | 66.8 |
| Louisiana | 71.4 | 13 | 1917 | 69.2 |
| South Carolina | 67.6 | 14 | 1997 | 65.8 |
| Alabama | 68.3 | 15 | 1976 | 65.2 |
| Mississippi | 69.2 | 20 | 1976 | 66 |
| North Carolina | 65.2 | 31 | 1917 | 62.1 |
| Arkansas | 67.4 | 38 | 1917 | 63.2 |
| Oklahoma | 66.9 | 38 | 1907 | 61.5 |
| Minnesota | 53.1 | 44 | 1907 | 44.3 |
| Tennessee | 65.2 | 44 | 1917 | 60.2 |
| Virginia | 62.6 | 44 | 1917 | 58.4 |
| Missouri | 63.5 | 50 | 1924 | 58 |
| Missouri | 63.5 | 50 | 1917 | 58 |
| West Virginia | 60.4 | 55 | 1997 | 54.3 |
| Iowa | 59.2 | 56 | 1907 | 52.7 |
| Nebraska | 58.4 | 57 | 1935 | 51.8 |
| North Dakota | 53.2 | 57 | 1907 | 43.3 |
| Kansas | 63.2 | 58 | 1917 | 56.7 |
| South Dakota | 55.7 | 58 | 1907 | 47.9 |
| Texas | 72.5 | 58 | 1907 | 67.3 |
| Kentucky | 64.6 | 59 | 1917 | 58.1 |
| Wisconsin | 55 | 61 | 1907 | 46.9 |
| New Jersey | 60.6 | 63 | 1917 | 53.5 |
| Maryland | 62.6 | 68 | 1967 | 56.5 |
| Maryland | 62.6 | 68 | 1917 | 56.5 |
| Colorado | 53.2 | 70 | 1917 | 45.4 |
| Pennsylvania | 59.1 | 72 | 1967 | 51 |
| Illinois | 63.7 | 75 | 1917 | 55.9 |
| Nevada | 56.7 | 75 | 1896 | 47 |
| Utah | 56.8 | 75 | 1917 | 49.1 |
| Connecticut | 58.3 | 76 | 1917 | 49.8 |
| Maine | 52.5 | 80 | 1967 | 44.3 |
| Michigan | 55.9 | 80 | 1907 | 44.7 |
| Montana | 52.9 | 80 | 1916 | 46.4 |
| Montana | 52.9 | 80 | 1927 | 46.4 |
| New Hampshire | 55.2 | 82 | 1917 | 45 |
| New Mexico | 61.6 | 83 | 1917 | 52.4 |
| Massachusetts | 57.6 | 84 | 1917 | 48.8 |
| Oregon | 54.2 | 84 | 1933 | 47.9 |
| Wyoming | 51.5 | 85 | 1917 | 43.2 |
| Delaware | 64.3 | 87 | 1917 | 56.2 |
| Idaho | 53.1 | 88 | 1896 | 45.5 |
| Arizona | 67.8 | 90 | 1917 | 58.6 |
| Rhode Island | 57.8 | 90 | 1917 | 48.1 |
| Vermont | 55.8 | 90 | 1917 | 44.8 |
| Washington | 55.5 | 91 | 1955 | 49.4 |
| New York | 57.4 | 93 | 1917 | 46.9 |
| Indiana | 64.4 | 94 | 1917 | 54.7 |
| Ohio | 63.1 | 95 | 1917 | 53.4 |
| California | 65.3 | 99 | 1933 | 56.1 |
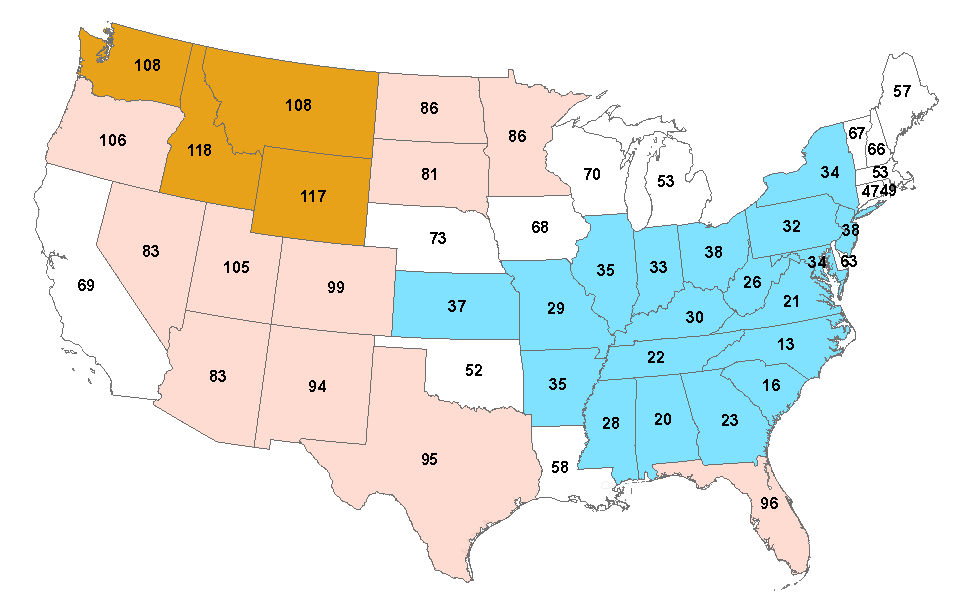
What a brutal Spring. in the USA according to the NOAA.
Look at all those single digit rankings. Rank: (1 = Coldest and 119 = Warmest)
3rd coldest Spring out of 119 in Minnesota.
4th coldest in North and South Dakota. 5th coldest in Arkansas.
This should not be possible if AGW was real.
| State | Spring_2013 | Spring Rank | Coldest Spring | Coldest Spring F |
| Minnesota | 35.9 | 3 | 1950 | 34.43 |
| North Dakota | 33.83 | 4 | 1899 | 31.33 |
| South Carolina | 59.3 | 4 | 1960 | 58.87 |
| Arkansas | 57.33 | 5 | 1960 | 56.47 |
| Alabama | 60.1 | 6 | 1960 | 59.07 |
| Georgia | 60.67 | 6 | 1960 | 59.77 |
| Mississippi | 60.53 | 6 | 1960 | 59.97 |
| Iowa | 43.87 | 7 | 1960 | 42.83 |
| Louisiana | 63.7 | 7 | 1931 | 61.9 |
| Missouri | 51.17 | 7 | 1960 | 49.77 |
| North Carolina | 55.93 | 7 | 1960 | 54.9 |
| Tennessee | 54.9 | 8 | 1960 | 52.93 |
| South Dakota | 40.23 | 9 | 1950 | 37.6 |
| Wisconsin | 38.8 | 9 | 1950 | 37.3 |
| Oklahoma | 56.27 | 11 | 1924 | 54.3 |
| Kansas | 50.5 | 12 | 1924 | 48.3 |
| Florida | 68.1 | 13 | 1931 | 66.4 |
| Kentucky | 52.8 | 14 | 1960 | 50.53 |
| Nebraska | 44.9 | 16 | 1917 | 42.97 |
| Illinois | 49.17 | 19 | 1960 | 46.6 |
| Virginia | 53.03 | 34 | 1960 | 51.03 |
| West Virginia | 49.87 | 34 | 1960 | 46.8 |
| Michigan | 40.97 | 39 | 1950 | 37.6 |
| Michigan | 40.97 | 39 | 1940 | 37.6 |
| Indiana | 50.03 | 40 | 1960 | 46.53 |
| Texas | 64.2 | 40 | 1931 | 60.13 |
| Colorado | 42.73 | 42 | 1917 | 37.23 |
| Montana | 40.57 | 45 | 1917 | 35.5 |
| Maryland | 51.77 | 50 | 1940 | 48.63 |
| Wyoming | 39.67 | 57 | 1917 | 32.37 |
| Ohio | 49.5 | 58 | 1926 | 45.07 |
| Pennsylvania | 47.47 | 62 | 1984 | 43.57 |
| New Jersey | 50.3 | 63 | 1940 | 46.27 |
| Connecticut | 47.1 | 71 | 1967 | 42.13 |
| New York | 43.83 | 75 | 1926 | 38.57 |
| Delaware | 53.33 | 76 | 1940 | 48.63 |
| Utah | 47.8 | 76 | 1917 | 39.47 |
| Massachusetts | 46.17 | 77 | 1967 | 40.97 |
| Washington | 48.07 | 82 | 1955 | 41.5 |
| Oregon | 47.4 | 83 | 1917 | 42 |
| Idaho | 43.97 | 85 | 1917 | 36.17 |
| Rhode Island | 47.5 | 85 | 1917 | 40.97 |
| New Mexico | 53.47 | 92 | 1917 | 47.53 |
| Maine | 40.83 | 93 | 1926 | 33.7 |
| Vermont | 42.67 | 94 | 1926 | 34.03 |
| Nevada | 49.93 | 97 | 1917 | 41.17 |
| New Hampshire | 43.43 | 98 | 1926 | 35.4 |
| Arizona | 60.87 | 108 | 1917 | 52.4 |
| California | 60.13 | 113 | 1917 | 52.37 |
The NOAA ranked May 2013 80th out of 119. Which means 39 other Mays were warmer.
Here they are: 1896,1897,1900,1902,1911,1914,1922,1928,1934,1936,1937,1939,1941,1944,1949,1955,1956,1958,1962,1964,1969,1970,1977,1985,1986,1987,1988,1991,1992,1996,1998,2000,2001,2003,2004,2006,2007,2009,2012
May of 2013 was 3.5F colder than 1934 and even 1.24F colder than 1896.
May in the USA has been cooling at -0.55F per decade.

