Above average precipitation in large parts of the USA for April 2016.
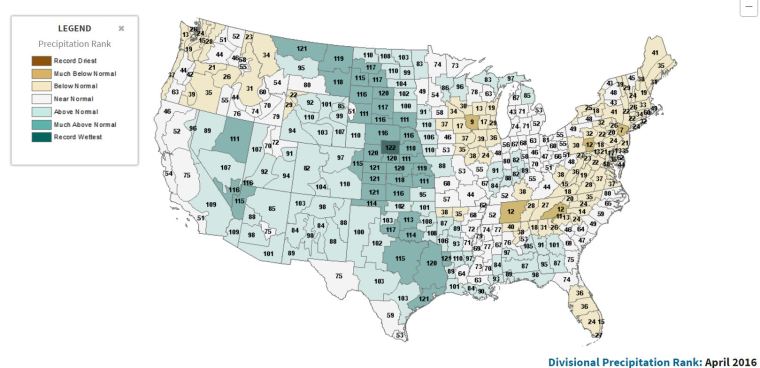
Above average precipitation in large parts of the USA for April 2016.
Remember when “drought was the new normal”?
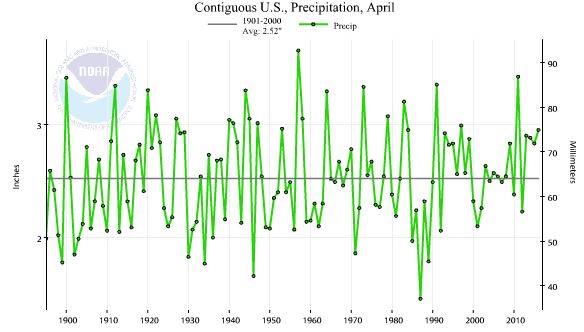
According to the NOAA the first two months of spring were 0.15″ above the 1901-2000 average. In other words … Normal!

Most of the country is normal. Northwest and southeast are wetter. Middle south is drier.
![cag_[ Statewide Precipitation Anomalies (accumulation between Mar 2014 and Apr 2014) ]](https://sunshinehours.net/wp-content/uploads/2014/05/cag_-statewide-precipitation-anomalies-accumulation-between-mar-2014-and-apr-2014.jpg)
I missed this when it came out last month, but according to the NOAA Precipitation for the 12 month period ending February 2014 was normal.
It was .19 inches above the 1901-2000 mean.
Wasn’t there supposed to be a permanent “Climate Change” drought?

Addendum: If you split the NOAA Climate History in two (March – February), these are the averages:
1895 – 1955 = 29.45 inches
1956 – 2014 = 30.44
One last one:
1980 – 2014 = 30.75 inches
Climate Change … bringer of slightly more precipitation.
Update: I had 2013 in the title. Sorry. (thanks justsoeguy31167)
According to the NOAA, California averaged 3.43 inches of rain in February 2014, which was only .42 inches below the 1901-2000 mean.
That is about 5.7X as much rain compared to January when California only averaged only .6 inches of rain.
One month of average rainfall won’t end a drought, but it sure helps.

Climate Change Caused a never ending drought In California … except for the never ending part.
“The storm – the largest since 2010”
“This is no drought-buster, but it’s a nice, fat down payment” in the water bank, he said.”
“As of Saturday evening, the storm had dropped more than 4 inches of rain in downtown Los Angeles, 5 inches in Van Nuys and almost 12 inches at Cogswell Dam in the Angeles National Forest, according to the National Weather Service.”
“Rainfall over the last month has helped facilitate the salmon’s return to their spawning grounds, said the local water district officials who track their numbers.”
“Ski resorts were delighted with fresh snow that promised to extend their season“
WAIT … I thought the end of snow was here because of climate change?
But my favorite quotation is: “The storm wasn’t all bad news, though.”
Bad News!!!!!!!!!!!! Rain in a drought is now BAD NEWS???????????
Why is rain bad news? Because it spoils the climate change con game. In a few weeks the AGW Cult will be complaining about too much rain and how climate change causes floods.
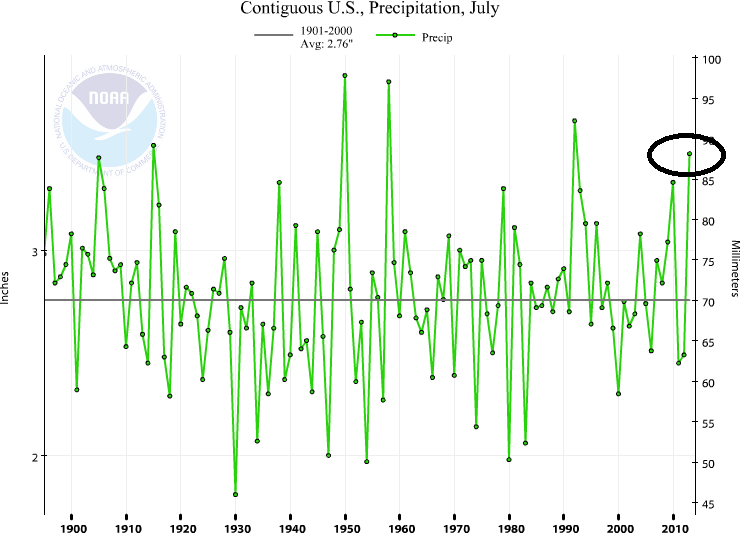
With all the claims about 2012 being the worst drought in USA history (total joke), I thought I would mention that July 2013 was the 5th wettest July ever according to the NOAA.
Only 1950, 1958, 1992 and 1915 were wetter. July 2013 was .71 inches above the 1901 – 2000 average. July 1930 was the driest.
The 1895 to 2013 trend for precipitation in July is 0. Flat. No trend at all. Perfectly average.
Year To Date precipitation for 2013 is 23rd wettest. 1.54″ above the long term average.
The data is from the monthly summaries put out by Environment Canada. The Normals are the station where the anomaly from the 1971-2000 average is calculated by EC.
Precipitation is in mm of rain equivalent. Some of it would be snow. About 25mm to the inch for the non-metric.
Boat Bluff’s 677mm is about 27 inches. In one month. Toronto had 328% of normal. Triple.
Top 10 Wettest Stations in Canada by % of Normal. (Only stations with EC Normals)
| Province | Station | Year | Month | Precipitation (mm) | Precipitation % of Normal |
| ONT | TORONTO | 2013 | 2 | 165.4 | 328 |
| SASK | LEROY | 2013 | 2 | 27 | 244 |
| ONT | TORONTO LESTER B. PEARSO | 2013 | 2 | 92 | 216 |
| SASK | QUAPPELLE 1 | 2013 | 2 | 25.1 | 212 |
| ONT | WROXETER | 2013 | 2 | 117.9 | 211 |
| QUE | GASPE A | 2013 | 2 | 121.8 | 206 |
| ONT | FOLDENS | 2013 | 2 | 98.4 | 192 |
| SASK | DUVAL | 2013 | 2 | 20.6 | 186 |
| NU | RANKIN INLET A | 2013 | 2 | 16.2 | 183 |
| NWT | FORT SIMPSON A | 2013 | 2 | 31.6 | 181 |
Top 10 Wettest Stations by amount of precipitation. Any station is eligible. NA means EC does not calculate normals.
| Province | Station | Year | Month | Precipitation (mm) | Precipitation % of Normal |
| BC | BOAT BLUFF | 2013 | 2 | 677.2 | 147 |
| BC | ZEBALLOS MURAUDE CREEK | 2013 | 2 | 473.9 | NA |
| BC | TOFINO A | 2013 | 2 | 469.6 | NA |
| BC | ESTEVAN POINT | 2013 | 2 | 430.8 | 125 |
| BC | PRINCE RUPERT MONT CIRC | 2013 | 2 | 430.7 | NA |
| BC | ADDENBROKE ISLAND | 2013 | 2 | 425.4 | NA |
| BC | LENNARD ISLAND | 2013 | 2 | 419.5 | 120 |
| BC | BELLA BELLA | 2013 | 2 | 396 | NA |
| BC | PORT ALICE | 2013 | 2 | 387.2 | 101 |
| BC | TAHSIS VILLAGE NORTH | 2013 | 2 | 370.5 | NA |
No state broke a record for driest October in 2012 according to the NOAA.
Texas came closest to a record with its 9th driest October at .83 inches. It will be hard to break the 1952 record of .02 inches.
New Mexico had very little rain during its 14th driest October. The record from 1952 was 0 so it can only be tied.
Delaware did break a record for wettest October ever.
15 states have 1952 as the driest October, 12 have 1963 and 6 are from 1924.
A rank of 1 = driest. A rank of 118 = wettest.
| State | Oct_2012 | Oct_ranked | Driest | Lowest_Rainfall | Wettest | Highest_Rainfall |
| Texas | 0.83 | 9 | 1952 | 0.02 | 1919 | 6.99 |
| New Mexico | 0.31 | 14 | 1952 | 0 | 1972 | 3.64 |
| Oklahoma | 1.28 | 20 | 1952 | 0.14 | 1941 | 11.32 |
| Colorado | 0.67 | 23 | 1952 | 0.07 | 1969 | 3.33 |
| Arizona | 0.31 | 25 | 1952 | 0 | 1972 | 5.19 |
| Kansas | 1.25 | 33 | 1952 | 0.02 | 1941 | 5.94 |
| Nebraska | 0.86 | 33 | 1933 | 0.07 | 2008 | 4.5 |
| Louisiana | 1.83 | 36 | 1952 | 0.03 | 2009 | 13.59 |
| South Carolina | 1.7 | 38 | 2000 | 0.01 | 1990 | 11.45 |
| Georgia | 1.89 | 43 | 1963 | 0.08 | 1994 | 8.24 |
| South Dakota | 0.9 | 43 | 1952 | 0.02 | 1998 | 5.42 |
| California | 0.75 | 47 | 1995 | 0.04 | 1962 | 4.44 |
| Wyoming | 0.87 | 49 | 1952 | 0.13 | 1998 | 2.47 |
| Florida | 3.24 | 51 | 2010 | 0.47 | 1924 | 9.56 |
| Utah | 0.85 | 51 | 1952 | 0 | 1972 | 3.4 |
| Nevada | 0.59 | 60 | 1952 | 0.01 | 2004 | 2.16 |
| Missouri | 3.16 | 61 | 1964 | 0.47 | 1941 | 10.47 |
| Minnesota | 1.88 | 62 | 1952 | 0.15 | 1971 | 5.76 |
| Arkansas | 3.33 | 63 | 1963 | 0.12 | 2009 | 14.36 |
| North Carolina | 3.53 | 69 | 2000 | 0.1 | 1971 | 8.57 |
| Alabama | 3.01 | 70 | 1963 | 0.04 | 1995 | 9.4 |
| Connecticut | 4.24 | 77 | 1924 | 0.36 | 2005 | 15.69 |
| Iowa | 2.94 | 78 | 1952 | 0.02 | 2009 | 6.36 |
| Kentucky | 3.19 | 79 | 1963 | 0.16 | 1919 | 7.43 |
| Mississippi | 3.56 | 79 | 1963 | 0.07 | 2009 | 9.84 |
| Rhode Island | 4.75 | 91 | 1946 | 0.35 | 2005 | 14.63 |
| Idaho | 2.02 | 92 | 1978 | 0.08 | 1975 | 3.01 |
| Massachusetts | 5.17 | 92 | 1924 | 0.27 | 2005 | 14.25 |
| Indiana | 4 | 93 | 1908 | 0.35 | 1919 | 8.51 |
| Illinois | 3.94 | 95 | 1964 | 0.2 | 1941 | 9.23 |
| Tennessee | 4.03 | 95 | 1963 | 0.03 | 1919 | 7.46 |
| Virginia | 4.32 | 96 | 2000 | 0.09 | 1976 | 8.69 |
| New York | 4.88 | 99 | 1963 | 0.33 | 2005 | 8.39 |
| Vermont | 5.12 | 101 | 1963 | 0.52 | 2005 | 9.57 |
| West Virginia | 4.48 | 101 | 1963 | 0.23 | 1925 | 7.33 |
| Wisconsin | 3.85 | 102 | 1952 | 0.17 | 1900 | 6 |
| New Hampshire | 5.43 | 105 | 1924 | 0.31 | 2005 | 13.81 |
| North Dakota | 1.96 | 105 | 1952 | 0.1 | 1982 | 4.71 |
| Oregon | 3.25 | 105 | 1895 | 0.05 | 1950 | 6.45 |
| Montana | 1.58 | 106 | 1987 | 0.08 | 1946 | 2.34 |
| Pennsylvania | 5.32 | 107 | 1963 | 0.24 | 1976 | 6.59 |
| New Jersey | 6.79 | 109 | 1924 | 0.32 | 2005 | 11.98 |
| Ohio | 4.56 | 109 | 1924 | 0.25 | 1919 | 6.34 |
| Michigan | 4.79 | 112 | 1924 | 0.48 | 1954 | 5.73 |
| Washington | 6.04 | 112 | 1987 | 0.23 | 1947 | 7.82 |
| Maine | 6.65 | 114 | 1947 | 0.36 | 2005 | 11.39 |
| Maryland | 7.68 | 116 | 1963 | 0.16 | 1976 | 8.05 |
| Delaware | 8.89 | 118 | 1963 | 0.14 | 2012 | 8.89 |
Four of the 48 continental US states set a record for lowest rainfall in September 2012 according to the NOAA. The ranks are out of 118 with 1 being driest. 19 out of the 48 states were below average (rank 59 and lower) and 29 were ranked above average.
Indiana, Kentucky, Mississippi, Missouri, Tennessee and Nebraska’s driest September were before 1900.
| State | Sep 2012 | Sep Rank | Driest Sep | Lowest Rainfall | Wettest Sep | Highest Rainfall |
| Minnesota | 0.56 | 1 | 2012 | 0.56 | 2010 | 6.7 |
| Montana | 0.15 | 1 | 2012 | 0.15 | 1986 | 3.71 |
| North Dakota | 0.24 | 1 | 2012 | 0.24 | 1900 | 5 |
| South Dakota | 0.24 | 1 | 2012 | 0.24 | 1986 | 4.27 |
| Washington | 0.11 | 2 | 1975 | 0.09 | 1959 | 4.78 |
| Nebraska | 0.51 | 3 | 1899 | 0.44 | 1973 | 6.5 |
| Oregon | 0.07 | 4 | 1999 | 0.03 | 1986 | 2.83 |
| Idaho | 0.19 | 7 | 1987 | 0.08 | 1959 | 3.23 |
| Wisconsin | 1.61 | 9 | 1952 | 0.78 | 1986 | 8.25 |
| Wyoming | 0.31 | 9 | 1979 | 0.22 | 1923 | 3.42 |
| Iowa | 1.62 | 15 | 1939 | 0.84 | 1926 | 9.75 |
| California | 0.1 | 24 | 1974 | 0.02 | 1904 | 2.42 |
| South Carolina | 2.36 | 24 | 2005 | 0.81 | 1928 | 13.12 |
| Georgia | 2.77 | 33 | 2005 | 0.93 | 2004 | 12.32 |
| Michigan | 2.69 | 36 | 1979 | 0.98 | 1986 | 8.62 |
| Kansas | 2.08 | 39 | 1956 | 0.29 | 1973 | 8.35 |
| Florida | 5.66 | 42 | 1921 | 2.13 | 1979 | 12.98 |
| Oklahoma | 2.9 | 55 | 1956 | 0.27 | 1945 | 7.86 |
| New Mexico | 1.49 | 58 | 1956 | 0.08 | 1941 | 5.84 |
| Utah | 0.85 | 61 | 1979 | 0.04 | 1982 | 3.71 |
| Arizona | 1.18 | 63 | 1953 | 0.02 | 1939 | 4.14 |
| New Jersey | 3.97 | 71 | 1941 | 0.27 | 1938 | 9.78 |
| Colorado | 1.4 | 72 | 1956 | 0.1 | 1961 | 2.93 |
| Delaware | 4.09 | 74 | 1941 | 0.15 | 1935 | 11.59 |
| North Carolina | 4.89 | 77 | 1990 | 1.22 | 1999 | 13.3 |
| Maryland | 4.16 | 81 | 1941 | 0.58 | 1999 | 10.45 |
| Mississippi | 4.15 | 85 | 1897 | 0.72 | 1906 | 10.06 |
| Virginia | 4.08 | 85 | 2005 | 0.79 | 1999 | 10.47 |
| Nevada | 0.69 | 90 | 1922 | 0.02 | 1982 | 2.57 |
| Missouri | 5.23 | 92 | 1897 | 0.7 | 1993 | 11.65 |
| Rhode Island | 5.2 | 92 | 1941 | 0.5 | 2008 | 9.51 |
| Texas | 4.01 | 92 | 1931 | 0.55 | 1936 | 6.9 |
| Alabama | 5.55 | 95 | 1984 | 0.66 | 1906 | 10.03 |
| Maine | 4.95 | 97 | 1948 | 1.26 | 1999 | 9.1 |
| Massachusetts | 5.32 | 97 | 1914 | 0.58 | 1933 | 9.66 |
| Arkansas | 5.19 | 98 | 2004 | 0.41 | 1913 | 9.94 |
| Louisiana | 6.01 | 98 | 1953 | 0.96 | 1913 | 12.92 |
| Vermont | 5.08 | 98 | 1908 | 0.96 | 1999 | 8.61 |
| New Hampshire | 5.46 | 99 | 1914 | 0.77 | 1938 | 9.81 |
| New York | 4.8 | 99 | 1964 | 1.18 | 1977 | 7.87 |
| Connecticut | 5.96 | 100 | 1914 | 0.35 | 1938 | 13.89 |
| Pennsylvania | 5.21 | 103 | 1943 | 0.79 | 2011 | 10.08 |
| Illinois | 5.12 | 104 | 1979 | 0.49 | 1926 | 9.68 |
| Indiana | 5.2 | 105 | 1897 | 0.6 | 1926 | 8.25 |
| Tennessee | 6.02 | 107 | 1897 | 0.6 | 1977 | 7.86 |
| West Virginia | 5.45 | 108 | 1985 | 0.69 | 2004 | 7.45 |
| Kentucky | 5.99 | 112 | 1897 | 0.28 | 2006 | 8.55 |
| Ohio | 5.57 | 115 | 1908 | 0.58 | 1926 | 7.16 |
The 1940-1959 period has the largest number of driest Septembers.

NOAA August 2012 Precipitation Ranked Driest to Wettest. Rank 1 = Driest. Rank 118 = Wettest.
Three states had the driest August ever: Nebraska, Washington and Wyoming.
No states had the wettest, but Louisiana and Mississippi each had their 2nd wettest (rank 117).
California (2002) and Nevada (1940) are the only state evers to have zero precipitation in August therefore the records can only be tied.
| State | Aug 2012 | Aug Ranking | Driest Aug | Driest Aug Precip |
| Nebraska | 1.02 | 1 | 2012 | 1.02 |
| Washington | 0.05 | 1 | 2012 | 0.05 |
| Wyoming | 0.12 | 1 | 2012 | 0.12 |
| Idaho | 0.16 | 4 | 1940 | 0.12 |
| Oregon | 0.04 | 6 | 1955 | 0.01 |
| Colorado | 1.05 | 9 | 1960 | 0.63 |
| South Dakota | 1.19 | 12 | 2001 | 0.72 |
| Minnesota | 2.08 | 18 | 1930 | 1.24 |
| Montana | 0.59 | 21 | 2001 | 0.2 |
| Wisconsin | 2.53 | 24 | 1930 | 1.07 |
| Missouri | 2.35 | 26 | 1909 | 0.6 |
| West Virginia | 3.05 | 28 | 1957 | 1.55 |
| Vermont | 3.15 | 30 | 1957 | 1.28 |
| New Mexico | 1.75 | 33 | 1962 | 0.64 |
| Iowa | 2.94 | 38 | 1984 | 1.05 |
| Ohio | 2.86 | 40 | 1951 | 1.31 |
| North Dakota | 1.74 | 45 | 1961 | 0.72 |
| New York | 3.4 | 52 | 1907 | 1.47 |
| Kansas | 2.83 | 53 | 1913 | 0.53 |
| Utah | 0.87 | 53 | 1985 | 0.07 |
| Texas | 2.07 | 55 | 2000 | 0.47 |
| Michigan | 3.01 | 57 | 1930 | 0.76 |
| Delaware | 4.29 | 59 | 2008 | 0.99 |
| Oklahoma | 2.8 | 60 | 2000 | 0.14 |
| Pennsylvania | 3.66 | 60 | 1930 | 1.29 |
| Kentucky | 3.47 | 62 | 1925 | 1.27 |
| Connecticut | 4.07 | 67 | 1981 | 1.03 |
| Tennessee | 3.76 | 67 | 1953 | 0.97 |
| Illinois | 3.53 | 68 | 1953 | 1.12 |
| Rhode Island | 3.57 | 70 | 1984 | 0.58 |
| Maryland | 4.64 | 77 | 1930 | 1.07 |
| Arizona | 2.38 | 84 | 1962 | 0.62 |
| Indiana | 4.07 | 86 | 1897 | 1.59 |
| New Jersey | 5.68 | 86 | 1964 | 0.9 |
| New Hampshire | 5.03 | 87 | 1996 | 0.96 |
| Virginia | 4.91 | 87 | 1930 | 1.74 |
| Maine | 4.62 | 88 | 2002 | 1.08 |
| North Carolina | 6.35 | 89 | 1997 | 1.94 |
| California | 0.28 | 92 | 2002 | 0 |
| Georgia | 6.39 | 96 | 1925 | 1.84 |
| Massachusetts | 4.82 | 96 | 1907 | 1.11 |
| Arkansas | 4.38 | 97 | 2000 | 0.4 |
| South Carolina | 7.53 | 98 | 1925 | 1.47 |
| Nevada | 1.03 | 104 | 1944 | 0 |
| Alabama | 6.31 | 111 | 1925 | 1.13 |
| Florida | 11.69 | 115 | 1938 | 4.05 |
| Louisiana | 8.47 | 117 | 1980 | 1.67 |
| Mississippi | 8.58 | 117 | 1954 | 1.4 |
