Government Shutdown Stops Sea Ice Data Updates From NOAA

There were no NSIDC sea ice updates today. I emailed NSIDC to ask why and got this prompt and polite reply.

“Thank you for contacting the National Snow and Ice Data Center.Because our data provider, the National Oceanic and Atmospheric Administration (NOAA), has shut down the data stream as part of the government shutdown, we are temporarily unable to update the product.

I apologize for the inconvenience.

Best regards,
xxxxxxxx xxxxxxxxxx
NSIDC User Services”


Less Fresh Water in the Arctic and More Rainfall in Australia Leads To Lower Sea Level and Less Ice?

Could massive amounts of rainfall in Australia have deprived the Arctic of fresh water so there was less sea ice?

NSIDC:  “Water from the Pacific Ocean and several rivers in Russia and Canada provide fresher, less dense water to the Arctic Ocean. So the Arctic Ocean has a layer of cold, fresh water near the surface with warmer, saltier water below. This cold, fresh water layer typically allows more ice growth in the Arctic than the Antarctic.

NCAR: ” when three atmospheric patterns came together over the Indian and Pacific oceans, they drove so much precipitation over Australia in 2010 and 2011 that the world’s ocean levels dropped measurably.”

Antarctic Sea Ice Extent – 6th daily record for 2013

Day 71 in the Antarctic was another daily record for Sea Ice Extent (most ice on this day). That makes 6 for 2013 (corrected from 2003 typo).  And the 3rd day in a row.

There are only 7 days where a daily record exists from before 2000. 345 records are from 2006 to 2013.

NSIDC has a dedicated page to Arctic Sea Ice.  And one for Greenland. But no page dedicated to the Antarctic. That makes them propagandists, not scientists.

Year No of Daily Records
2010 129
2008 128
2006 29
2012 24
2007 21
2009 8
2000 6
2013 6
2004 5
1998 4
2005 3
1979 2
1980 1

Day 71

Antarctic_Sea_Ice_Extent_Zoomed_2013_Day_71_1981-2010

Updated/Corrected: Arctic Sea Ice Extent Average for 2012 is now higher than 2007 (NSIDC)

UPDATE: My apology. The original post was wrong.

What I did (in a hurry) was post the Extent for day 290, not the mean of the extent up to day 290.

Sorry.

The correct data is:

The mean for 2012 up to day 290 = 10.5267 million sq km
The mean for 2007 up to day 290 = 10.52817million sq km

2012 is still lower than 2007, but only by 1,468.4 sq km. A statistical tie.

If I had waited one more day and had done it right, the conclusion of my original post would have been right.

But it wasn’t.

However, the mean for 2011 up to day 290 is 10.522 million sq km.

Which means 2012 has now averaged 4,633.3 sq km more ice than 2011 thanks to normal extent earlier in the year.

Original Post Starts Here:

Using NSIDC data (to day 290):

The mean of Arctic Sea Ice Extent for 2012 = 5.78274 million sq km
The mean of Arctic Sea Ice Extent for 2007 = 5.74562 million sq km

The average Arctic Sea Ice Extent for 2012 is now 37,120 sq miles higher than 2007.

NSIDC Ignored Antarctica in 2006 Too

Antarctic Sea Ice Extent set an all time record in 2012. The previous record was set in 2006. In 2006 there were 30 days where the ice extent was over 19 million sq km. That record has not been broken and was 9 days more than the previous record holder (1998).

So what did the NSIDC have to say about it in 2006?

Nothing.

They mentioned the Arctic a lot. And Al Gore’s movie. And that there was going to be an open house. But they ignored Antarctica. If they were scientists and not propagandists shouldn’t they be interested in both poles and maximum records too?


NY Times Dishonestly Shills for NSIDC Antarctic Deniers

A few days I asked the question about the record Antarctic Sea Ice Extent in 2012 “Anyone wonder why NOAA isn’t making a fuss about this?”

One caveat is that I should have said NSIDC instead of NOAA (NOAA does partially fund NSIDC).

Today Justin Gillis took a cheap shot at bloggers (h/t Tom Nelson) and said:

“The National Snow and Ice Data Center uses a five-day moving average to track such matters, and always waits a few days before announcing a minimum or maximum in sea ice at either pole. That is to make sure the low or high point for the year has really been reached, given that sea ice can change abruptly in response to winds and other factors. The five-day averaging also helps smooth out small errors in the satellite tracking data.

.

This longstanding practice has been explained publicly many times, but that has not stopped climate-change contrarians from asserting that the snow and ice center had been trying to hide this year’s record in Antarctica by supposedly failing to make any announcement.”

I checked. The Arctic record was broken on the August 24th and NSIDC waited 3 days to call a news conference for the media on the 27th,

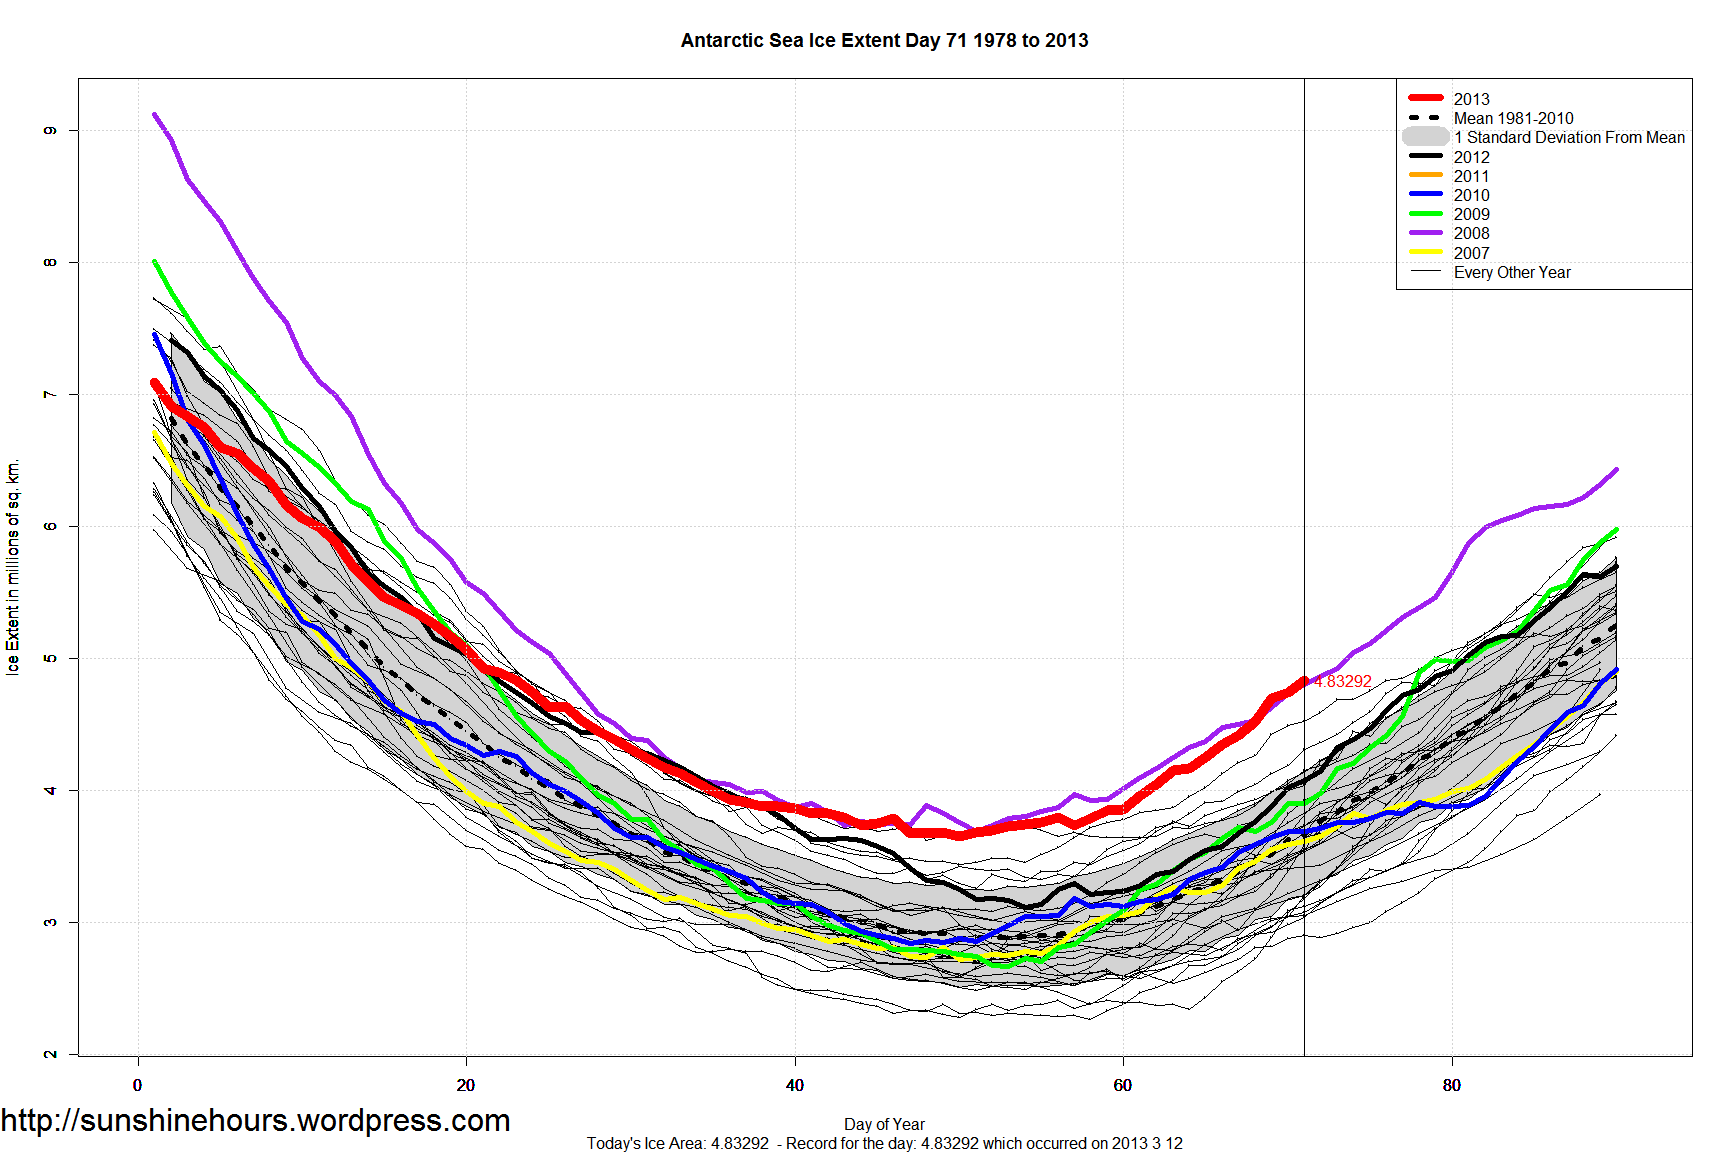
The Antarctic Extent record was broken on September 24th.  I wrote about the Antarctic Ice Area coming close to the record on  September 24th, but  I was 5 days late writing about the Antarctic Ice Extent breaking the record (NSIDC uses Extent and I had not come across the NSIDC data)  and did not post until September 29th.

So of course NSIDC held a news conference on September 27th to announce the new record … didn’t they?

No. No news conference.

Obviously there was a media advisory on the 27th.  Nope.

If you go the press page for NSIDC you will see that Antarctic Ice Extent record is not mentioned until October 2nd, 2012.

Justin Gillis and the NY Times owes a lot of bloggers an apology.

Record Antarctic Sea Ice – NSIDC references debunked Steig et al., 2009

NSIDC has attempted to explain why there was record breaking Antarctic Sea Ice by claiming:

First, climate is warming over much of the Antarctic continent, as shown in several recent studies (e.g., Steig et al., 2009)

Those of us who pay attention to climate know that Steig et al, 2009 was refuted by O’Donnell et al 2010.  A very good explanation can be read at Climate Audit.

“Steig’s West Antarctic warming results from a spreading of warming in the Peninsula to the West Antarctic through choices made in their principal components. Different choices – ones more plausible in the circumstances – lead to opposite results.”