Where is the Data? UAH, HADCRUT kind of late

2nd UPDATE: UAH is out. My post here.I knew if I complained it would all show up. 🙂

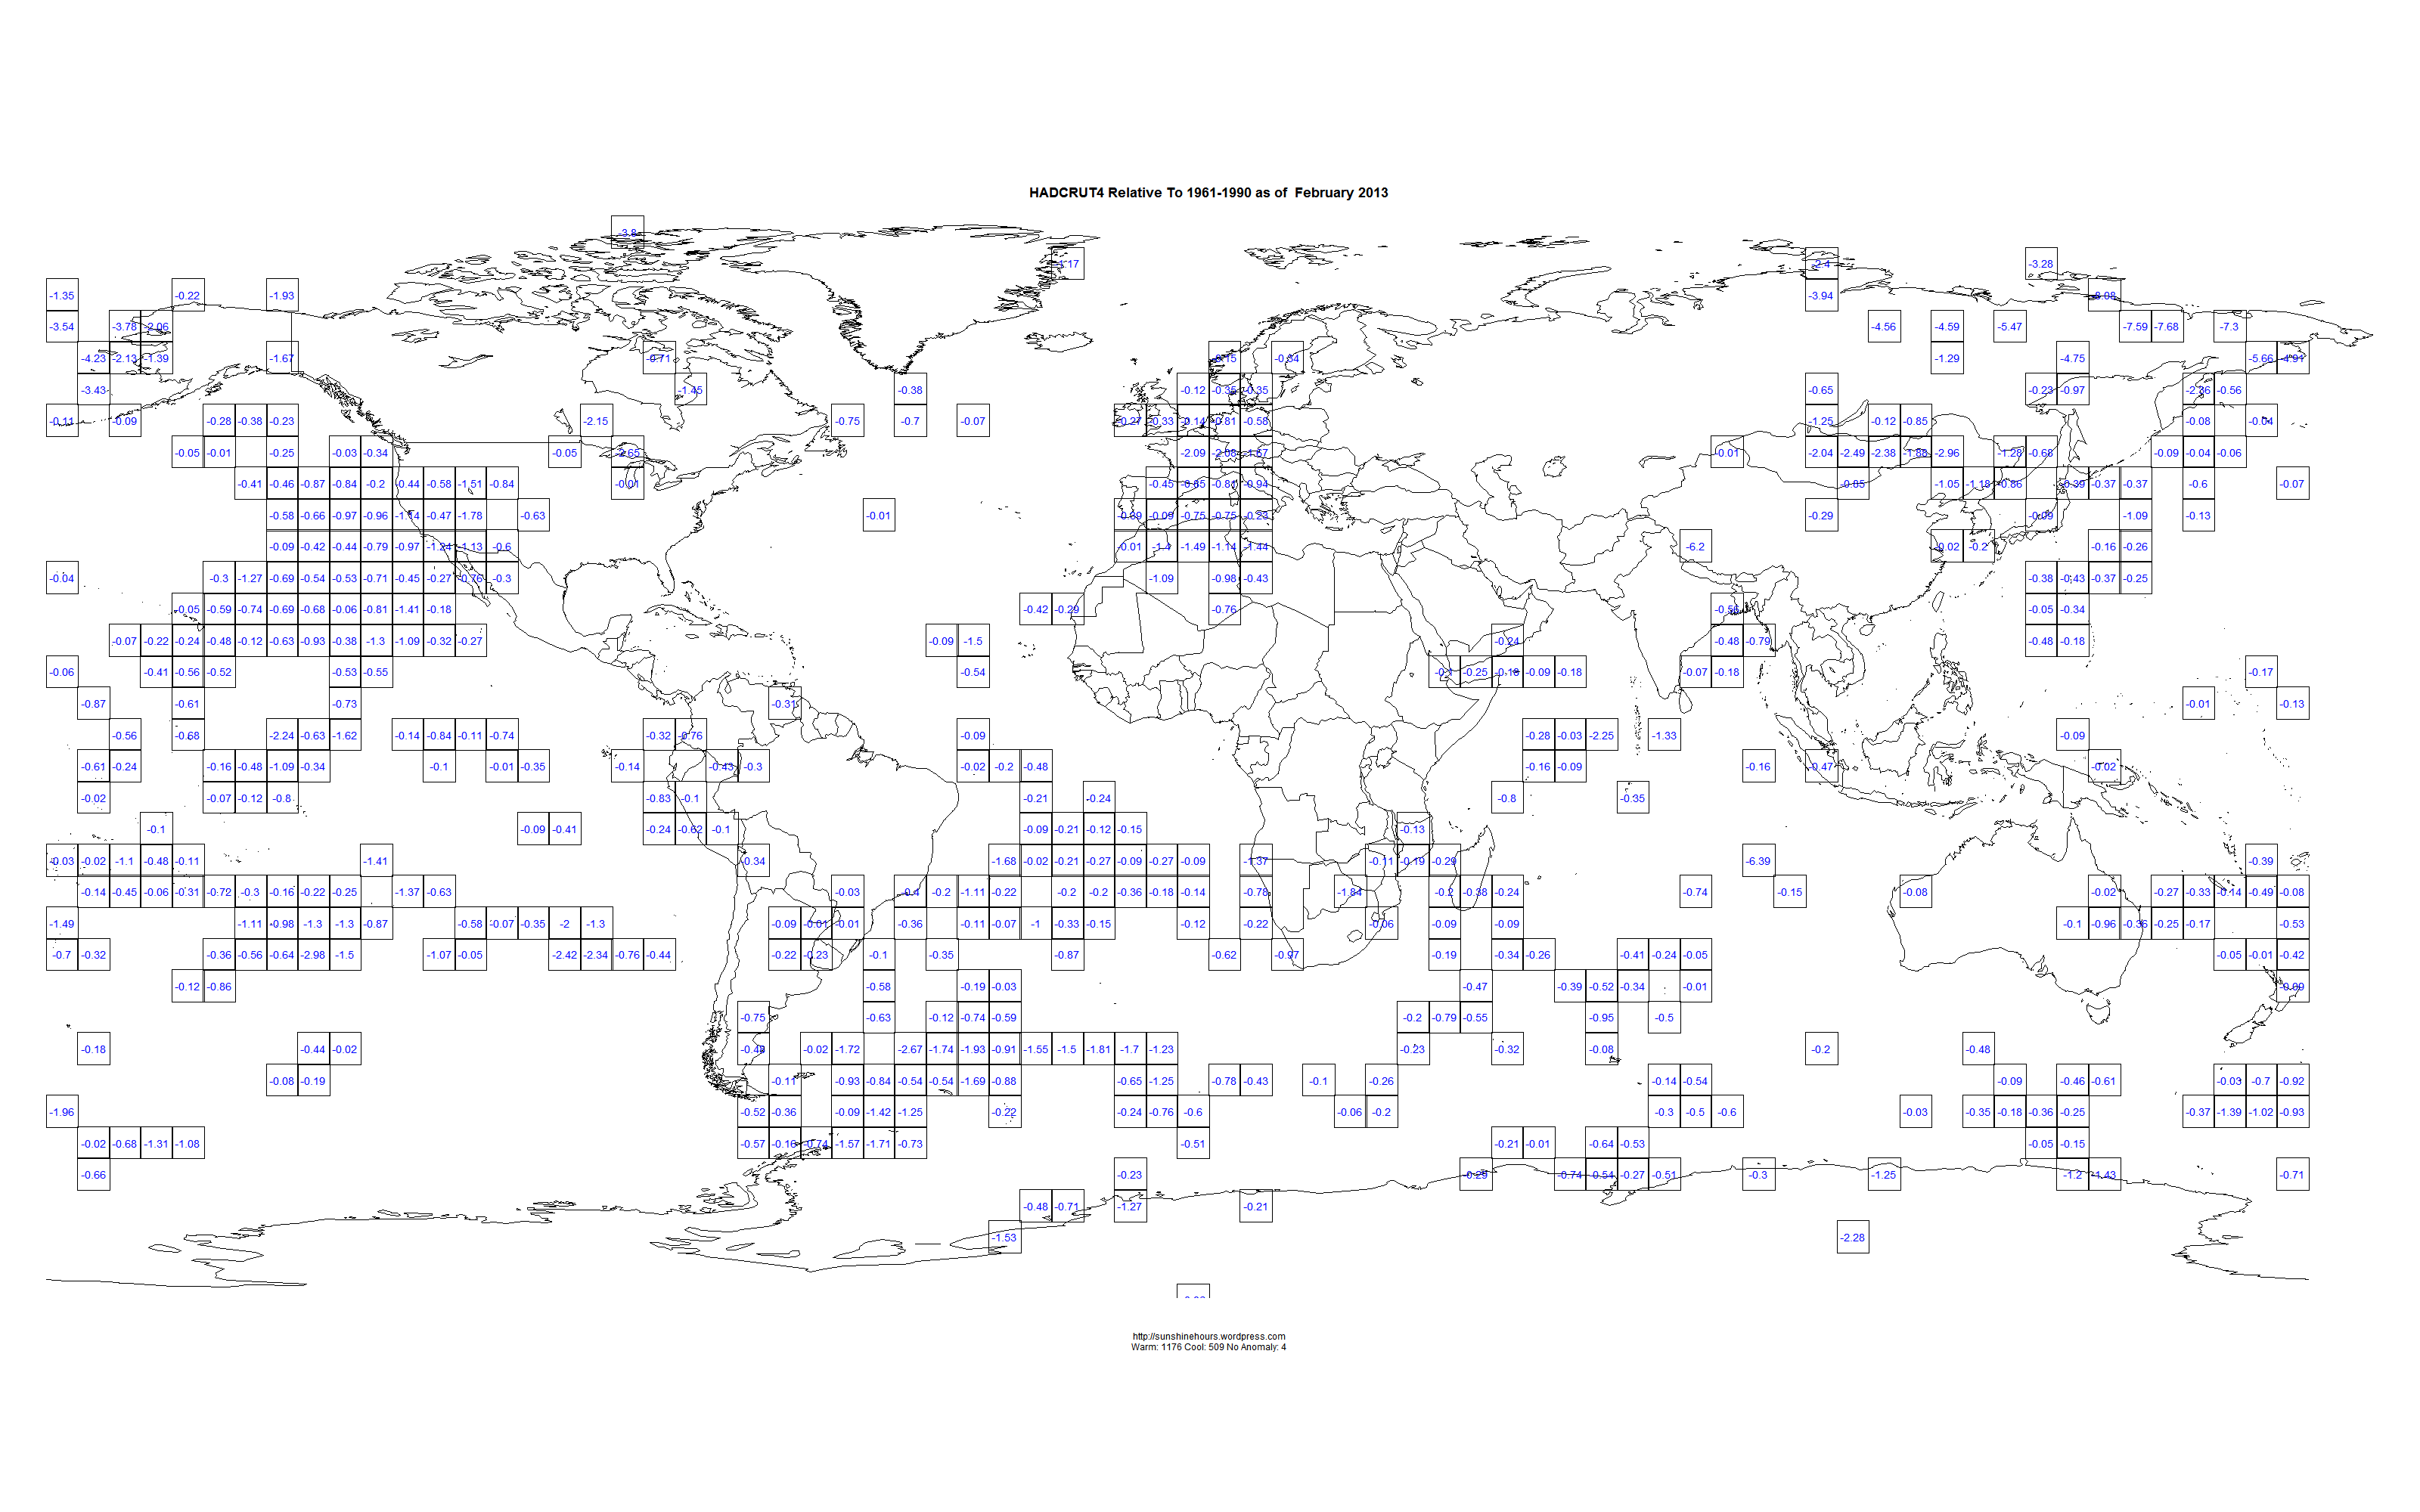
UPDATE: HADCRUT4 for March 2013 is out. My post is here.

Anyone know where the UAH and HADCRUT data is?

While some of the UAH data arrived a few days ago, the downloadable file is still missing April’s data. March’s data arrived April 2.

HADCRUT is usually available by the 28th of the following month. February’s data came out March 28. It is now 10 days late.

Are they having a conference? March and April too cold to explain?

RSS is out. HADCET is out. NCDC is due soon, but not overdue.

HADCRUT4 Gridded Feb 2013 – Europe was COLDER than 1961-1990!!!

Using HADCRUT4 Gridded data for Feb 2013 , I thought it would be useful to map the 5×5 grid squares colder than 1961-1990.

For some strange reason HADCRUT4 uses the archaic 1961-1990 period as the baseline, rather than the accepted 1981-2010.

Please click on the maps to make them bigger. And make sure you get them to go full size. I made them pretty big (3200 x 2000 pixels).

The number in the boxes is the temperature difference between the 1961-90 average and Feb 2013.

Notice that most of Western Europe was colder than 1961-1990!!!!!!!

Why only the cold squares? Because the HADCRUT4 page colr choices tends to minimize the cold areas. And because I can.

HAD4_Grid_February_2013_v2

HADCRUT3 Gridded Last 15 years – Some Data is Missing

My first look at the gridded data ended up with a Big Red Star. This post looks at how much data there is over the last 15 years counting back from June 2012 (the most recent gridded data).

For grids with temperature stations there should be 180 data points (15 years x 12 months).

I found 2,315 grid cells with data out of a possible 2,592. 731 of those grid cells have a 180 data points. 1,132 grid cells have 170 or more data points.

I calculated the trend for each gridcell.

I’ve used RGoogleMaps before to map spatial data, so here is a map of the world with the count of data points centered in each grid cell. You might want to click on it and zoom in. Cells with a cooling trend are in blue, warming cells are colored red. 1253 cells are warming, 1058 are cooling and 4 have a trend of 0.

There are a lot of cells without much data.