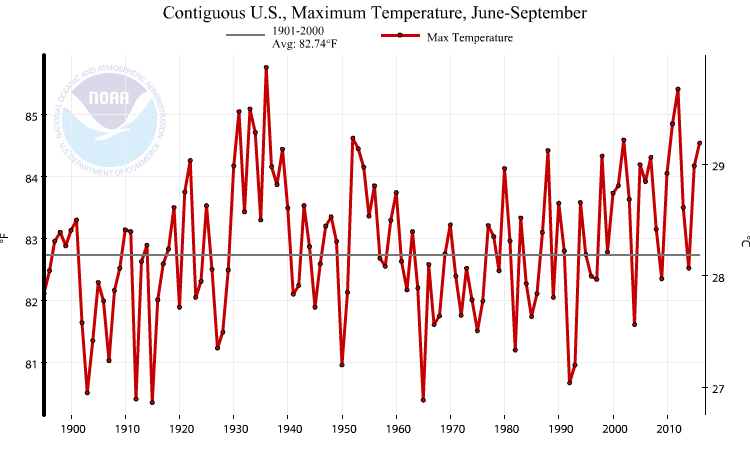
I did a post comparing CO2 to Jun-Sep Maximum temperatures using NOAA data here.
I picked maximum because the AGW cult predicts killer heat waves in the summer.
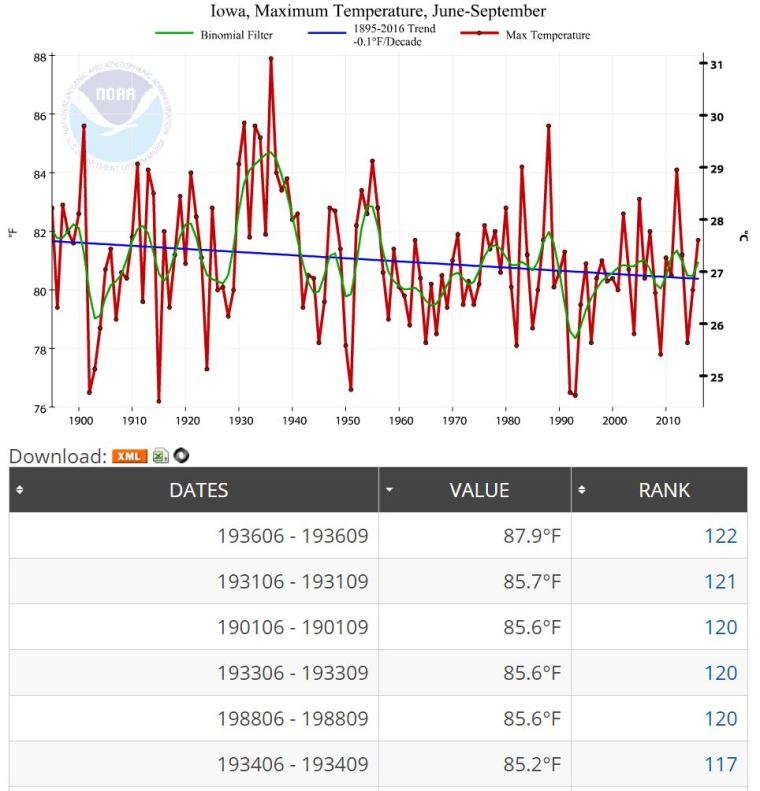
Today I randomly looked at Iowa. Wow. Why has CO2 foresaken Iowa?
I did a post comparing CO2 to Jun-Sep Maximum temperatures using NOAA data here.
I picked maximum because the AGW cult predicts killer heat waves in the summer.
Today I randomly looked at Iowa. Wow. Why has CO2 foresaken Iowa?
Despite a tripling of manmade CO2 since 1965, “summer” max temps in USA still are lower than 1936.
h/t NoTricksZone
According to the NOAA, September 2016 Tmax in the USA was only 100th warmest out of 122.
1998 was warmest. But 1922 was 2nd and 1953 3rd.
I think CO2 has forsaken September.
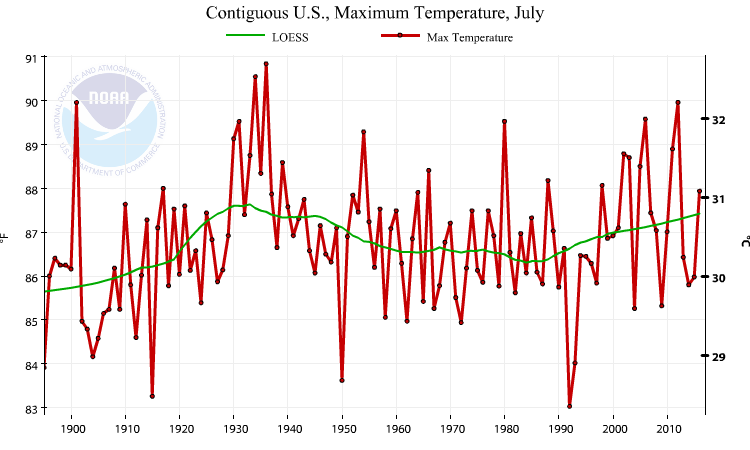
1 was warmest with 1936 and 1937 a very close 2nd and 3rd.
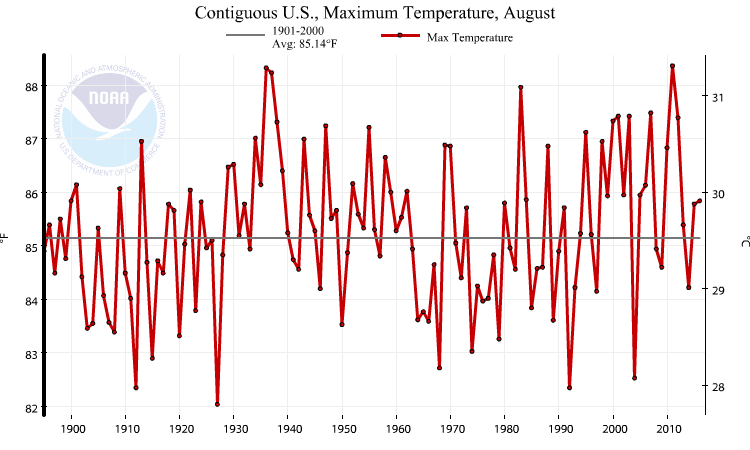
According to the NOAA, August 2016 Tmax in the USA was only 85th warmest out of 122.
2011 was warmest with 1936 and 1937 a very close 2nd and 3rd.
July in the USA max temp graph looks like the 1930s (but not quite as warm).
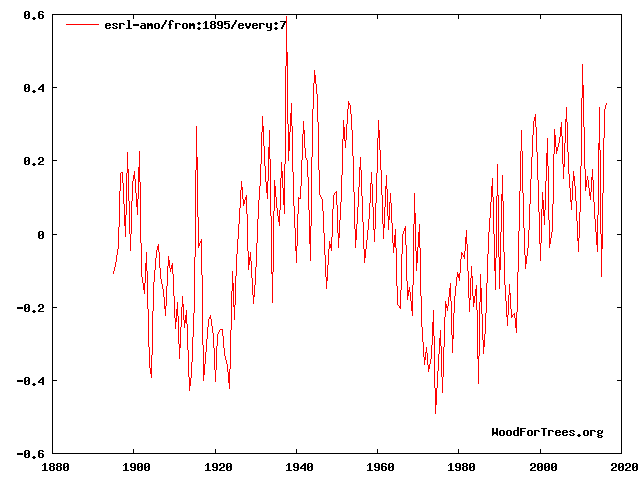
Kinda looks like the AMO
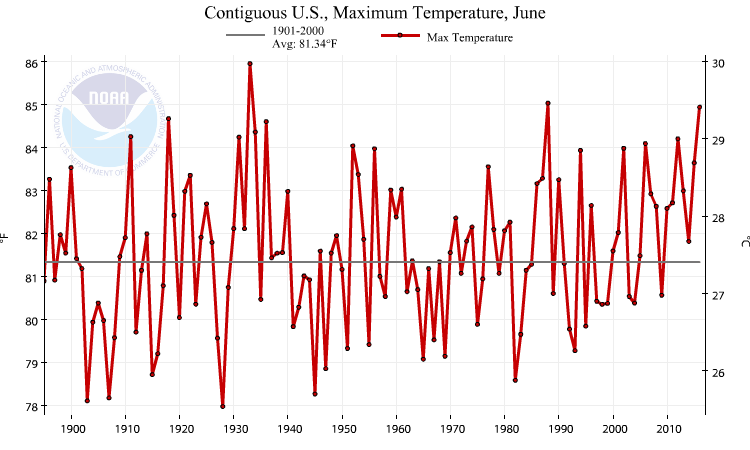
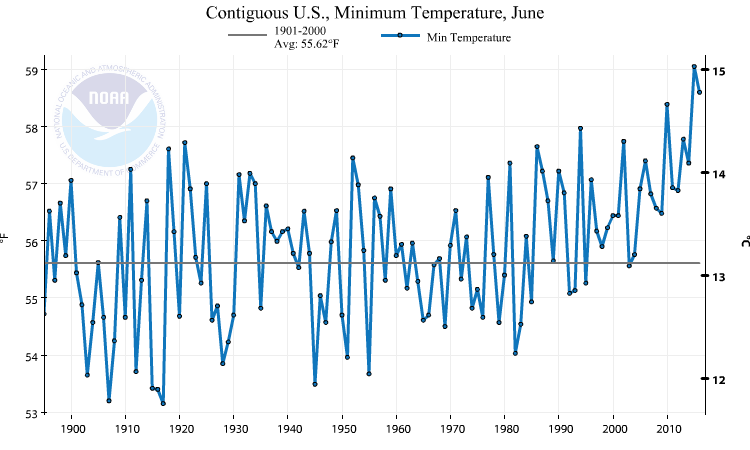
NOAA just put out the USA temperature for June 2016.
Lets compare Tmin (minimum) versus Tmax (maximum)
Wow. Tmin has been skyrocketing since 1980. Tmax has just gone up and down.
I suggest UHI (Urban Heat Islands) not “Global Warming”.
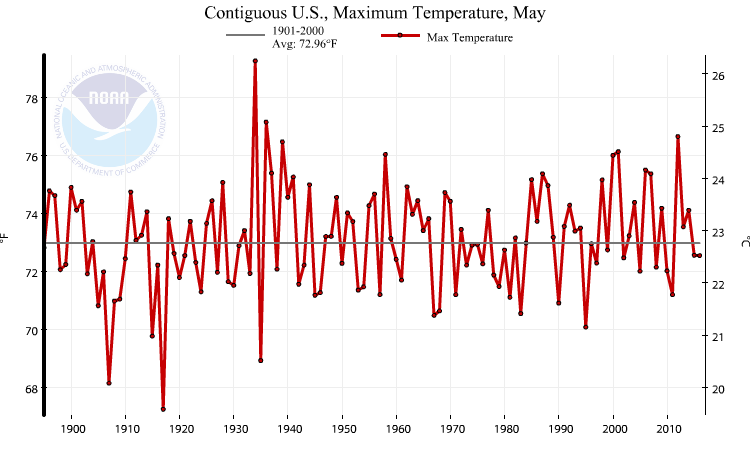
According to the NOAA, May 2016 was ranked 49th coldest out of 122.
That is essentially a tie with May 2015. The warmest May Tmax’s were 1934, 1936, 2012 and and 1939.
The following map shows state rankings. 122 = warmest. 1 would be coldest.
Note the states ranked 7th and 8th coldest. Wow. Not much El Nino effects …

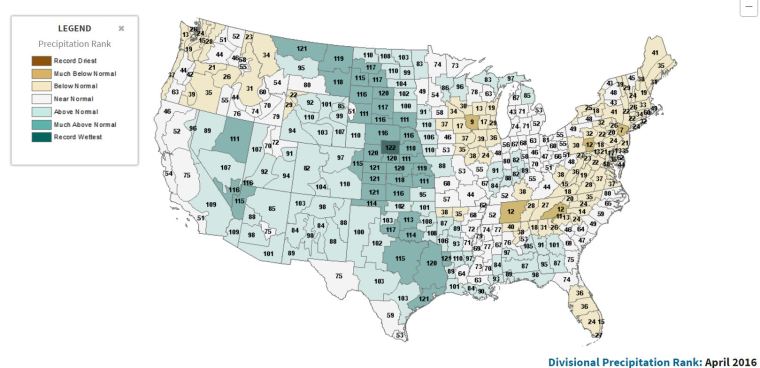
Above average precipitation in large parts of the USA for April 2016.
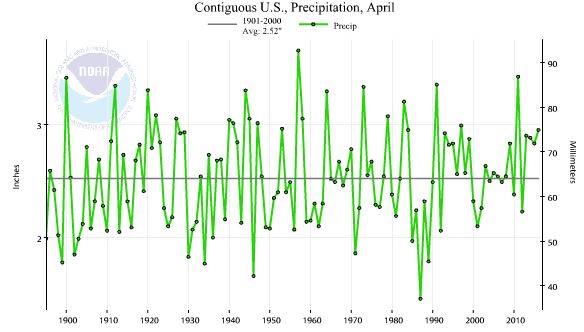
According to the NOAA, April 2016 was ranked 24th warmest out of 122 in terms of Maximum.
Did you know 1946 was the 2nd warmest April?


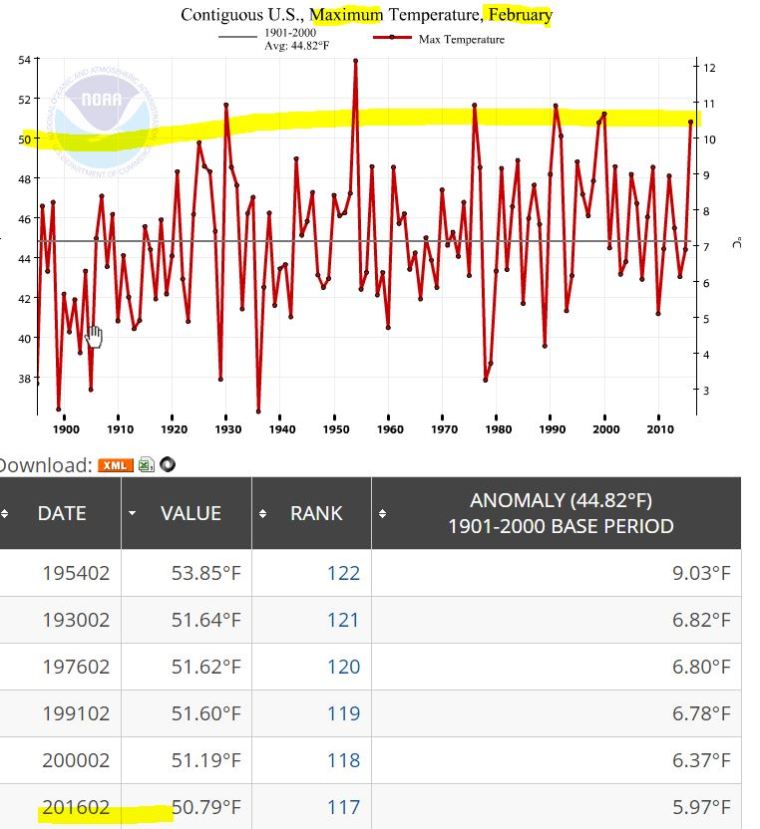
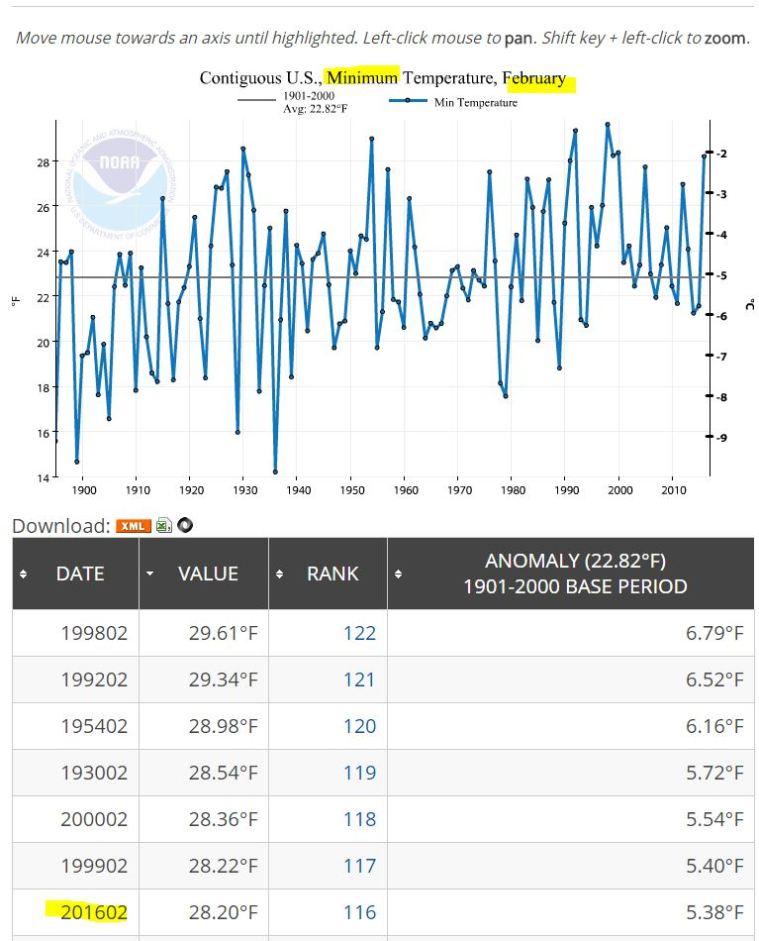
Despite the El Nino that supposedly made the earth the “warmest ever”, the NOAA Climate At A Glance pages shows no records for February temperature.
Maximum was 6th highest – 3.06F colder than 1954.
Minimum was 7th highest – 1.61F colder than 1998