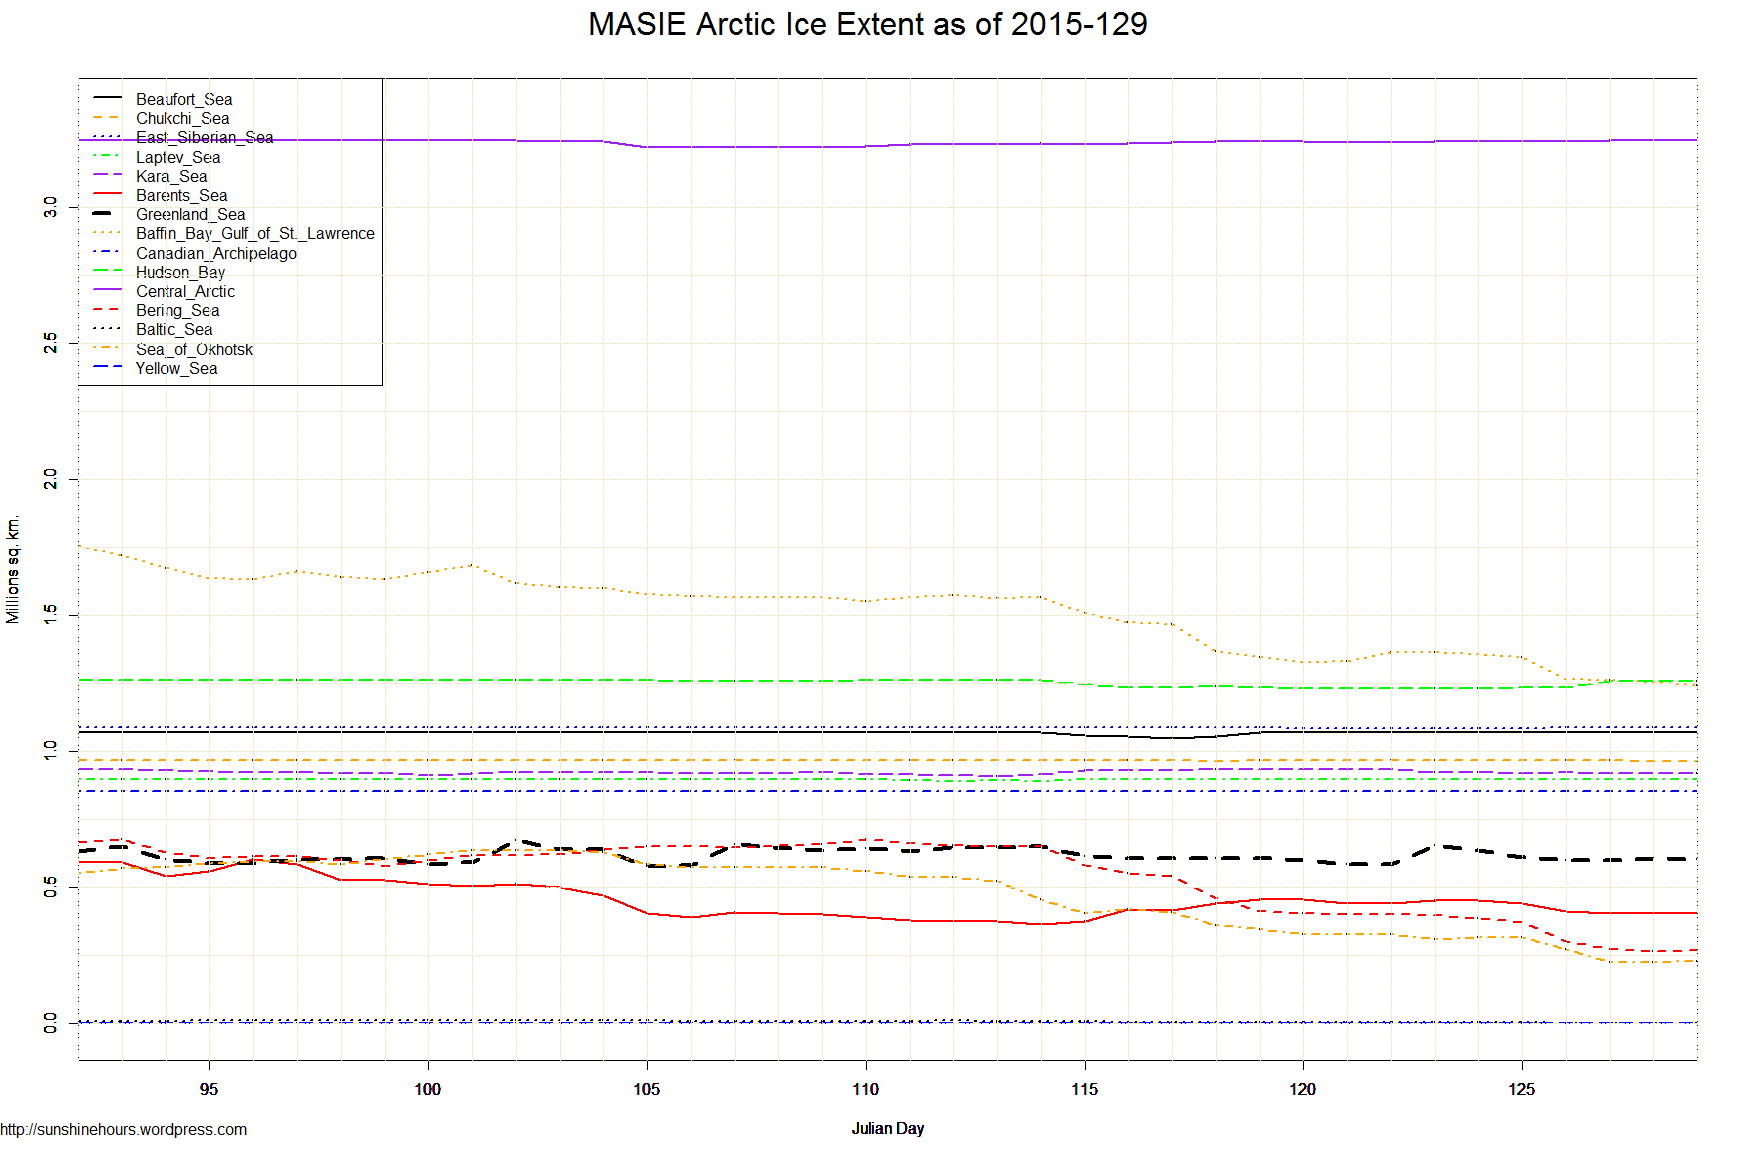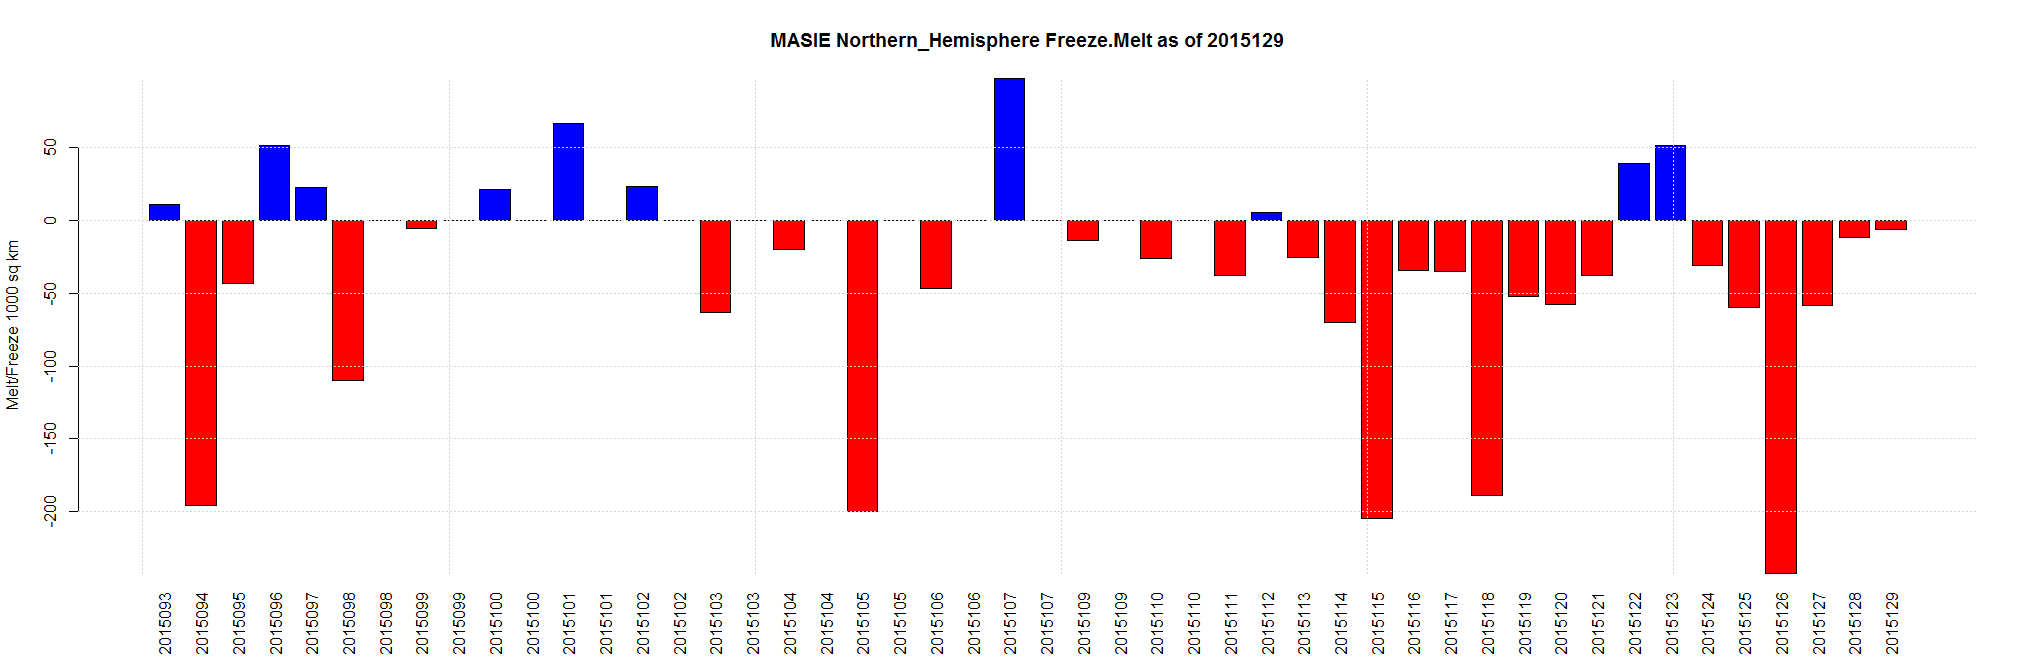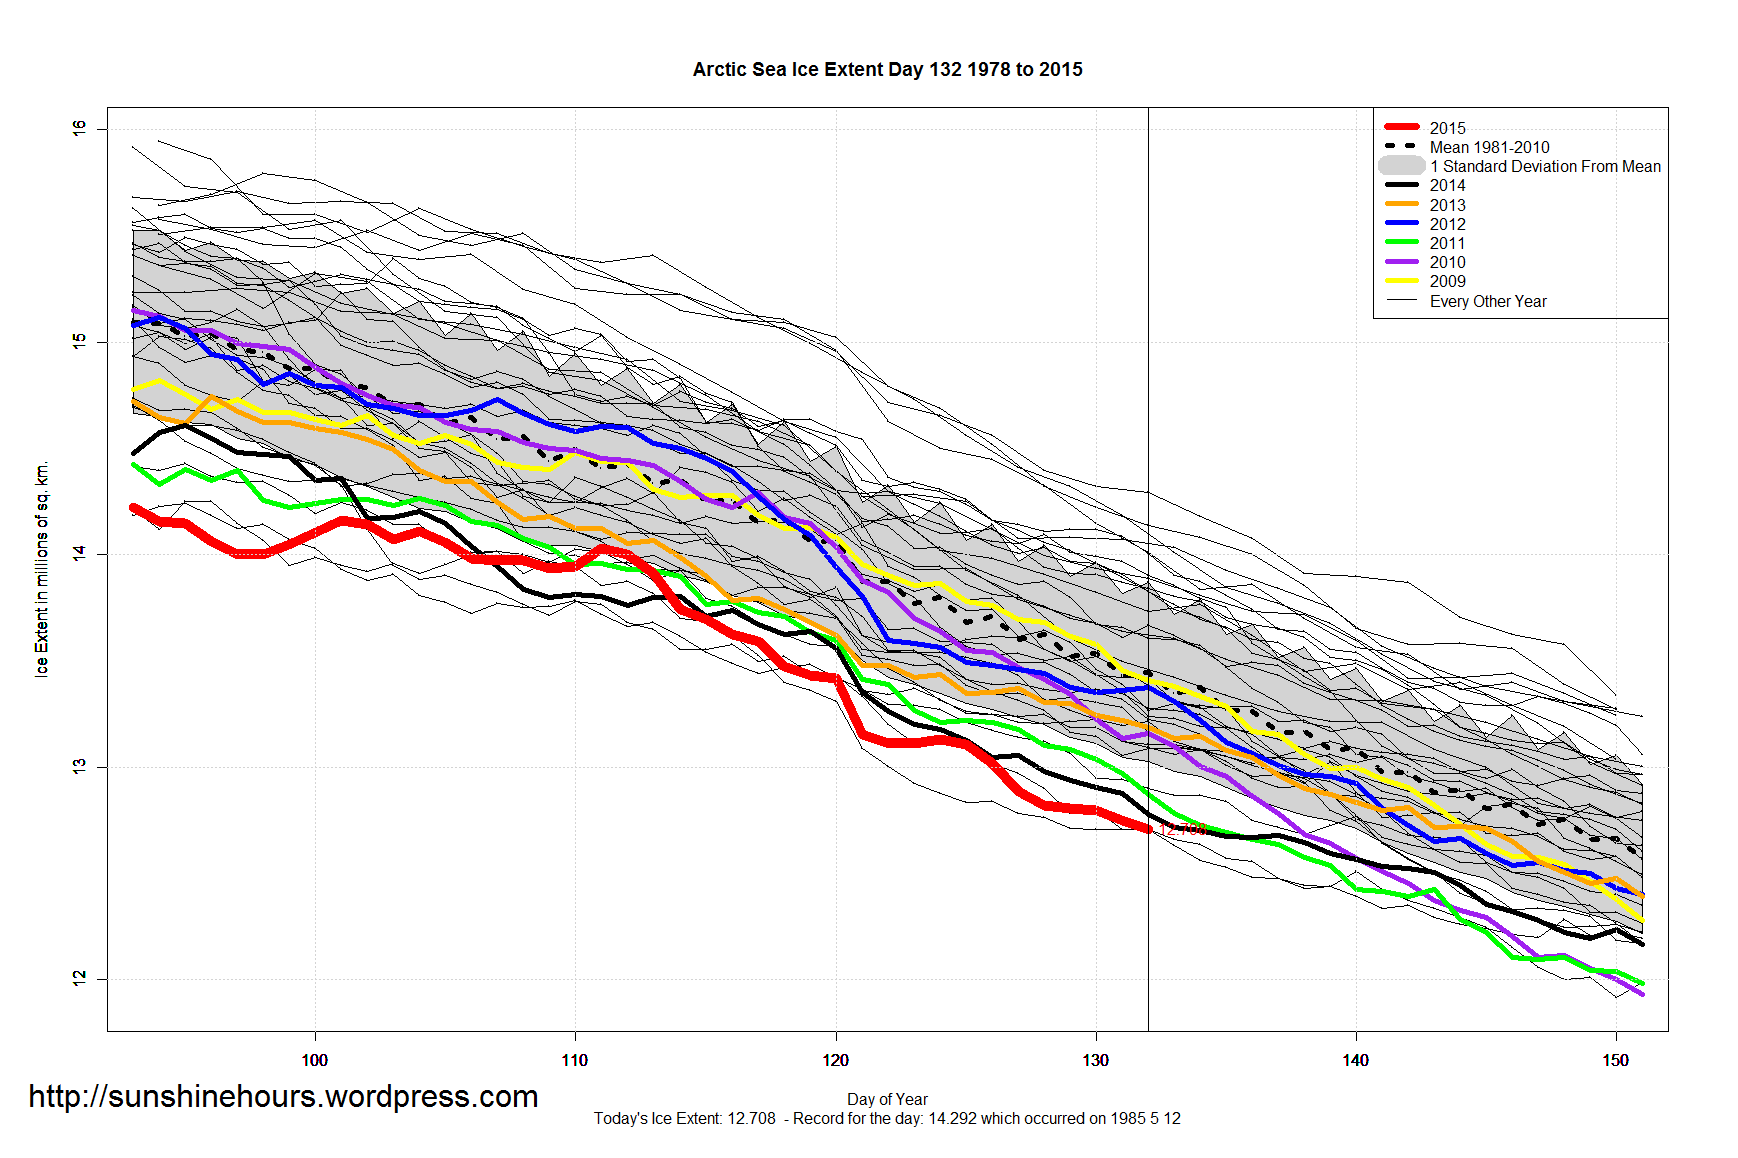
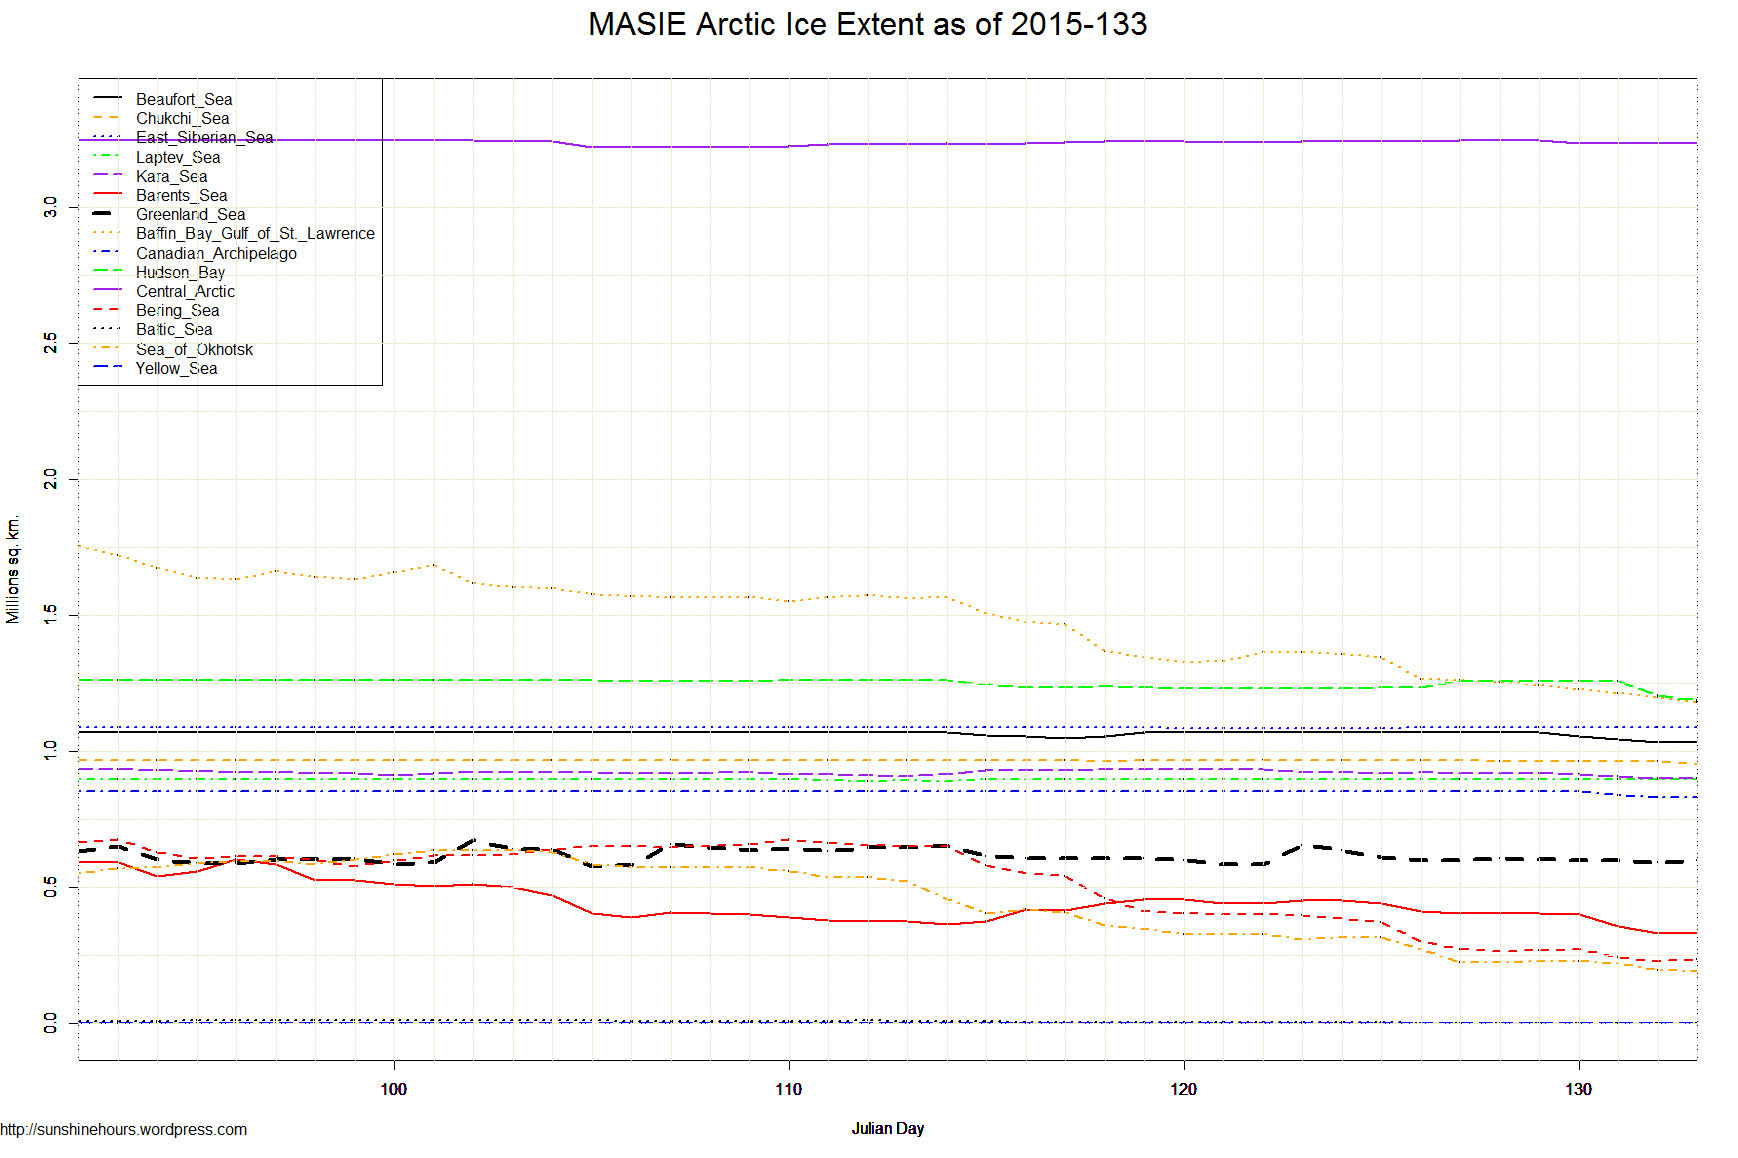
May 14 2015 MASIE Update (Arctic Sea Ice dataset frm MASIE )
| Region | 53 days ago | End | Last 52 | Last 28 | Last 14 | Last 7 | Last 3 | Last 1 |
| Hudson Bay | 1,260,903 | 1,189,801 | -71,102 | -68,483 | -46,107 | -45,967 | -67,732 | -18,311 |
| Baffin Bay Gulf of St. Lawrence | 1,754,107 | 1,181,678 | -572,429 | -386,868 | -164,206 | -83,668 | -48,318 | -17,264 |
| Chukchi Sea | 966,006 | 954,458 | -11,548 | -11,548 | -11,464 | -11,548 | -10,247 | -9,892 |
| Sea of Okhotsk | 551,895 | 190,364 | -361,531 | -384,509 | -156,301 | -81,791 | -38,700 | -5,032 |
| Barents Sea | 596,771 | 330,094 | -266,677 | -78,187 | -126,016 | -82,792 | -72,795 | -2,922 |
| Kara Sea | 935,023 | 900,287 | -34,736 | -20,703 | -34,408 | -21,476 | -14,754 | -2,897 |
| Beaufort Sea | 1,070,445 | 1,034,833 | -35,612 | -35,612 | -35,612 | -35,612 | -21,579 | -483 |
| East Siberian Sea | 1,087,137 | 1,087,137 | 0 | 0 | 0 | 0 | 0 | 0 |
| Laptev Sea | 897,845 | 897,845 | 0 | 0 | 124 | 0 | 0 | 0 |
| Canadian Archipelago | 853,214 | 832,727 | -20,487 | -20,487 | -20,488 | -20,488 | -20,488 | 0 |
| Baltic Sea | 9,702 | 66 | -9,636 | -9,502 | -4,341 | -470 | 0 | 0 |
| Yellow Sea | 0 | 0 | 0 | 0 | 0 | 0 | 0 | 0 |
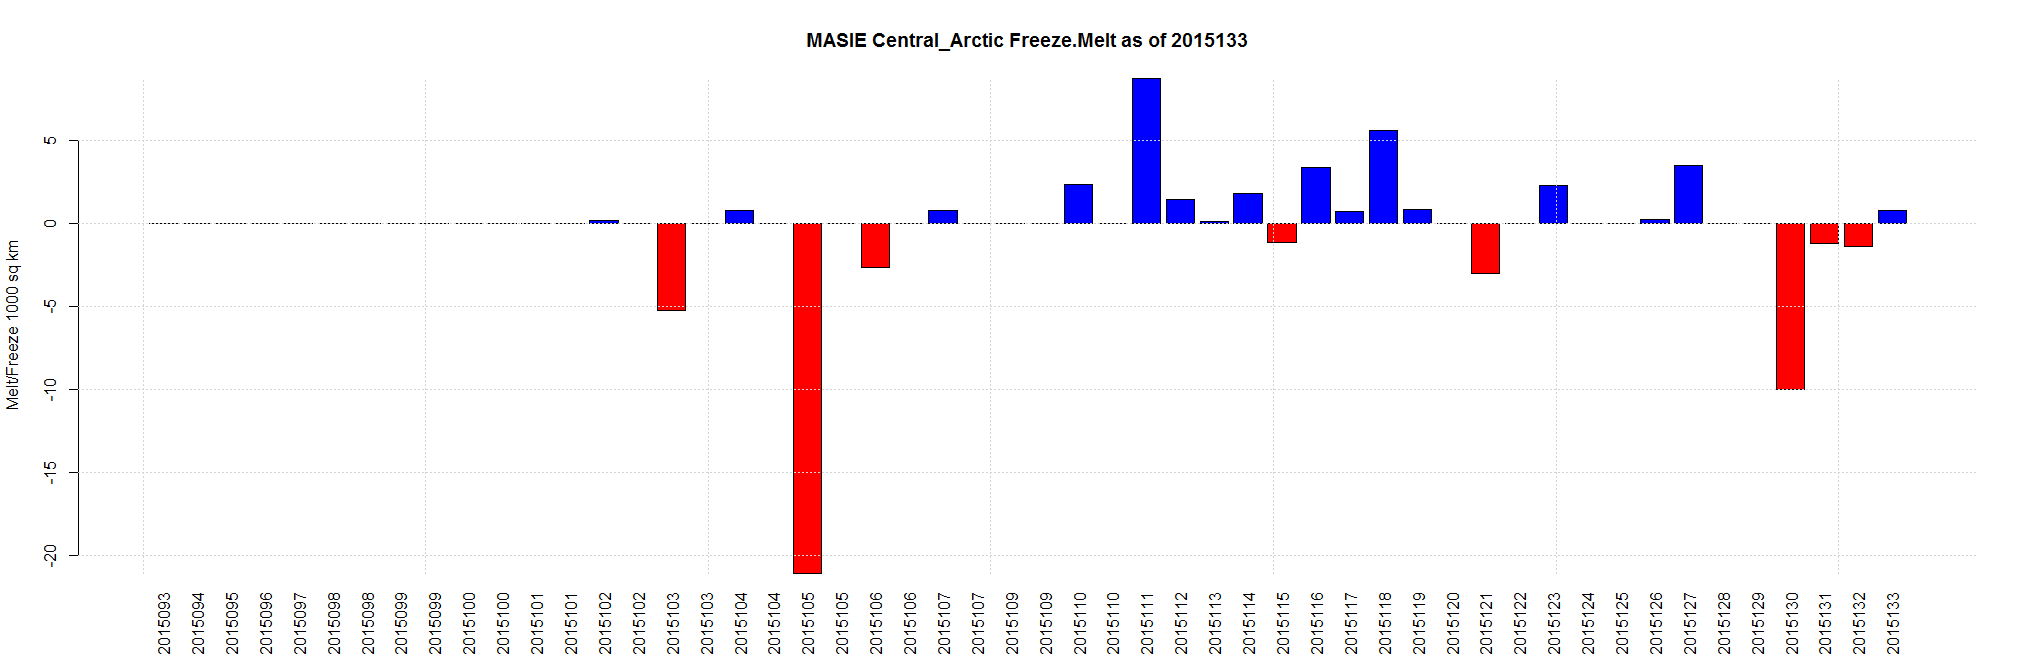
| Central Arctic | 3,247,614 | 3,234,966 | -12,648 | 14,663 | -8,993 | -8,412 | -1,849 | 744 |
| Bering Sea | 667,281 | 236,031 | -431,250 | -413,246 | -175,491 | -64,476 | -36,935 | 5,891 |
| Greenland Sea | 633,474 | 600,178 | -33,296 | -59,718 | -8,683 | 1,654 | 89 | 6,761 |
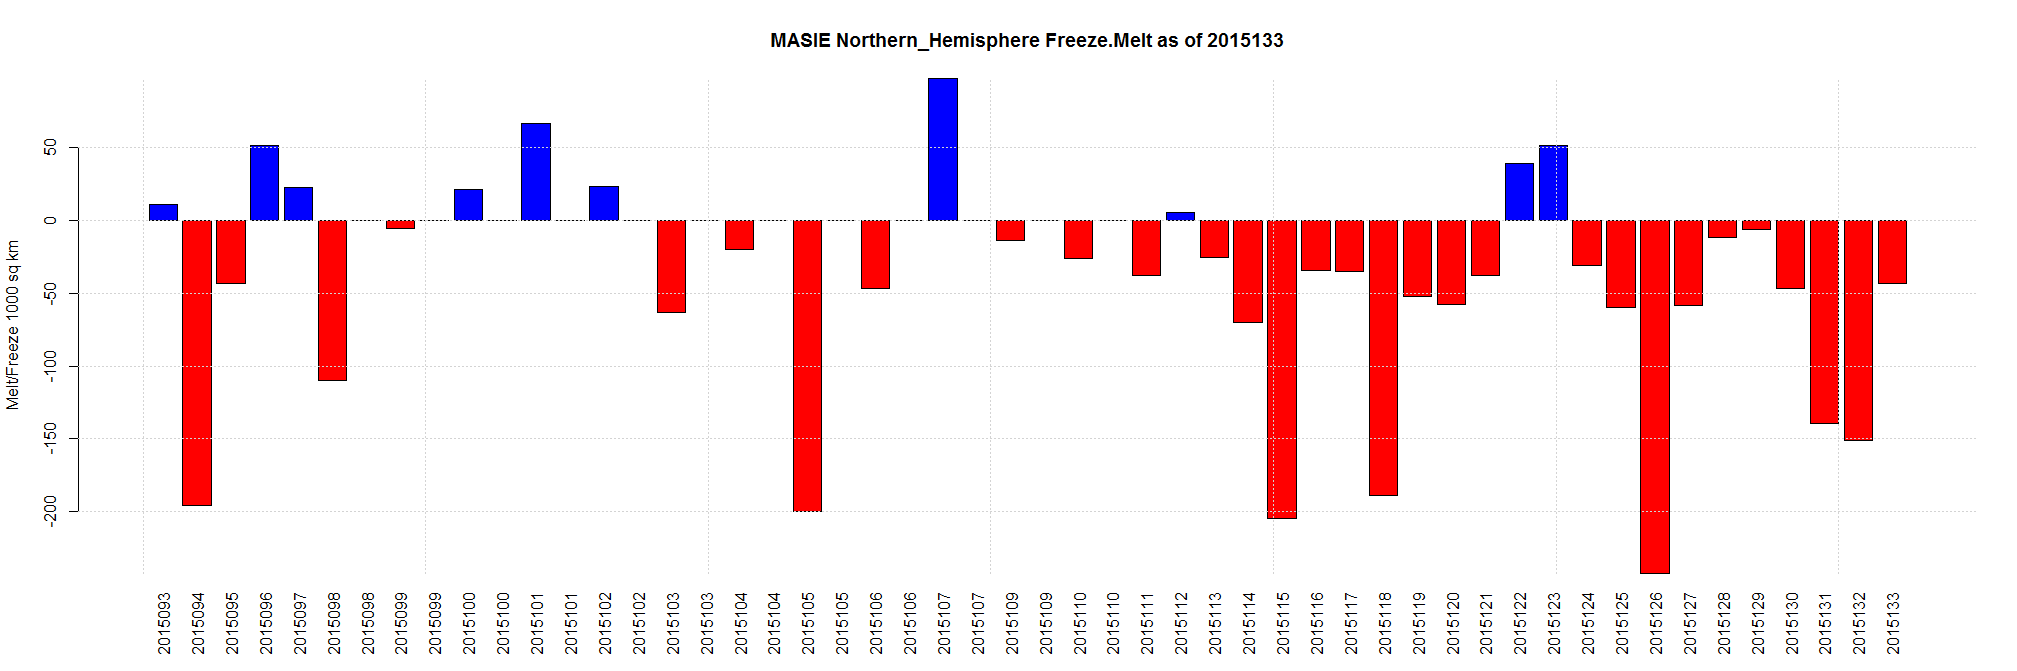
| Northern Hemisphere (Total) | 14,534,052 | 12,671,911 | -1,862,141 | -1,474,709 | -792,477 | -455,539 | -333,384 | -43,406 |
| NH (Average Loss per Day) | -35,135 | -52,668 | -56,606 | -65,077 | -111,128 | -43,406 |
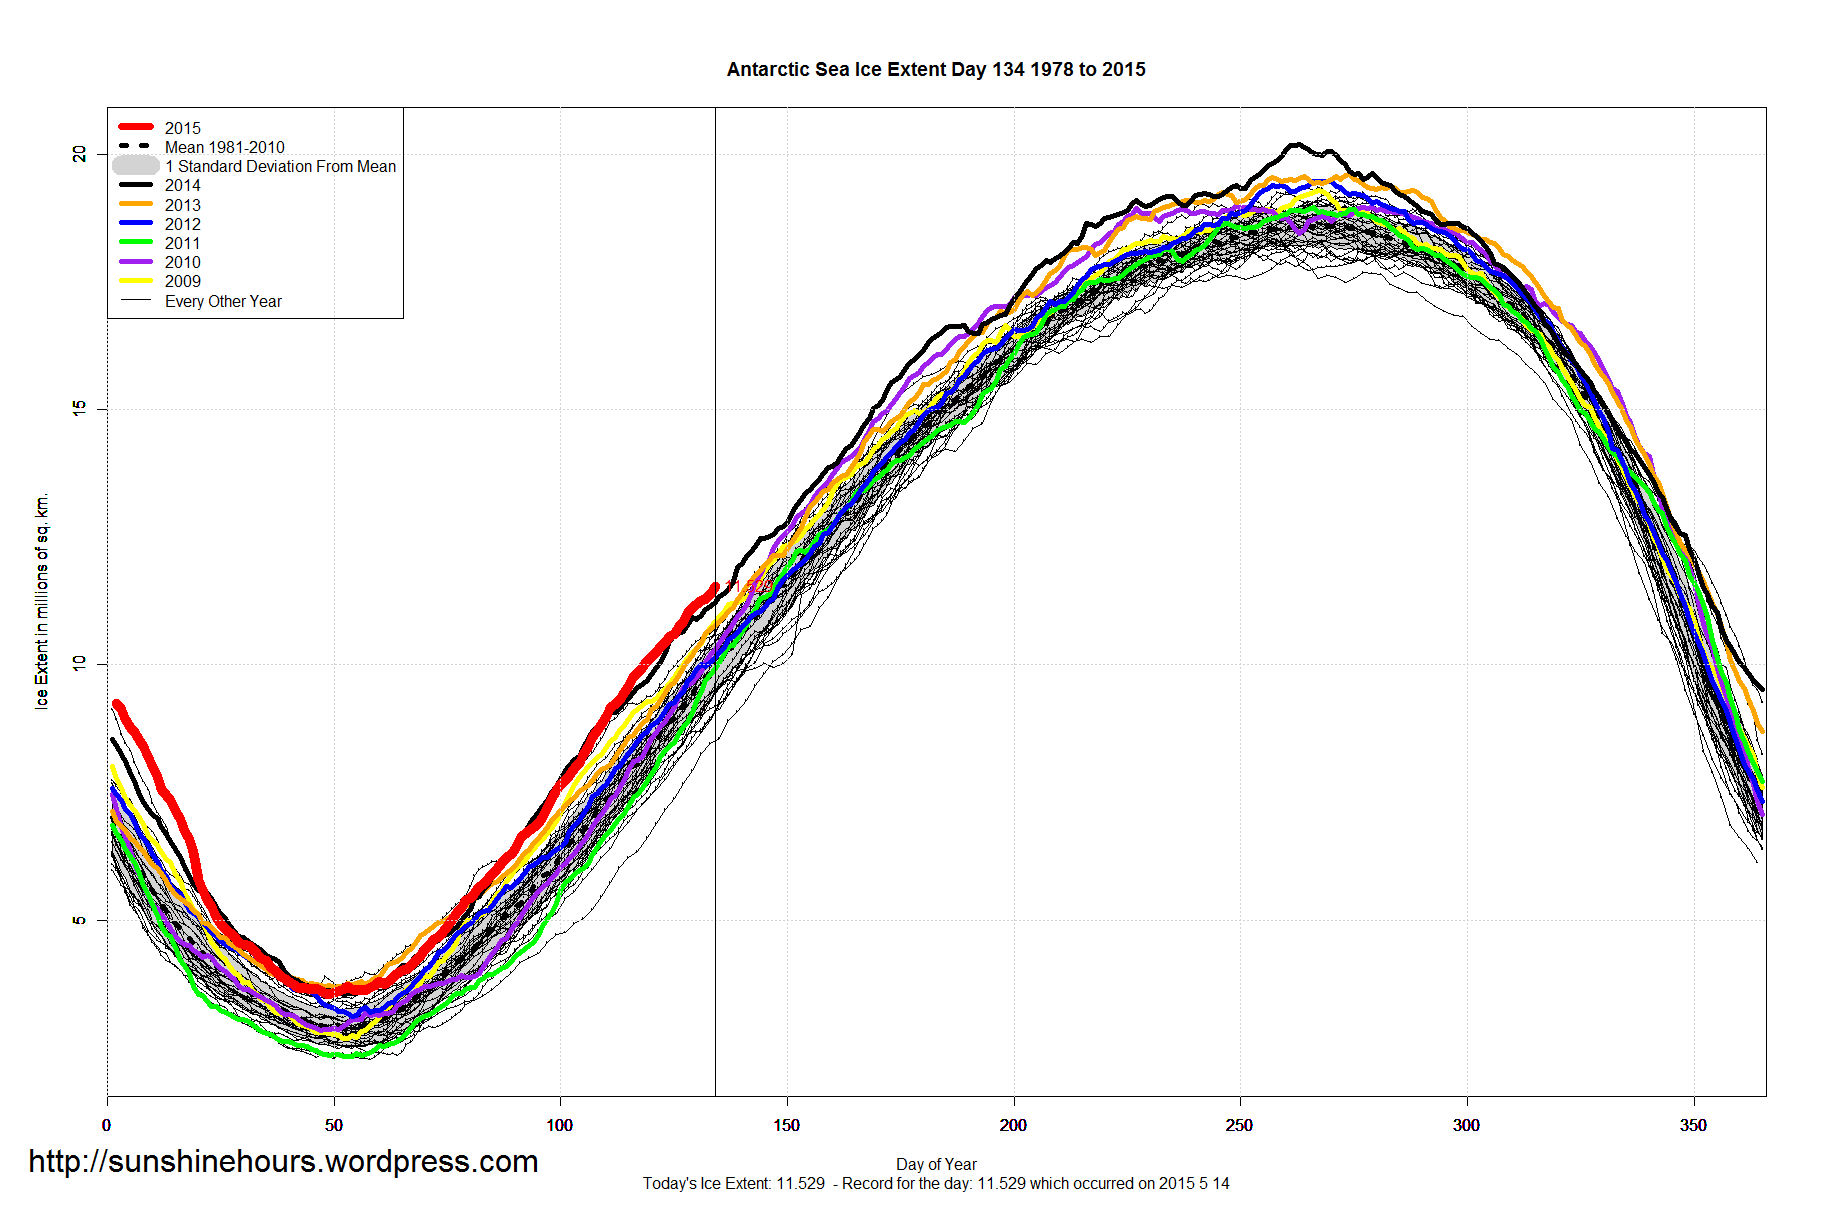
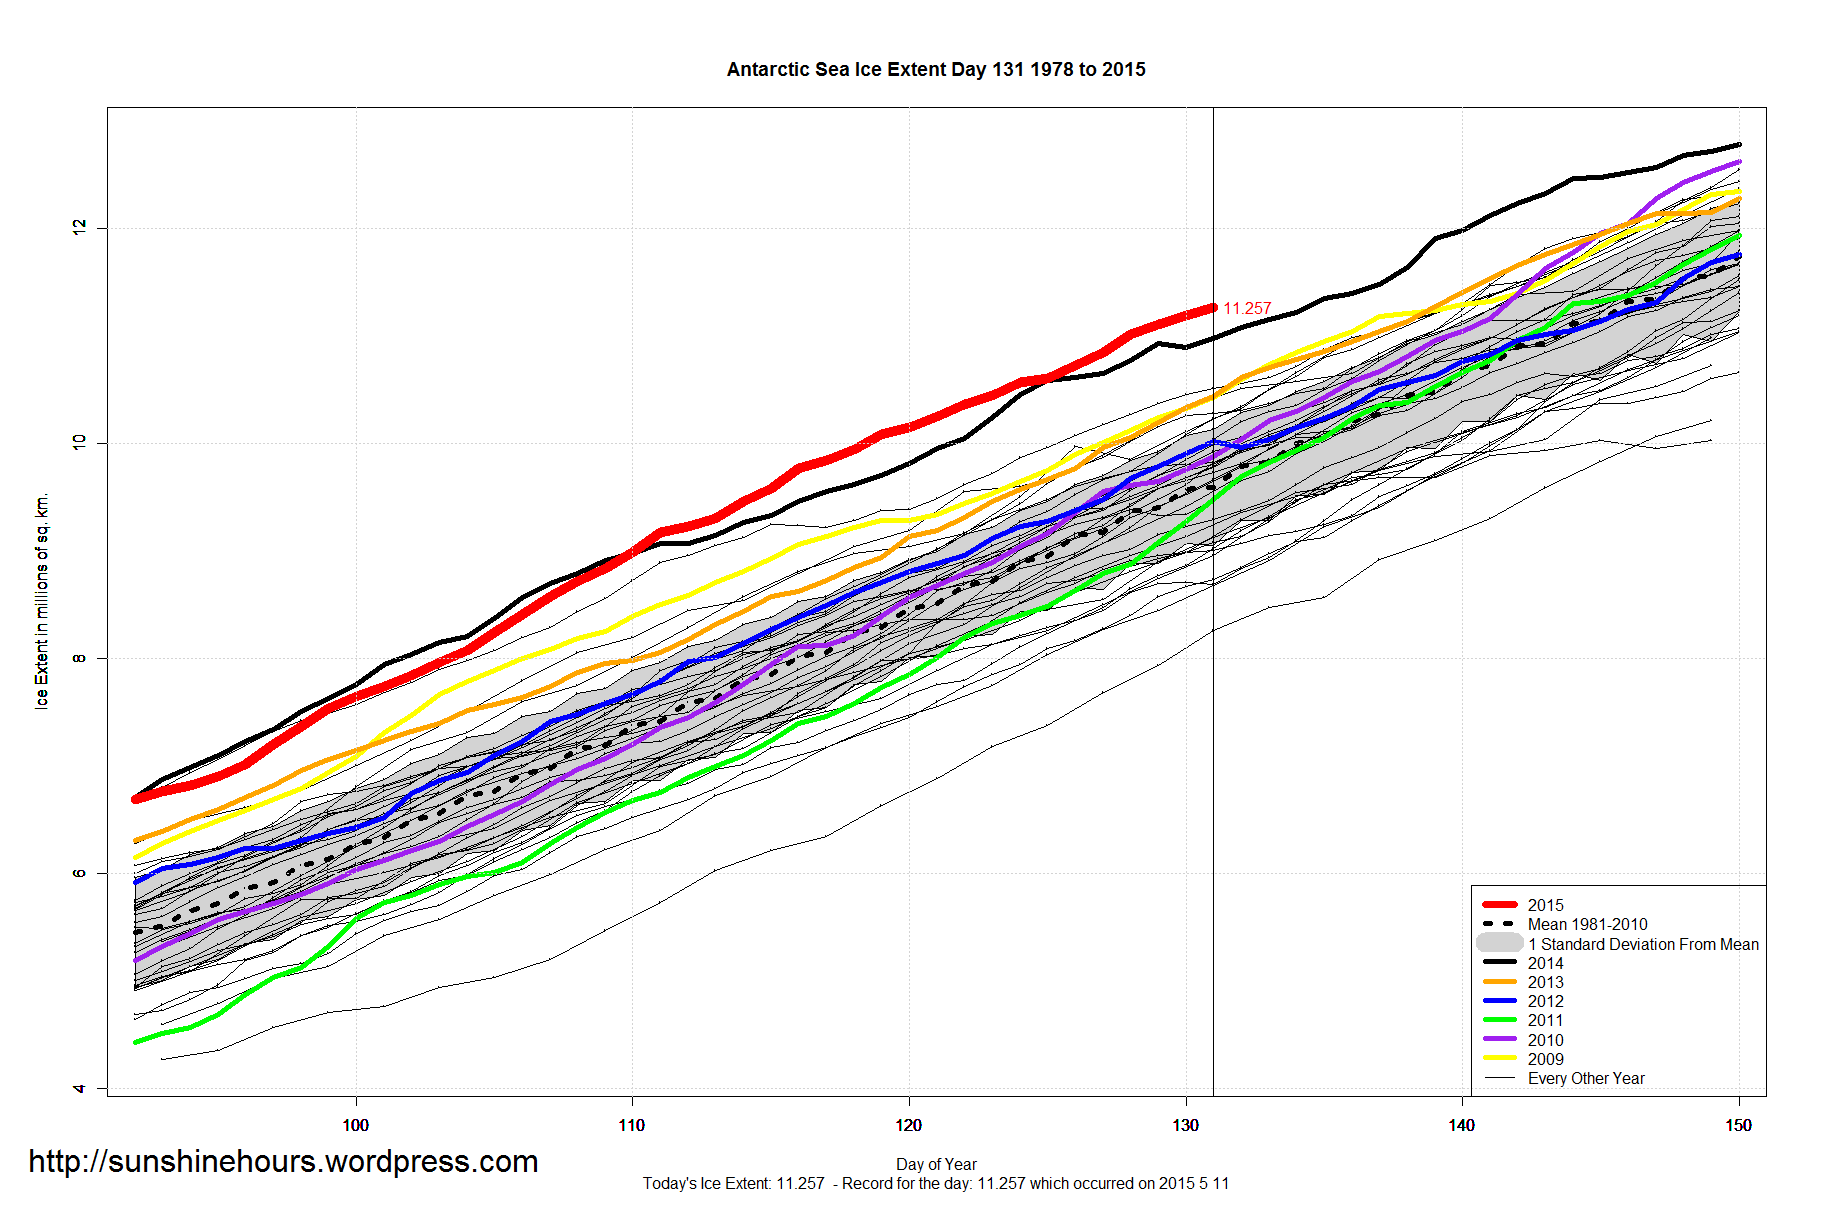
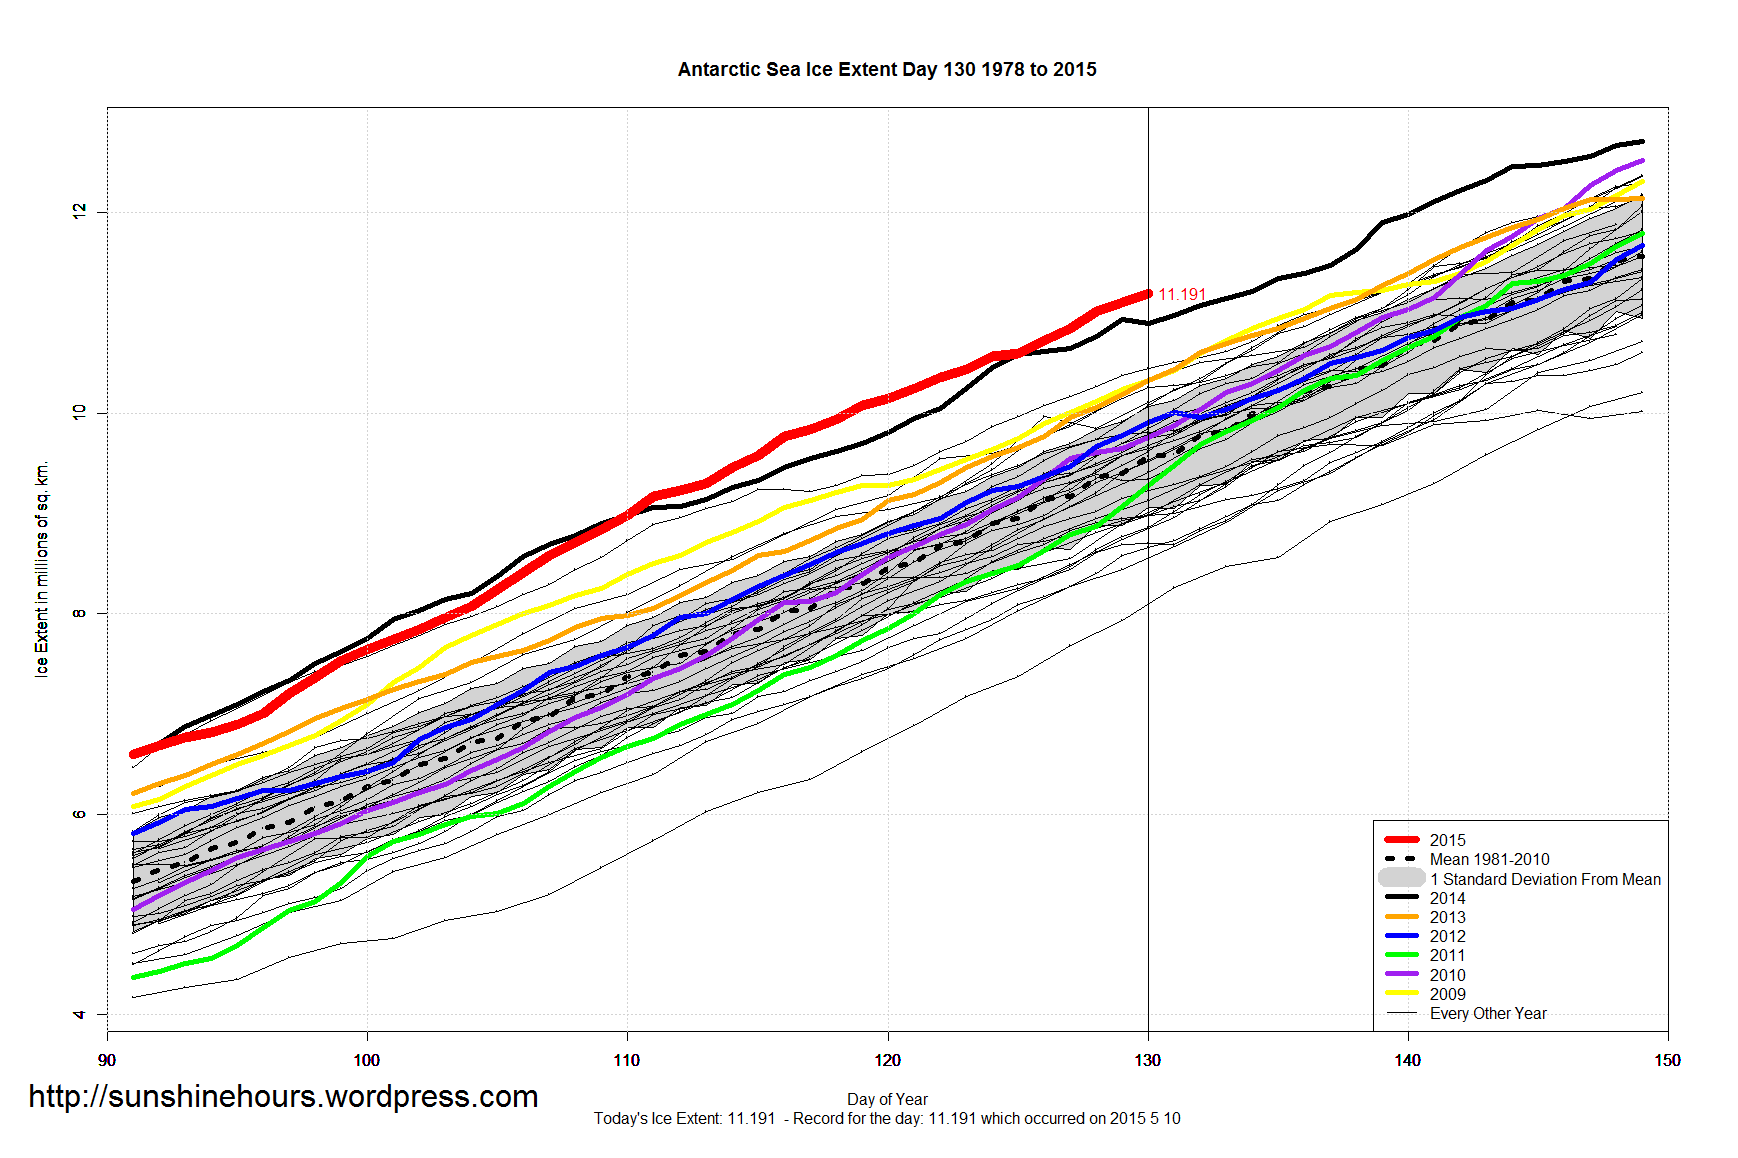
Antarctica’s Increasing Sea Ice Levels is a Worry
“THE size and power of ships needed to break through Antarctica’s increasing sea ice levels is a worry for the global research community.
In recent years countries including Australia have battled to reach their stations on the frozen continent, making resupply missions time consuming and expensive, Australian Antarctic Division spokesman Rod Wooding said.
“We’re noticing that the sea ice situation is becoming more difficult,” he told reporters on Monday.
The sea ice through the Southern Ocean and around Australia’s Mawson Station usually breaks up for a couple of months a year allowing ships to enter the bay but that did not happen in 2013-14.
“We had to get fuel in by helicopter which is inadequate for the long-term sustainability of the station,” Dr Wooding said.”Other national programs have had similar problems: the French in particular, Japanese also.””
This part is hilarious:
There is no single reason why sea ice levels are increasing but Hobart-based expert Tony Worby said it tends to gather around icebergs and wind patterns also play a part.”We know sea ice extent is increasing, there was a record maximum in September 2014,” Prof Worby said.”It’s quite hard to forecast …. “
But but …. I thougth all this stuff was easy to forecast. Just blame it on global warming!
I guess blaming more sea ice on global warming is difficult when the’ve been screaming for decades that global warming causes less sea ice.
(h/t Green Sand – thanks for the link)
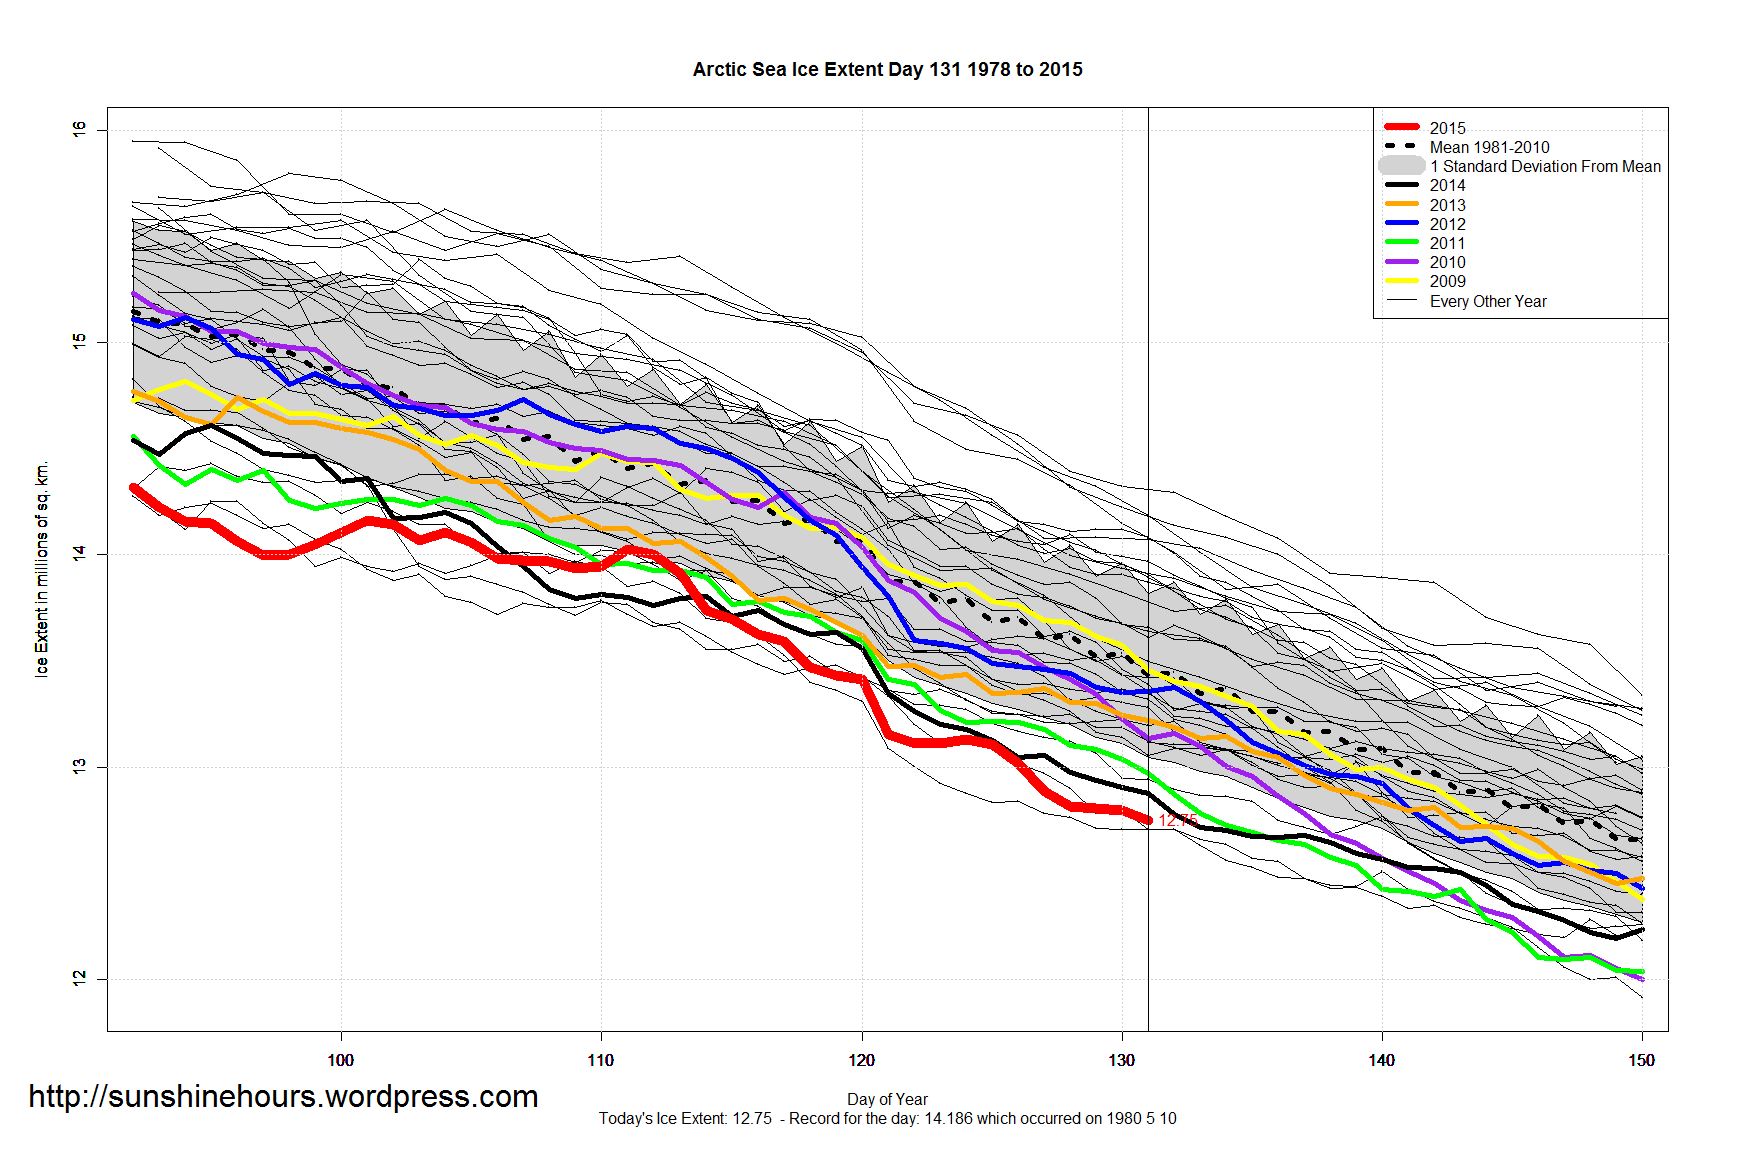
May 10 2015 MASIE Update (Arctic Sea Ice dataset frm MASIE )
| Region | 49 days ago | End | Last 48 | Last 28 | Last 14 | Last 7 | Last 3 | Last 1 |
| Baffin Bay Gulf of St. Lawrence | 1,754,107 | 1,241,475 | -512,632 | -336,440 | -268,044 | -124,820 | -23,871 | -12,691 |
| Greenland Sea | 633,474 | 605,172 | -28,302 | 25,599 | -8,324 | 18,811 | 6,648 | -644 |
| Beaufort Sea | 1,070,445 | 1,070,445 | 0 | 0 | 9,665 | 0 | 0 | 0 |
| Chukchi Sea | 966,006 | 964,706 | -1,300 | -1,300 | -1,300 | -1,216 | -1,300 | 0 |
| East Siberian Sea | 1,087,137 | 1,087,137 | 0 | 0 | 0 | 480 | 0 | 0 |
| Laptev Sea | 897,845 | 897,845 | 0 | 0 | 124 | 0 | 0 | 0 |
| Kara Sea | 935,023 | 921,538 | -13,485 | -1,387 | -9,630 | -12,584 | -225 | 0 |
| Barents Sea | 596,771 | 406,891 | -189,880 | -124 | 29,569 | -34,699 | -5,995 | 0 |
| Canadian Archipelago | 853,214 | 853,214 | 0 | 0 | 0 | 0 | 0 | 0 |
| Central Arctic | 3,247,614 | 3,246,837 | -777 | 24,625 | 13,355 | 5,924 | 3,459 | 0 |
| Baltic Sea | 9,702 | 66 | -9,636 | -12,197 | -8,236 | -4,341 | -470 | 0 |
| Yellow Sea | 0 | 0 | 0 | 0 | 0 | 0 | 0 | 0 |
| Hudson Bay | 1,260,903 | 1,259,379 | -1,524 | -1,243 | 13,785 | 28,464 | 23,611 | 849 |
| Bering Sea | 667,281 | 268,267 | -399,014 | -383,073 | -313,698 | -133,110 | -32,240 | 3,277 |
| Sea of Okhotsk | 551,895 | 227,473 | -324,422 | -357,796 | -179,407 | -99,063 | -44,682 | 3,286 |
| Northern Hemisphere (Total) | 14,534,052 | 13,051,968 | -1,482,084 | -1,043,769 | -722,557 | -356,570 | -75,482 | -5,922 |
| NH (Average Loss per Day) | -30,247 | -37,277 | -51,611 | -50,939 | -25,161 | -5,922 |