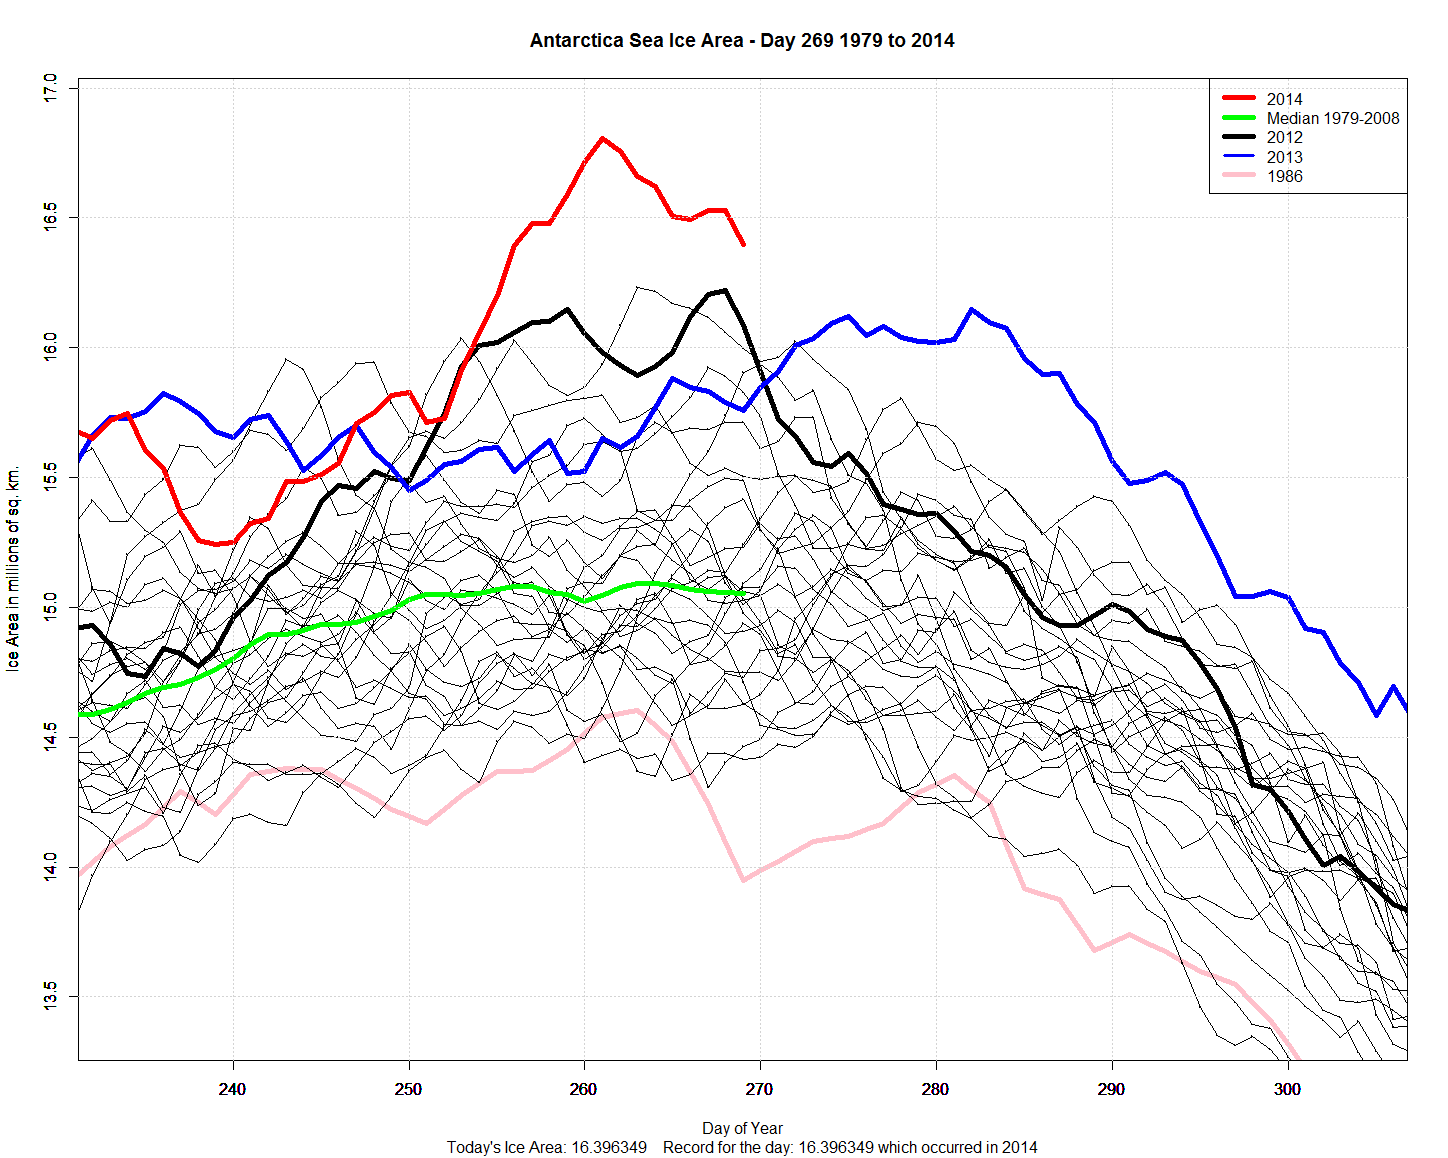
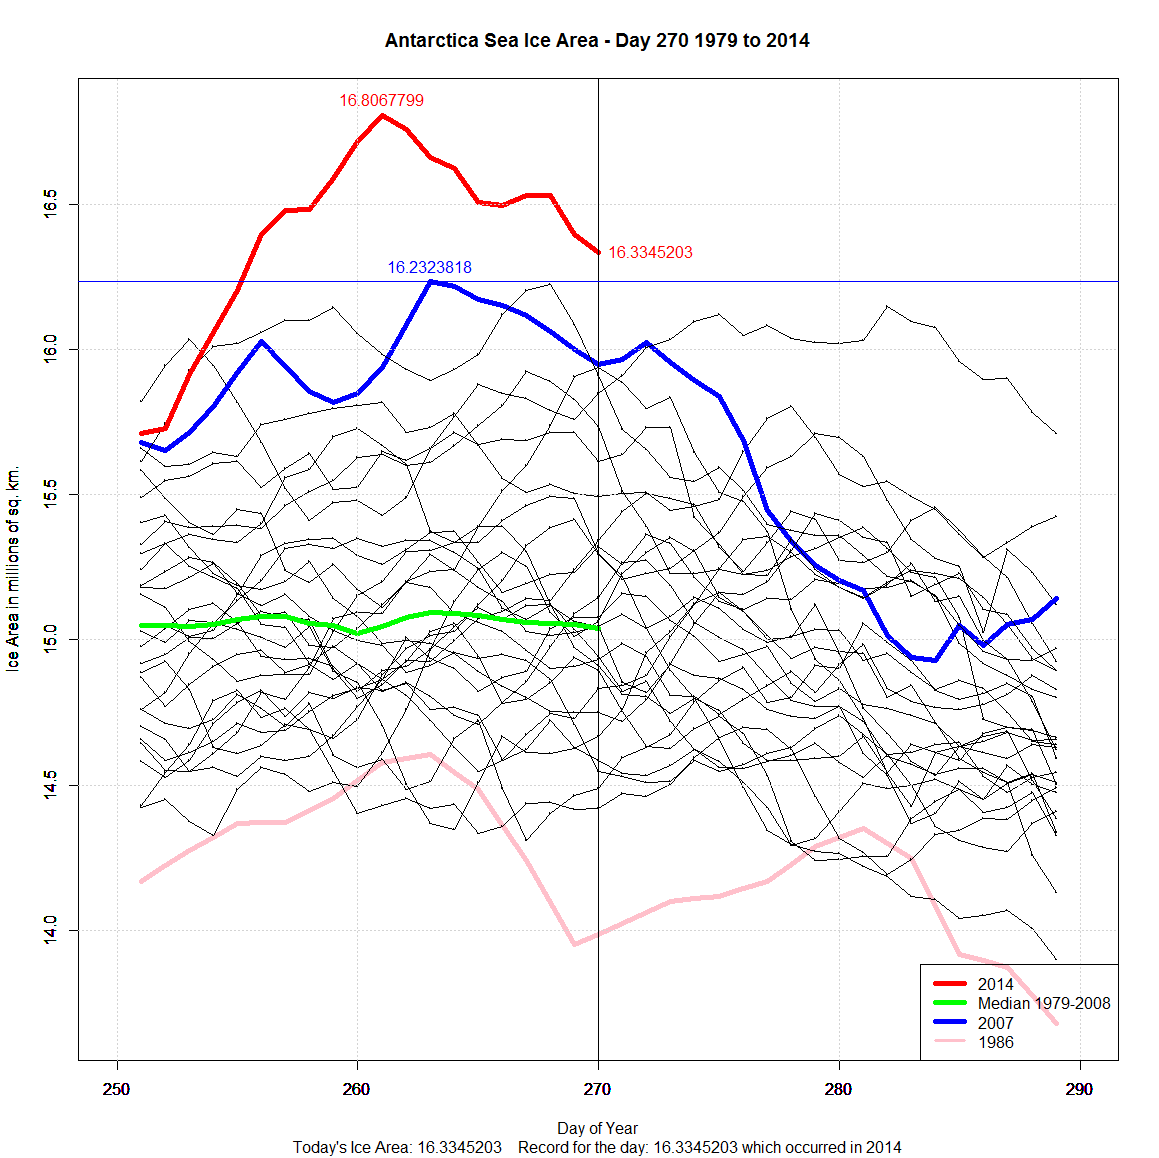
Antarctic Sea Ice Area (difference between Area/Extent here). Data for Area here.
15th day above the year with the previous all-time Area record – 2007.
Antarctic Sea Ice Extent Sep 29 2014 – 1,376,000 sq km above the 1981-2010 mean. Data for Day 271. Data here.
188th daily record in 2014.


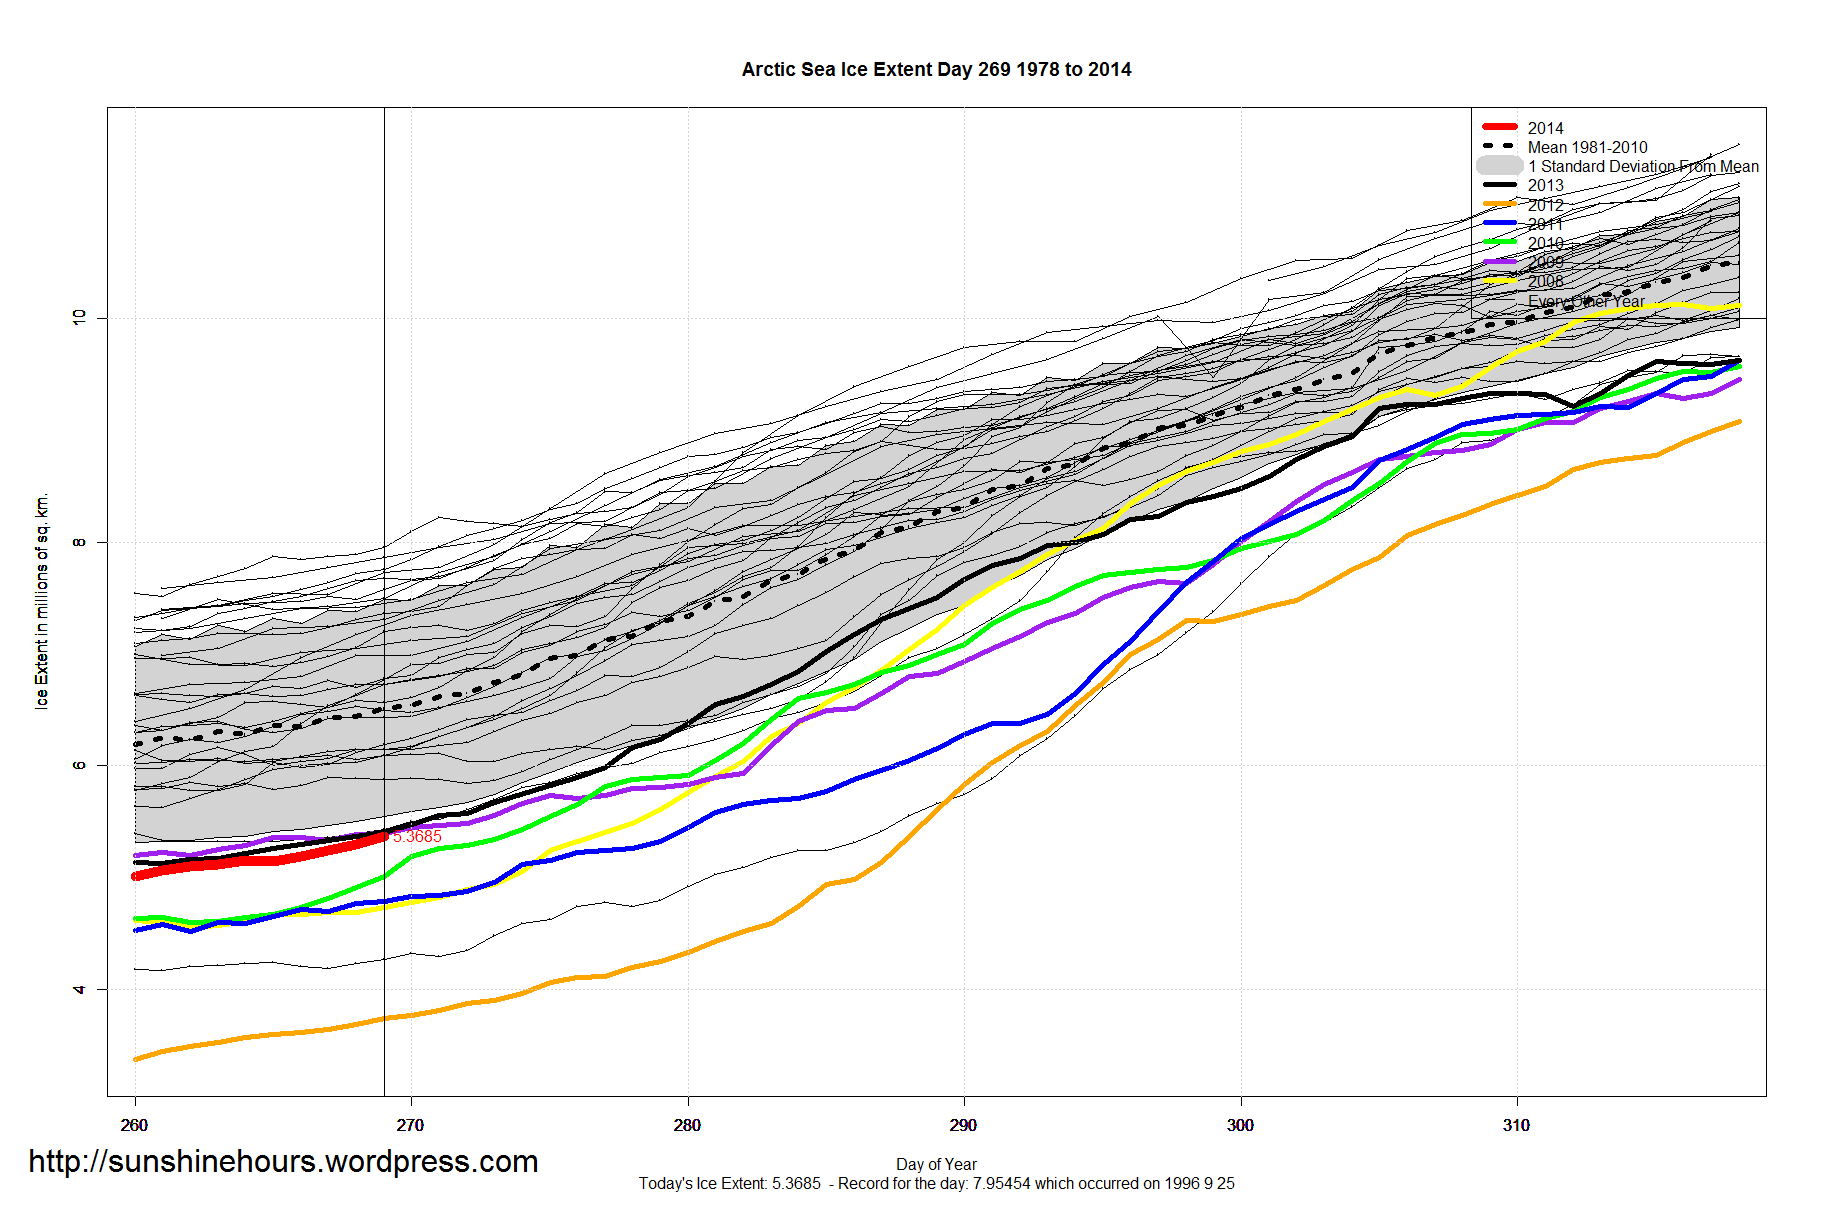
Arctic Sea Ice Extent Sep 28 2014 – -1,202,000 sq km below the 1981-2010 mean. Data for Day 270. Data here.


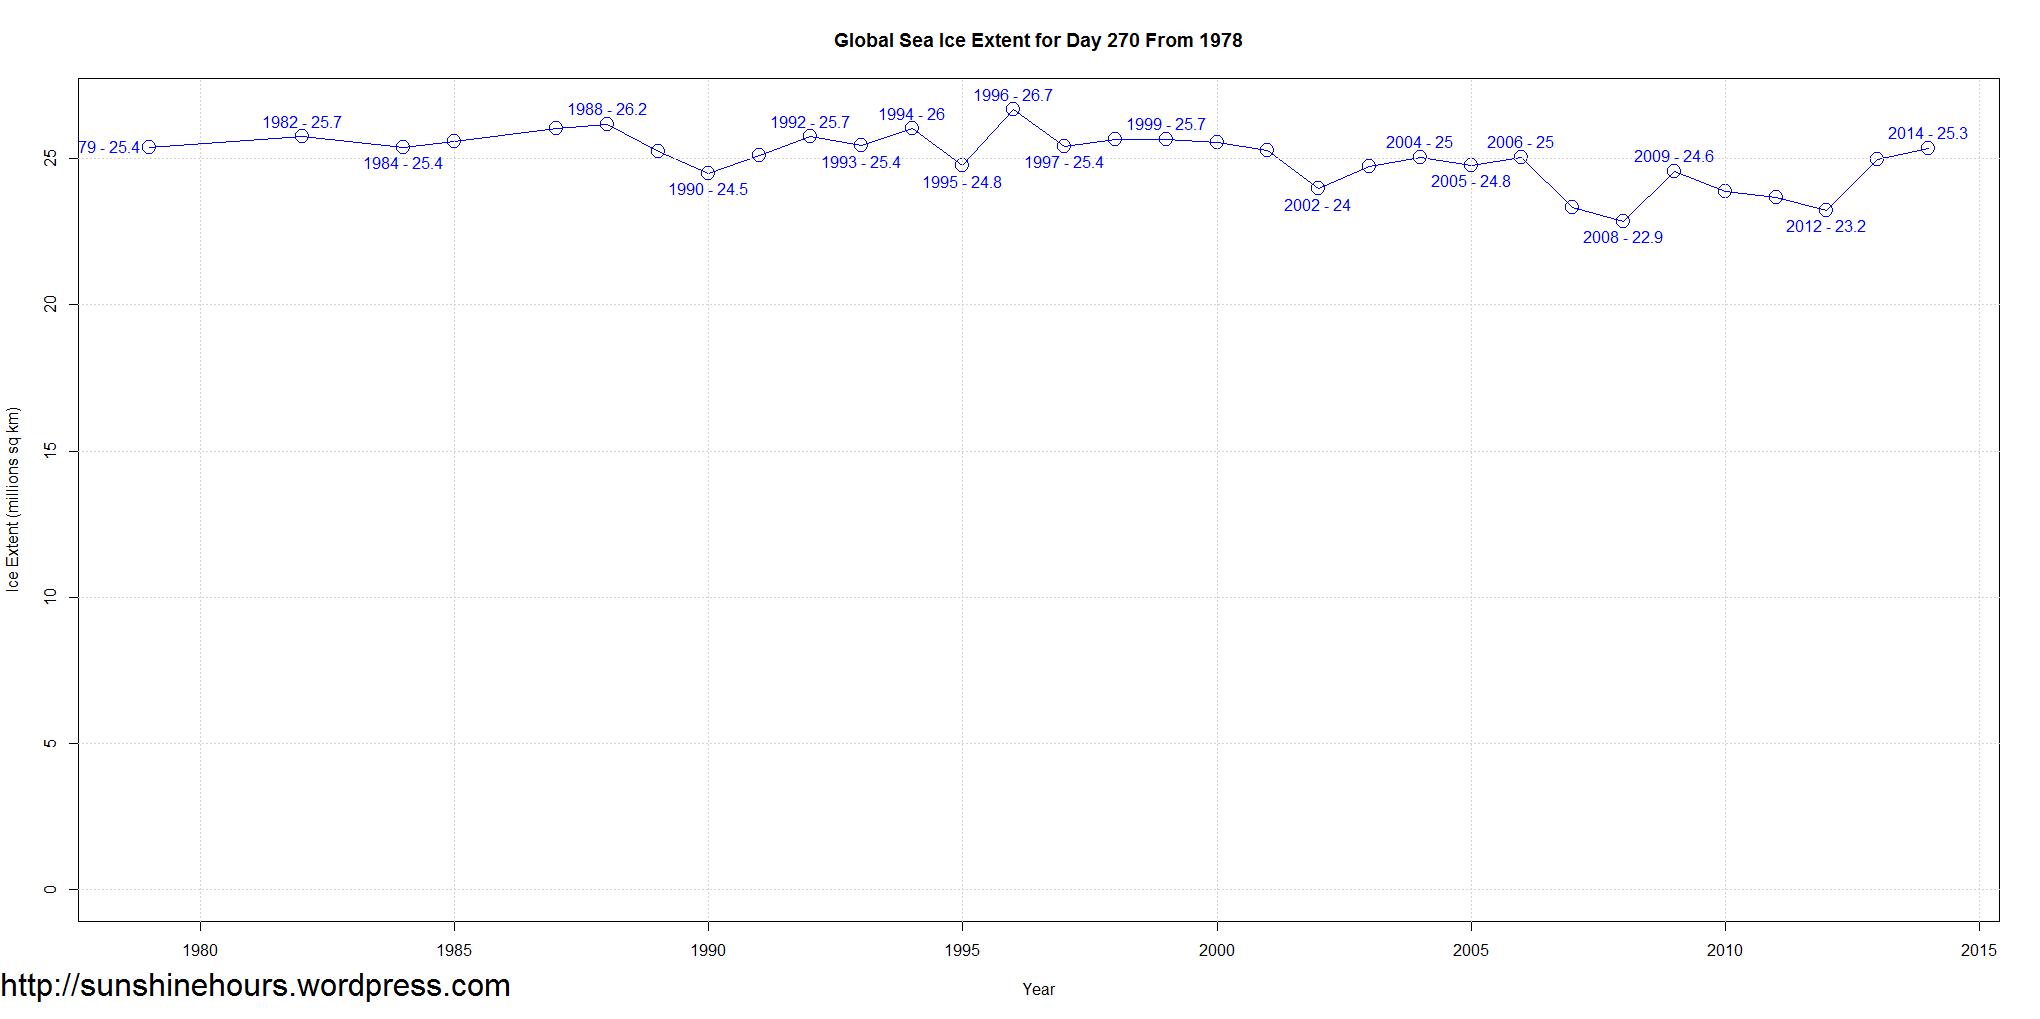
Global Sea Ice Extent Sep 28 2014 – 229,000 sq km above the 1981-2010 mean. Data for Day 270. Data here.
Global Sea Ice Extent for day 270 if you show the full x and y axis.


Antarctic Sea Ice Extent Sep 28 2014 – 1,431,000 sq km above the 1981-2010 mean. Data for Day 270. Data here.
8th day above 20 million sq km. Only 5,000 below day 269.


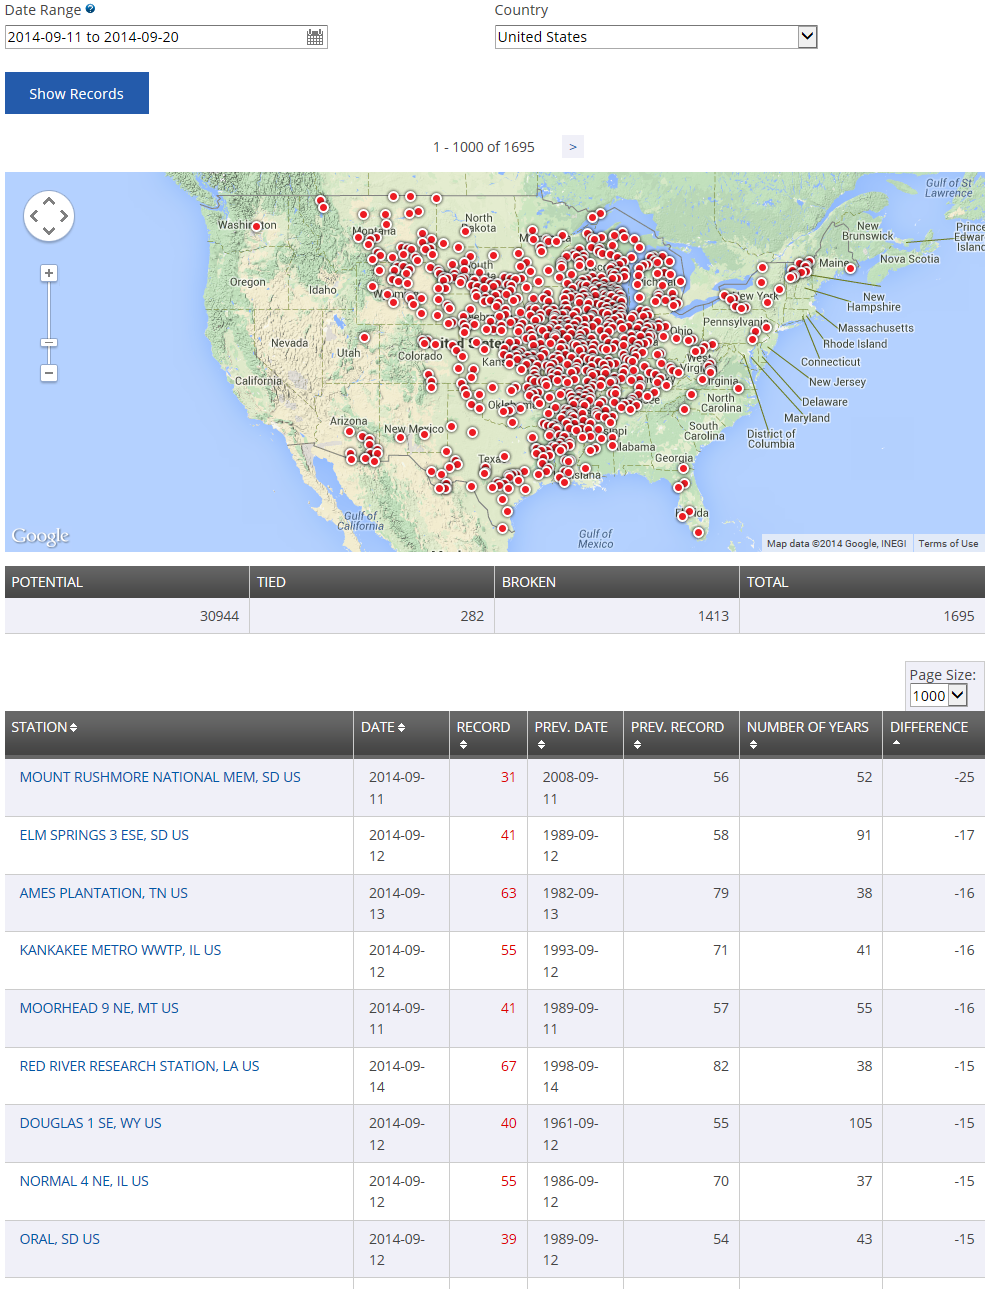
Wow. One record was broken by 25F!!!!
1695 Low Max Records Broken or Tied From Sept 11 to Sept 20 according to the NOAA.
A “Low Max” means that the maximum temperatures for the day was the lowest it has ever been. This indicates daytime cooling.
Below is a screenshot showing location and the biggest difference between old record and new record.
The list is just the ones I could capture in a screenshot.
Arctic Sea Ice Extent Sep 27 2014 – -1,146,000 sq km below the 1981-2010 mean. Data for Day 269. Data here.

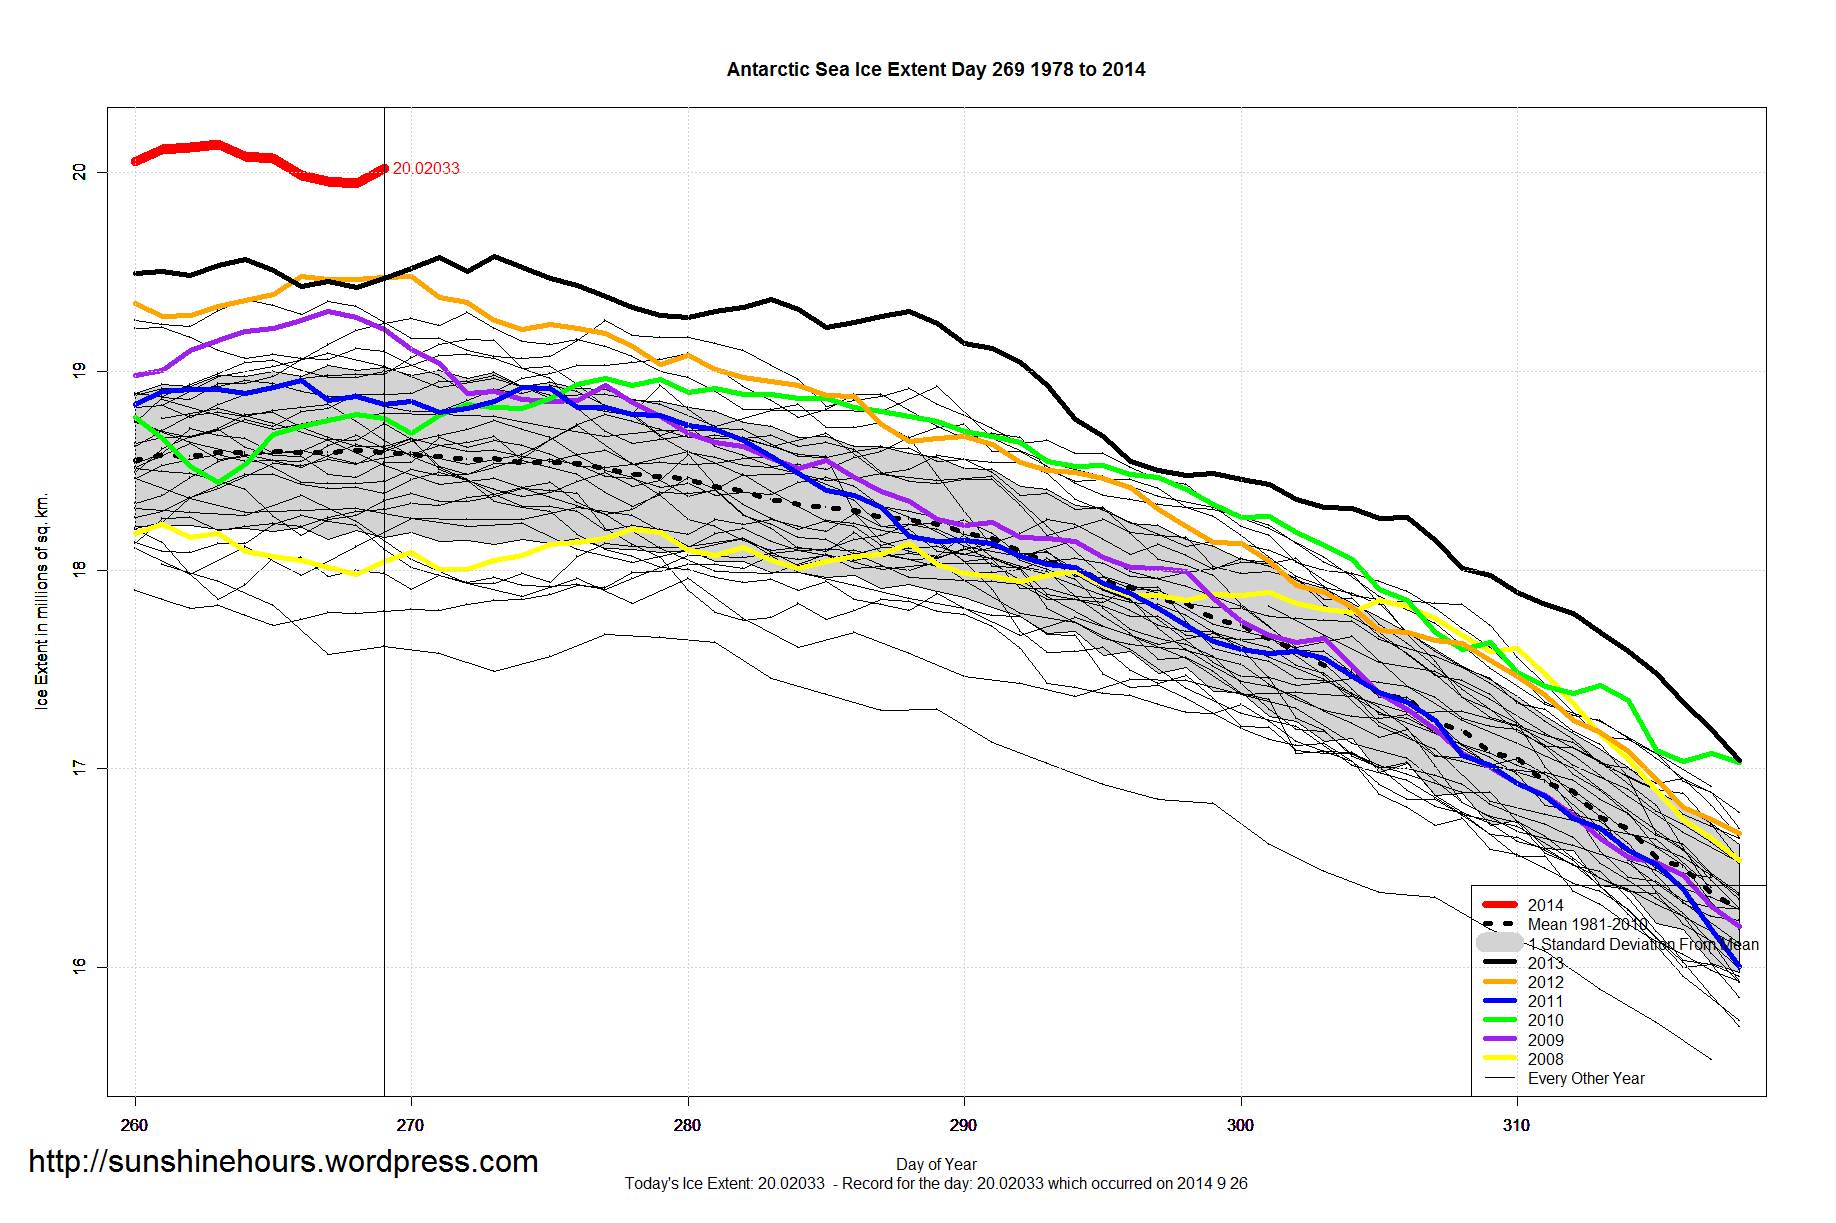
Antarctic Sea Ice Extent Sep 27 2014 – 1,429,000 sq km above the 1981-2010 mean. Data for Day 269. Data here.
7th highest of all-time. Up 80,000 and Above 20 million sq km Again