Quick Robin … To The Bat Chopper

It’s not really funny is it …

“BOULDER, Colo., Nov. 8 (UPI) — Wind turbines killed at least 600,000 — and possibly as many as 900,000 — bats in the United States in 2012, researchers say.

Writing in the journal BioScience, the researchers said they used sophisticated statistical techniques to infer the probable number of bat deaths at wind energy facilities from the number of dead bats found at 21 locations.”

http://www.breitbart.com/Big-Government/2013/11/09/Wind-turbines-blamed-in-death-of-estimated-600-000-bats-in-2012

The problem with the above article is that it probably grossly underestimates bat deaths considering the deaths of bird and bats found in Spain.

“The Spanish Ornithological Society in Madrid estimates that Spain’s 18,000 wind turbines may be killing 6 million to 18 million birds and bats annually. “A blade will cut a griffon vulture in half,” says Bechard. “I’ve seen them just decapitated.”

http://www.nature.com/news/the-trouble-with-turbines-an-ill-wind-1.10849

Hometown Max Temperature – Days Over 25C / 30C / 35C

A couple of days ago I did a post about the days over 30C in the HADCET maximum daily temperature dataset.

Warmists have claimed we are all going to die in heatwaves. The HADCET doesn’t show that.

So I thought I would look at the same data for my hometown on the west coast. The data only starts in the late 1940s.

Here are three histograms of the daily maximum temperature over 35C , 30C and 25C.  Nothing to worry about. Unless you plan to time travel to the 1960s or 1970s..

Click for larger.

Hometown_Days_Over_30C

So then I thought … what about early warm days and late warm days. By that I meant before June and after September.

There were no days over 35C that occurred early/late. And the years that stood out were the 1950s.

Hometown_Days_Over_30C EarlyLate

Biofuels Kill

“Based on current technologies, higher biofuel production
necessarily means greater diversion of crops and/or cropland to
the production of fuel rather than food. The iron law of supply
and demand dictates that this would almost unavoidably
increase global food prices over what they would otherwise be.”


“Results derived from World Bank and World Health Organization (WHO)
studies suggest that for every million people living in absolute
poverty in developing countries, there are annually at least 5,270
deaths and 183,000 Disability-Adjusted Life Years (DALYs) lost to
disease. Combining these estimates with estimates of the
increase in poverty owing to growth in biofuels production over
2004 levels leads to the conclusion that additional biofuel
production may have resulted in at least 192,000 excess deaths
and 6.7 million additional lost DALYs in 2010. These exceed
WHO’s estimated annual toll of 141,000 deaths and 5.4 million
lost DALYs attributable to global warming.


Thus, policies intended to mitigate global warming may actually have increased death and disease in developing countries.”

Journal of American Physicians and Surgeons Volume 16 Number 1 Spring 2011

( Hat tip to commenter David L Hagen from here. )


HADCET Maximum Temperature – Days over 30C

HADCET Daily Maximum data is available from 1878 on. There were 45 days over 30C since 1878.

I think we can agree that the AGW Cult insists we are all going to die because of massive heat waves.

Of the 45 days 30C and over, 5 occurred from 2003 to 2006, none after 2006.

6 occurred in the 1940s.

14 occurred in the 1970s – 9 of which occurred in 1976 alone.

Is death by heatwave imminent in the area covered by HADCET? I think not. And then there is the matter of UHI …

Year Month Day MAX TEMP
1878 6 26 30
1906 8 31 30.4
1906 9 1 31
1906 9 2 31.3
1911 8 9 31.5
1911 8 13 30.1
1921 7 10 30.1
1923 7 12 31.1
1923 7 13 30.6
1930 8 27 30.2
1932 8 19 30.3
1943 7 31 30.9
1947 6 2 30
1948 7 28 30.8
1948 7 29 31.6
1948 7 30 30.5
1949 7 12 30.2
1970 7 7 30.1
1975 8 3 30.3
1975 8 4 31.9
1975 8 7 31
1975 8 8 31.1
1976 6 28 30.3
1976 6 29 30.1
1976 7 1 30.6
1976 7 2 31.8
1976 7 3 33.2
1976 7 4 31.4
1976 7 5 31.4
1976 7 6 31.6
1976 7 7 30.4
1984 7 8 30
1990 8 2 32.8
1990 8 3 33.2
1995 7 31 30.2
1995 8 1 31.9
1995 8 2 31.4
1995 8 3 30.3
1995 8 11 30.3
1997 8 10 30.3
2003 7 15 31.1
2003 8 9 32.8
2006 7 18 30.9
2006 7 19 32.9
2006 7 25 30.2

HADCET October 2013 – Very Warm

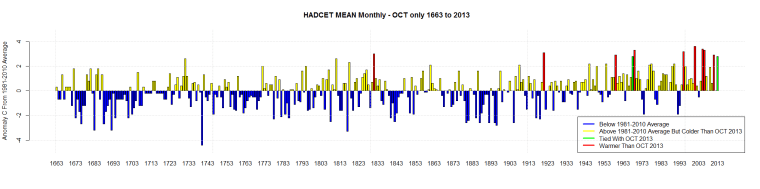
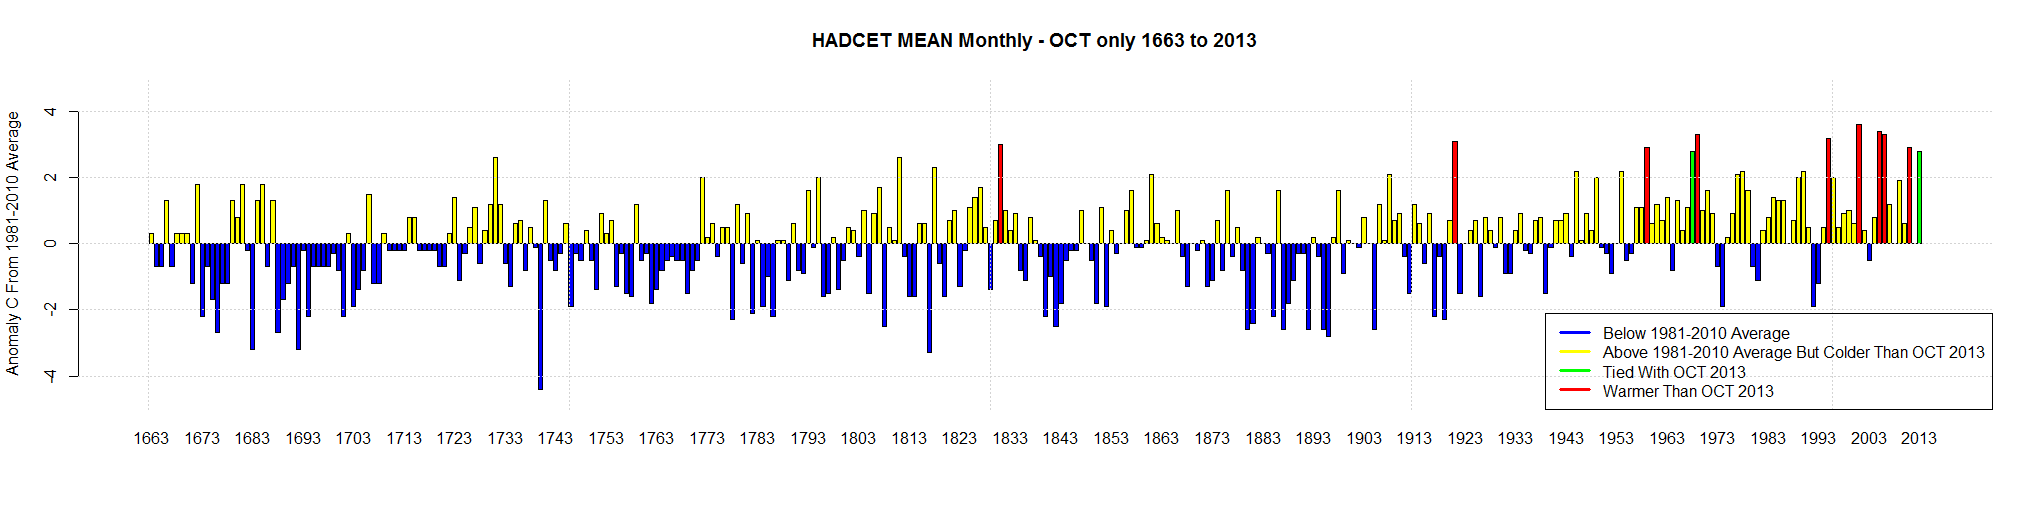
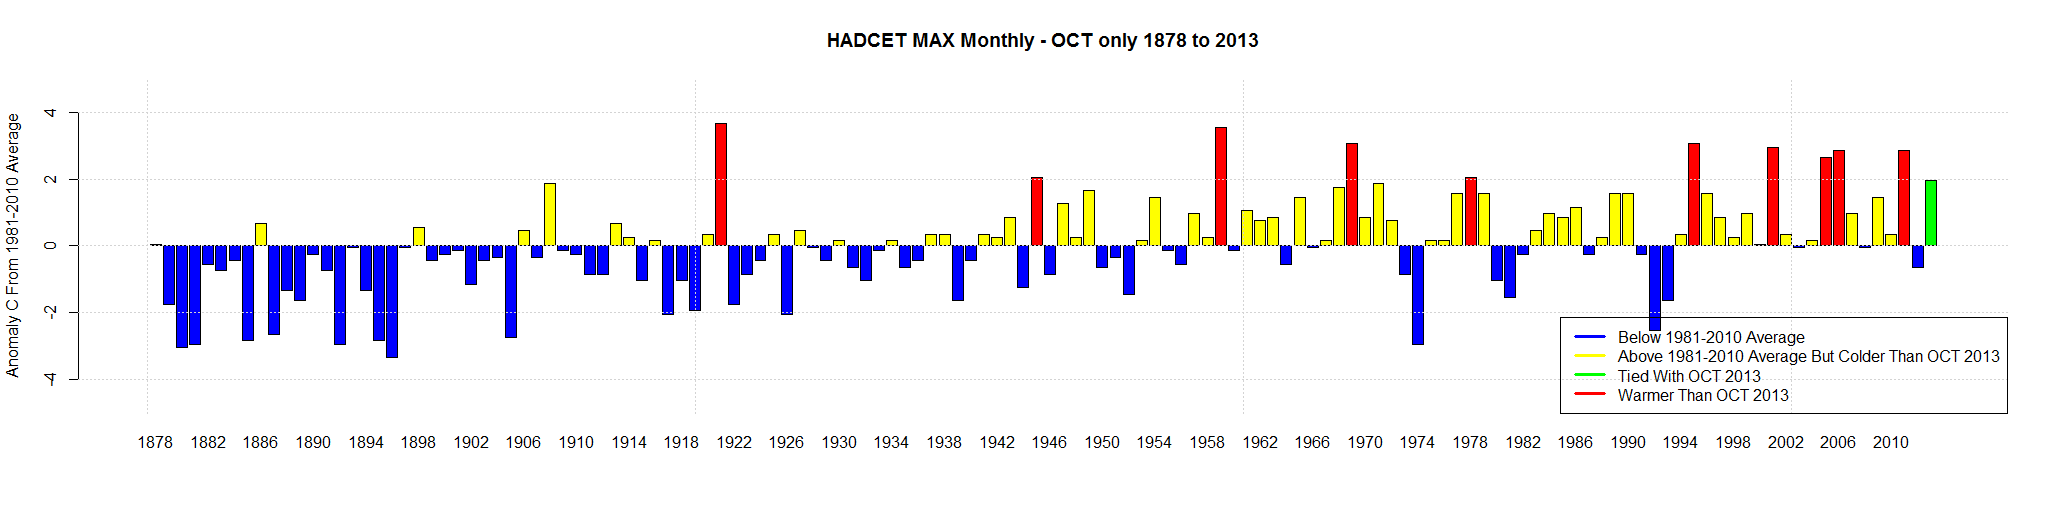
 HADCET (Central England Temperature) October 2013 was a warm one, unlike September.

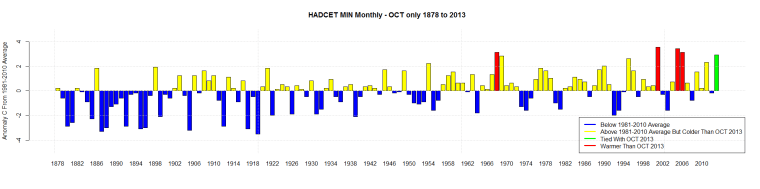
I have 3 graphs for you. They are HADCET Mean, Min and Max. The Min and Max HADCET data is only available from 1878 on.

October 2013 is tied for 10th warmest using the Mean data, 11th warmest using the Max data, and 5th warmest using the Min data.

For the Max data, 1921,1959,1969,1995,2001,2006,2011,2005,1945 and 1978 Octobers were warmer  than October 2013.

Amazingly, October 1921 was 1.7C warmer than 2013 using Max data. Click on graphs to make bigger.

HADCET MEAN Monthly - OCT only 1663 to 2013

HADCET MIN Monthly - OCT only 1878 to 2013

HADCET MAX Monthly - OCT only 1878 to 2013

92nd Daily Record For Antarctic Sea Ice (NSIDC Data Returns Edition)

The 92nd daily record for Antarctic Sea Ice occurred on November 4th (day 308).

As predicted, 1998’s two records no longer exist. And there are now only 2 daily records  from before 2000.

There are 57 days left in the year, I think 2013 can catch 2010 for number of daily records in a year. Catching 2008 will be harder, but not impossible.

Year No of Records
2008 125
2010 101
2013 92
2007 21
2009 8
2012 8
2000 4
2004 3
1979 2
2005 1
2006 1

Antarctic_Sea_Ice_Extent_Zoomed_2013_Day_308_1981-2010

Antarctic_Sea_Ice_Extent_2013_Day_308_1981-2010

Temperature Trend By Julian Day

I live on the west coast. Out of idle curiosity I wondered what would happen if I took the Tmax daily data for my hometown since 1998 and graphed the Trend (in C/decade) by Julian day.

The trends go from -4.4C/decade all the way up to 5.4C/decade. The mean of all the julian day trends is -0.28C/Decade

TMAX Trend Since 1998 By Julian Day

If I graph the data since 1980. The mean of all the julian day trends is +.05C/Decade

TMAX Trend Since 1980 By Julian Day