IPCC AR5 Admits They Have No Clue About the Arctic and the Antarctic

From the leaked AR5 Summary:
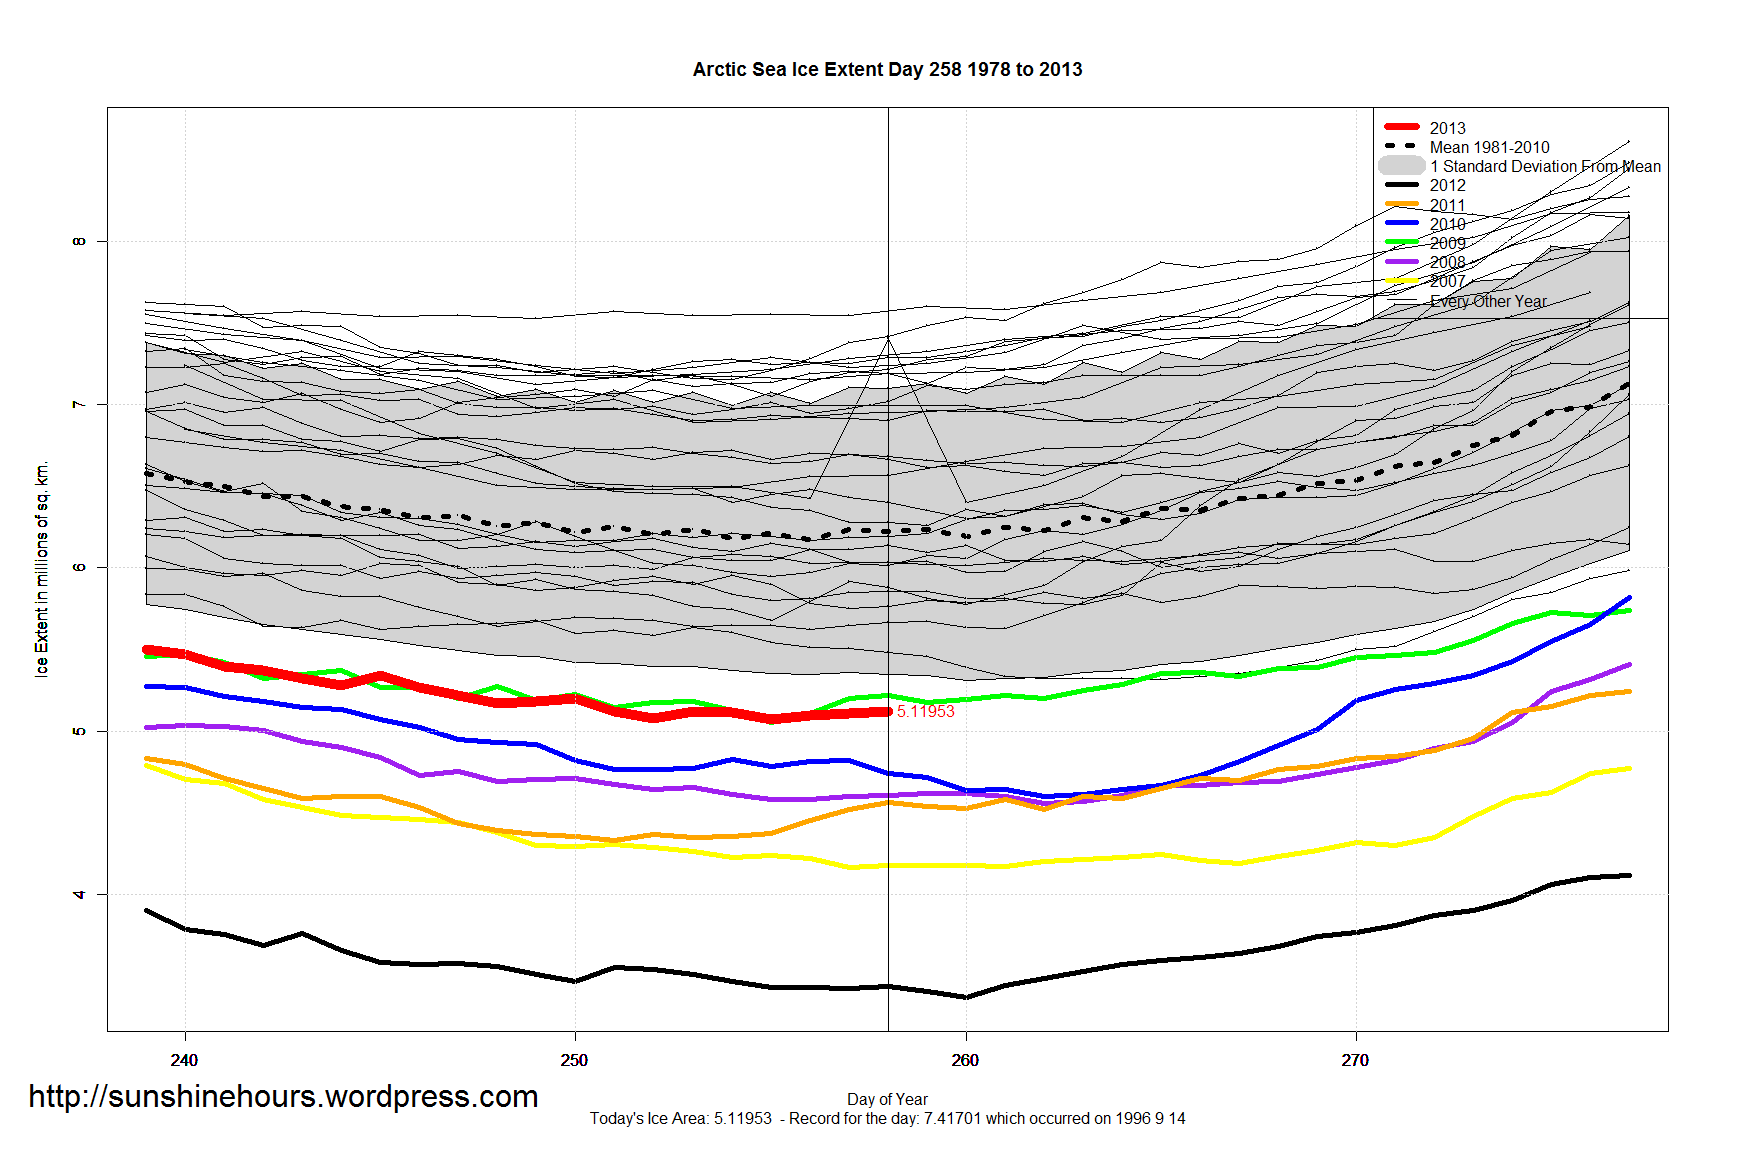
There is robust evidence that the downward trend in Arctic summer sea ice extent since 1979 is now better simulated than at the time of the AR4, with about one-quarter of the models showing a trend as large as, or larger than, the trend in the observations. Most models simulate a small decreasing trend in  Antarctic sea ice extent, albeit with large inter-model spread, in contrast to the small increasing trend in 30 observations. {9.4.3}

“one-quarter of the models showing a trend as large as, or larger than, the trend in the observations”

Translation: 75% of the models were wrong about Arctic Sea Ice. But we’ll claim we got it right when we only got it right 25% of the time.

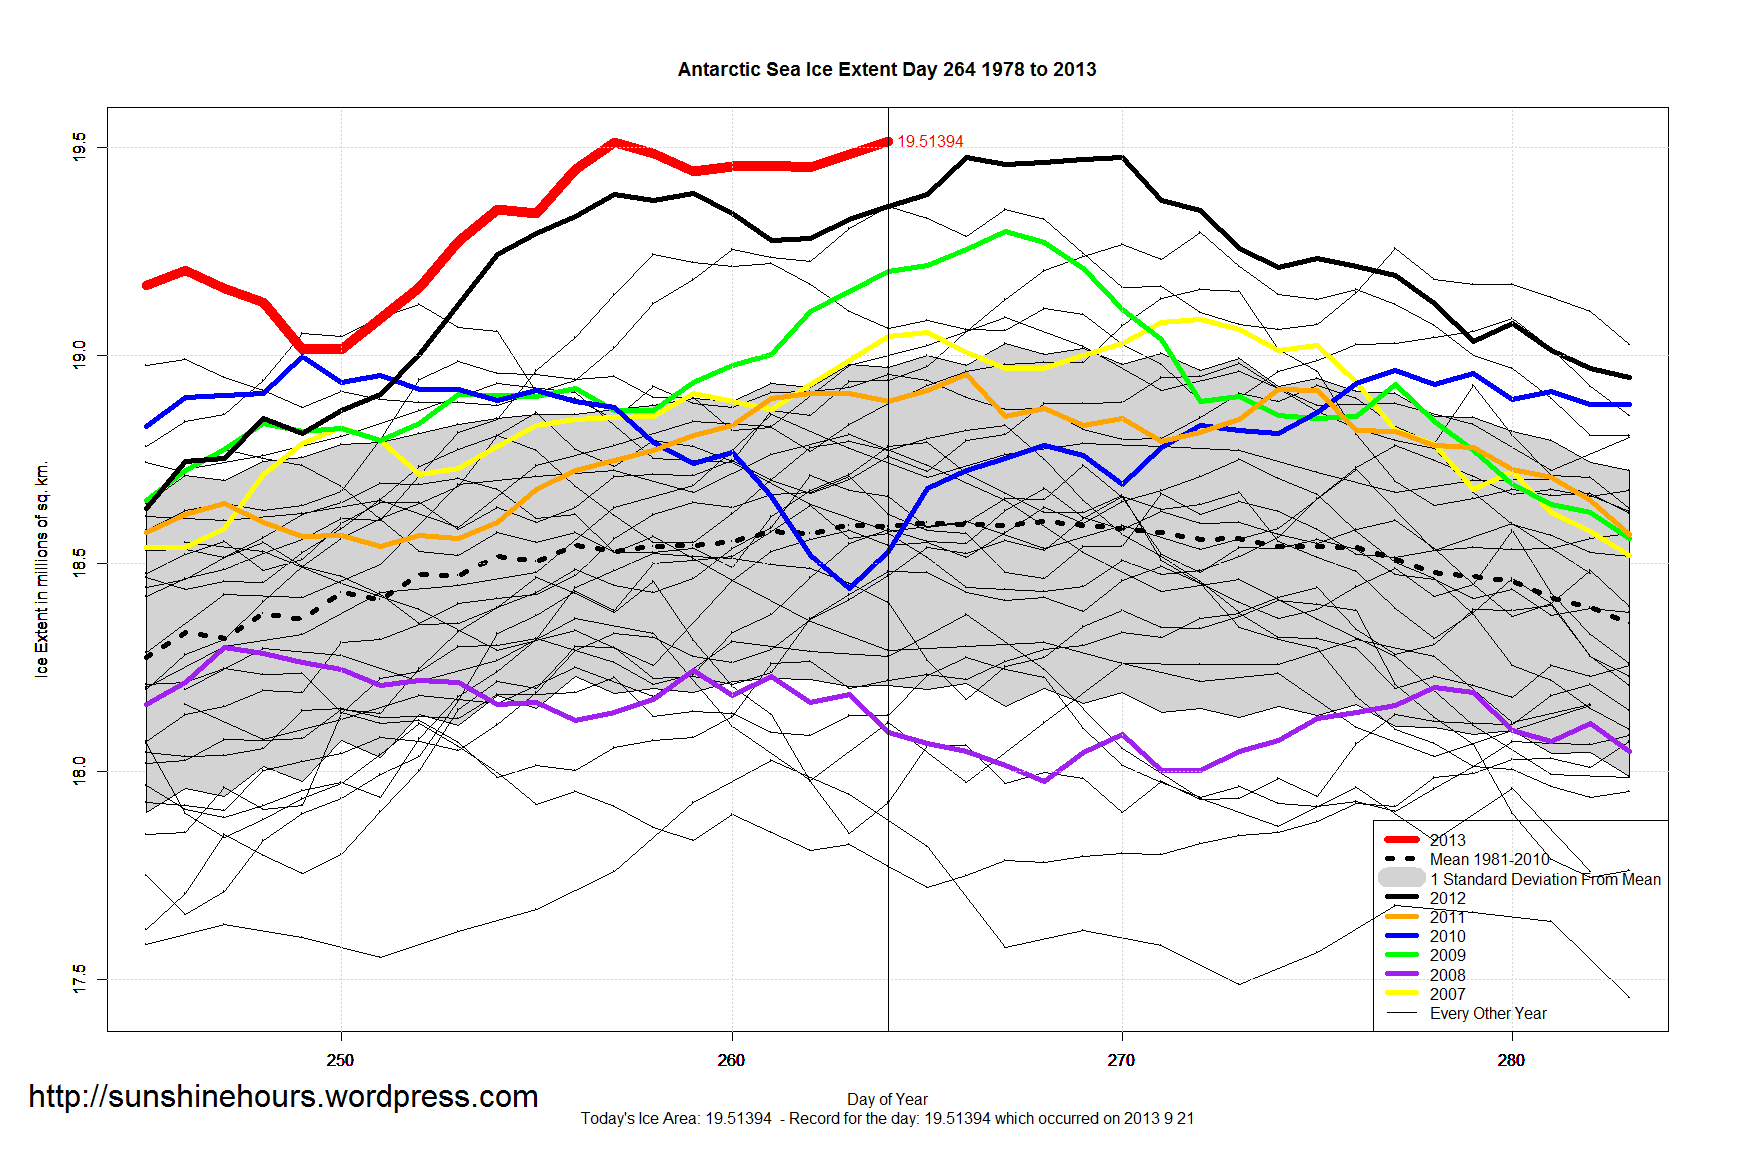
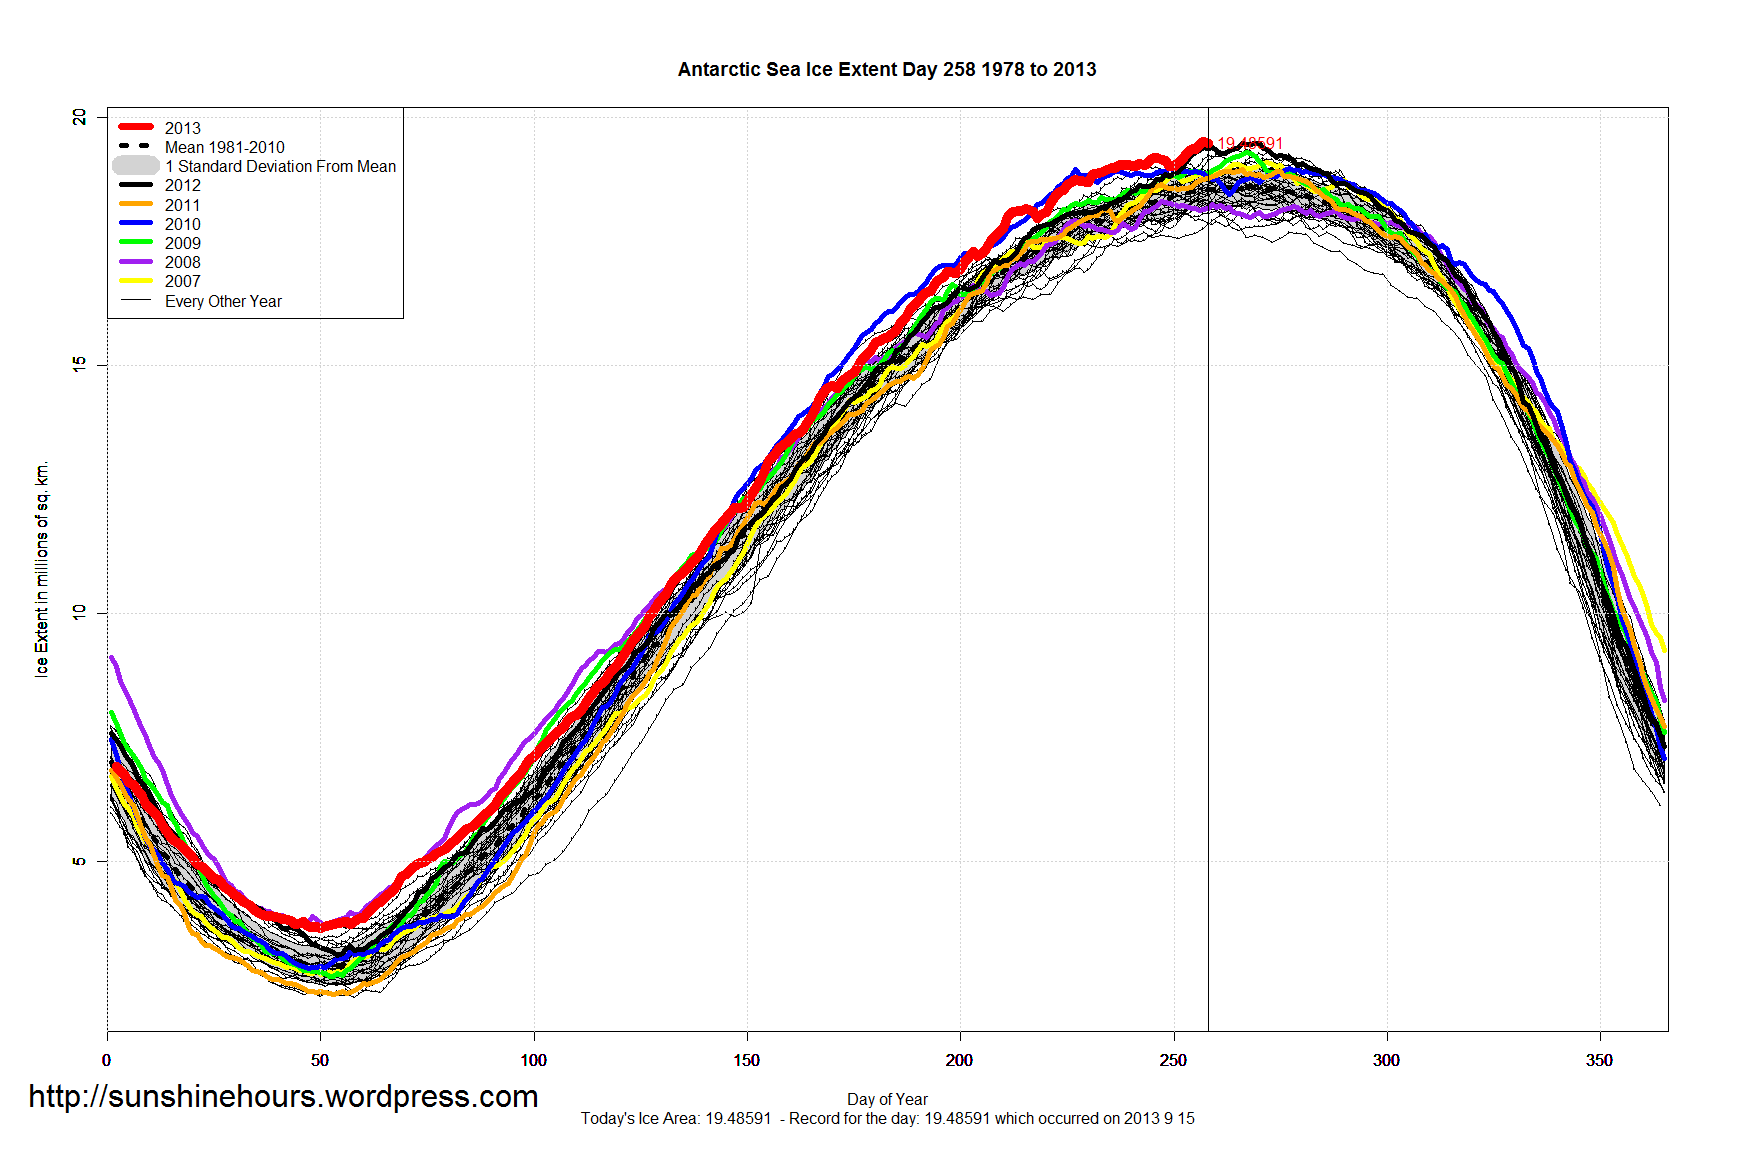
“Most models simulate a small decreasing trend in  Antarctic sea ice extent

Translation: None of the models got Antarctic Sea Ice right.

What a joke.

NASA’s Jet Propulsion Laboratory Beclowns Itself Over Sea Level Rise

The LA Times and other left-wing rags are bending over backwards to try and save the AGW cult from total humiliation. With AR5 coming and newspapers coming out with stories about the “pause” that the lefty papers ignored for 15 years, they are panicking.

For example:

“Bill Patzert of NASA’s Jet Propulsion Laboratory in La Cañada Flintridge, say sea level rise is “unequivocal proof” that greenhouse gases are continuing to heat the planet, and that much of this added heat is being absorbed by the oceans.”

But there’s been no slowdown whatsoever in sea level rise, so global warming is alive and well.”

Poor old Bill seems to be dumber than a post because he conveniently “forgets” about 2010 and 2011.

Lets go back a whole month! Another left-wing rag (the Guardian) tries to explain why sea level dropped in 2010/2011.

“Rain – in effect, evaporated ocean – fell in such colossal quantities during the Australian floods in 2010 and 2011 that the world’s sea levels actually dropped by as much as 7mm.”

Poor old Bill seems to have forgotten that sea level dropped for 2 years.

And the real joke is that if too much rain over Australia caused sea level to fall despite the massive increase in anthropogenic CO2, why couldn’t too little rain in Australia have caused a sea level rise?

Instead of doing science, the AGW Cult specializes in making up stupid excuses why their predictions are not coming true!

It’s too bad NASA and JPL have now beclowned themselves again trying to support a dying cult.

52nd Daily Record of Year for Antarctic Sea Ice Extent on Sept 20th

Sept 20th (Day 263) Antarctic Sea Ice Extent set its 52nd daily record for the year. (12th in a row) Of course Antarctic Sea Ice hit an all-time record on the 14th.

Antarctic Sea Ice gained 31,000 sq km on day 263. It also looks like there is a decent chance of a new all-time record on day 264 or day 265. 2012 had a double peak.

Click graph for bigger. Data is here.


Antarctic_Sea_Ice_Extent_Zoomed_2013_Day_263_1981-2010

50th Daily Record of Year for Antarctic Sea Ice Extent on Sept 19th

Sept 19th (Day 261) Antarctic Sea Ice Extent set its 50th daily record for the year. Of course Antarctic Sea Ice hit an all-time record on the 14th.

The last two days have also seen a small ice gain of 13,000 and 3,000 sq km. and it is 980,000 sq km above the 1981-2010 mean.

Click graph for bigger. Data is here.

Antarctic_Sea_Ice_Extent_Zoomed_2013_Day_261_1981-2010

Antarctic Ice Loss or Gain Last 150 Days (Up To Day 261 )

Arctic Sea Ice Extent Stats For 2013 (so far)

The melting of the Arctic Sea Ice may be over. Here are some stats for NSIDC Extent. The stats for 2013 could change.

Lowest Minimum 3.36973 2012
Highest Minimum 7.52476 1980

Lowest day of Minimum 245 1987
Highest day of Minimum 265 1989 and 2005

Lowest Maximum 14.67084 2011
Highest Maximum 16.56457 1979

Lowest day of Maximum 52 1987
Highest day of Maximum 90 2010

Year Min Max day of Max day of Min
2013 5.07939 15.16969 73 252
2012 3.36973 15.25102 64 260
2011 4.33028 14.67084 66 251
2010 4.59918 15.28449 90 262
2009 5.05488 15.16275 61 255
2008 4.55469 15.30522 58 262
2007 4.1607 14.78963 69 257
2006 5.74877 14.73298 70 257
2005 5.31832 14.94615 71 265
2004 5.77608 15.25548 70 263
2003 5.97198 15.58678 80 260
2002 5.62456 15.57345 68 256
2001 6.56774 15.66664 63 262
2000 5.9442 15.44482 63 255
1999 5.68009 15.55755 89 255
1998 6.29922 16.02091 56 260
1997 6.61353 15.63647 79 246
1996 7.15283 15.42074 52 254
1995 5.98945 15.32238 59 252
1994 6.92645 15.72226 61 248
1993 6.15699 16.00491 72 249
1992 7.16324 15.53258 72 251
1991 6.26027 15.58803 56 259
1990 6.0191 16.21077 71 264
1989 6.88931 15.72295 65 265
1988 7.04905 16.24163 70 255
1987 6.89159 16.21724 52 245
1986 7.12351 16.11934 69 249
1985 6.4799 16.11716 76 250
1984 6.39916 15.76157 78 260
1983 7.19145 16.33207 73 251
1982 7.15423 16.27475 58 256
1981 6.88784 15.71365 73 253
1980 7.52476 16.25042 65 249
1979 6.89236 16.56457 60 264

Antarctic Sea Ice Extent Stats for 2013 (so far)

Antarctic Sea Ice Extent has dropped two days in a row (see below) after setting an all time record.

It may very well rise again. But I thought I would publish some stats.

Maximum Sea Ice Extent for 2013 occurred (so far) on day 257 which was the 10th earliest. The earliest was day 243 in 1994. The latest was day 277 in 1988. The lowest max was in 1986.

Minimum Sea Ice Extent for 2013 occurred on day 50 which was the 7th earliest. It was the 2nd highest minimum behind 2008. The earliest minimum was also in 1994 on day 43. The latest minimum occurred on day 65 in 1986. The lowest minimum was in 1997.

Year Min Max day of Max day of Min
2013 3.6504 19.51234 257 50
2012 3.11109 19.47713 266 54
2011 2.31884 18.95328 266 53
2010 2.8422 18.9968 249 47
2009 2.67096 19.29864 267 53
2008 3.69176 18.29726 247 51
2007 2.7227 19.08545 272 50
2006 2.4866 19.35934 264 51
2005 2.80387 19.29451 272 49
2004 3.25927 19.12341 252 51
2003 3.6257 18.67907 268 48
2002 2.69691 18.11556 252 51
2001 3.44094 18.49324 271 50
2000 2.58248 19.15817 272 49
1999 2.70723 18.98068 273 51
1998 2.7715 19.2433 258 56
1997 2.26415 18.79094 265 58
1996 2.59733 18.83039 267 56
1995 3.32988 18.7353 269 55
1994 3.08286 18.8266 243 43
1993 2.28078 18.709 263 50
1992 2.49238 18.4663 255 54
1991 2.55355 18.66993 273 58
1990 2.78435 18.3788 273 53
1989 2.7229 18.27368 266 51
1988 2.63862 18.78456 277 55
1987 3.01642 18.52332 258 52
1986 2.95395 18.02672 261 65
1985 2.60211 18.93215 254 50
1984 2.38292 18.37747 266 58
1983 2.84656 18.81042 263 55
1982 2.8927 18.55004 246 52
1981 2.69524 18.85906 261 51
1980 2.52686 19.09137 267 57
1979 2.91521 18.36699 256 48

Antarctic_Sea_Ice_Extent_Zoomed_2013_Day_259_1981-2010

Arctic Sea Ice Extent Minimum 2013 May Have Occurred on Sept 12 (Day 255)

Arctic Sea Ice Extent Minimum 2013 may have occurred on Sept 12 (Day 255). I say “may have occurred” because there is a chance of more ice melt. The last 3 days have seen very small increases.

On Sept 12 (day 255) Arctic Sea Ice Extent was 5.07146 million sq km.

As of Sept 15  (day 258) Arctic Sea Ice Extent was 5.11953 million sq km.

If the minimum stays at day 255, it would be the 7th lowest minimum in the satellite record. The record was 3.36973 million sq km set in 2012. Which would make 2013’s minimum 1.7 million sq km’s higher.

Arctic Ice Loss or Gain Last 150 Days (Up To Day 258 ) Arctic_Sea_Ice_Extent_Zoomed_2013_Day_258_1981-2010