Antarctica Sea Ice Extent All-Time Record Maximum on Sept 14 2013

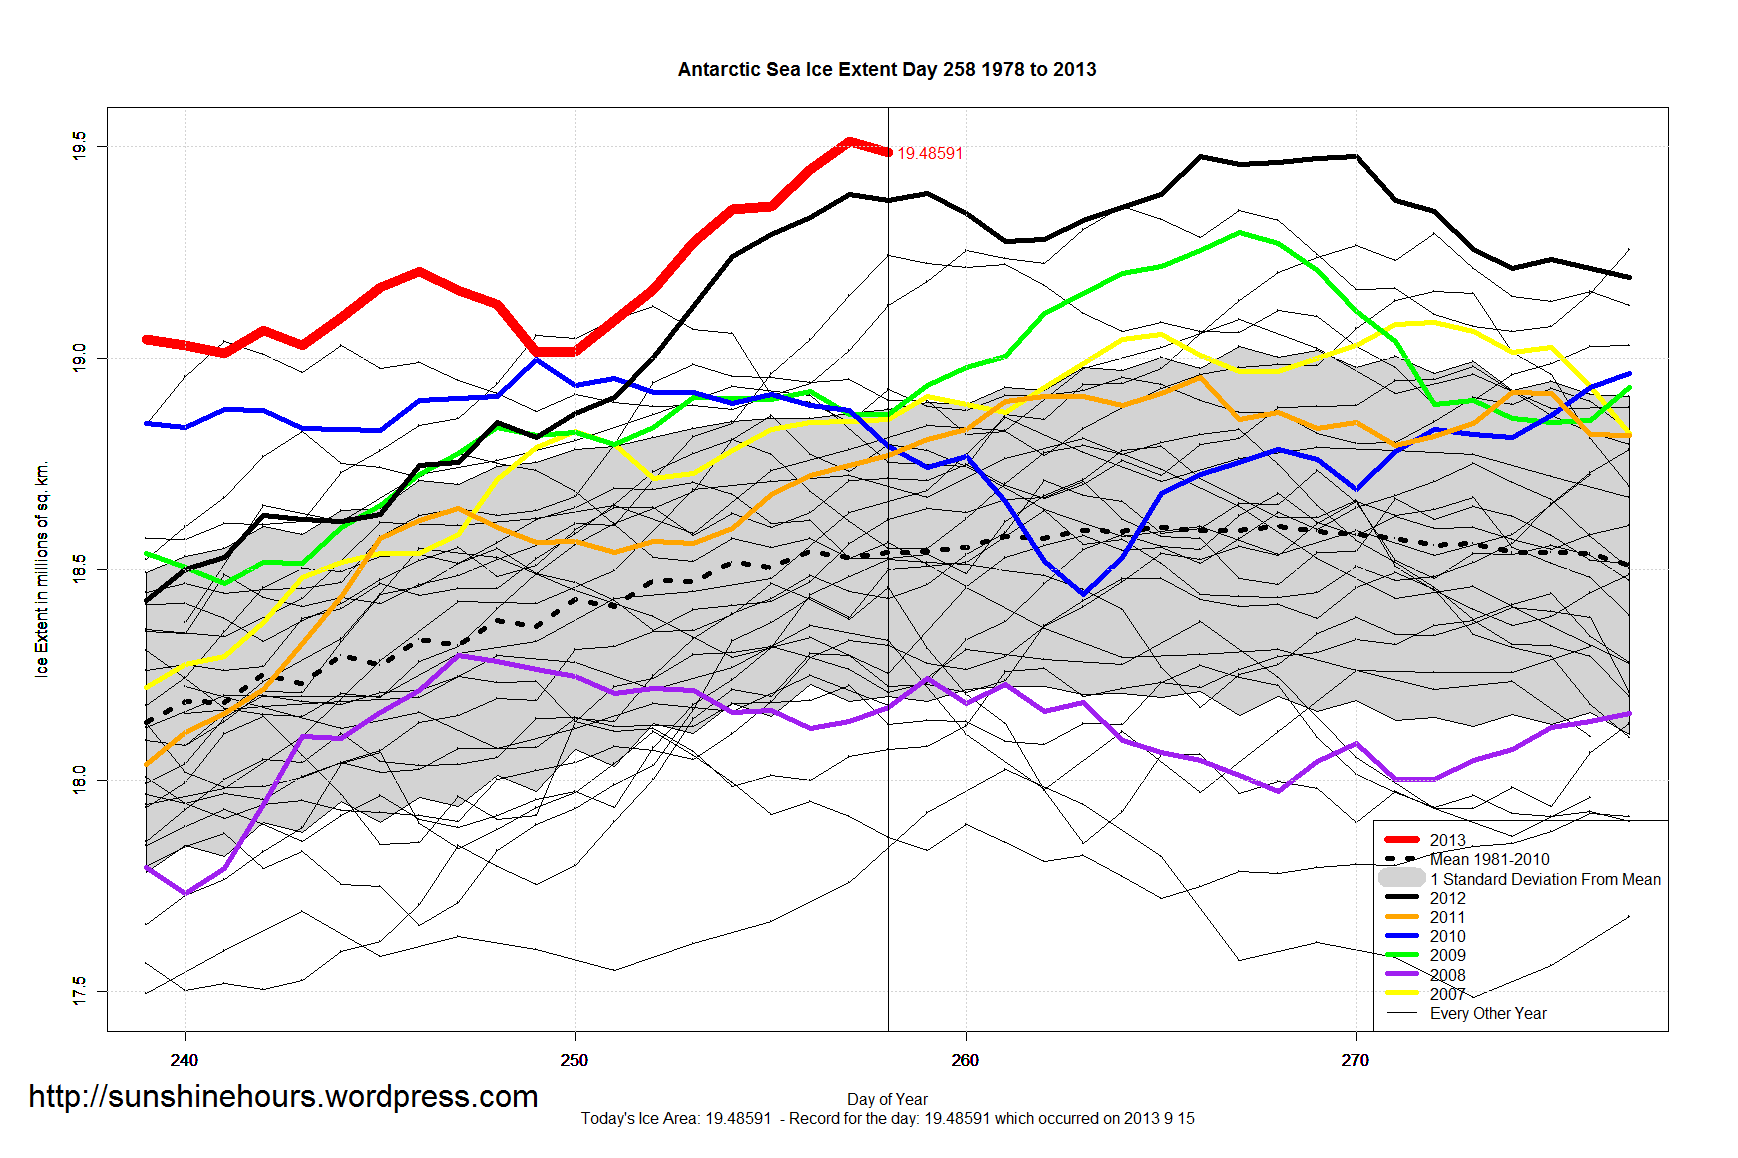
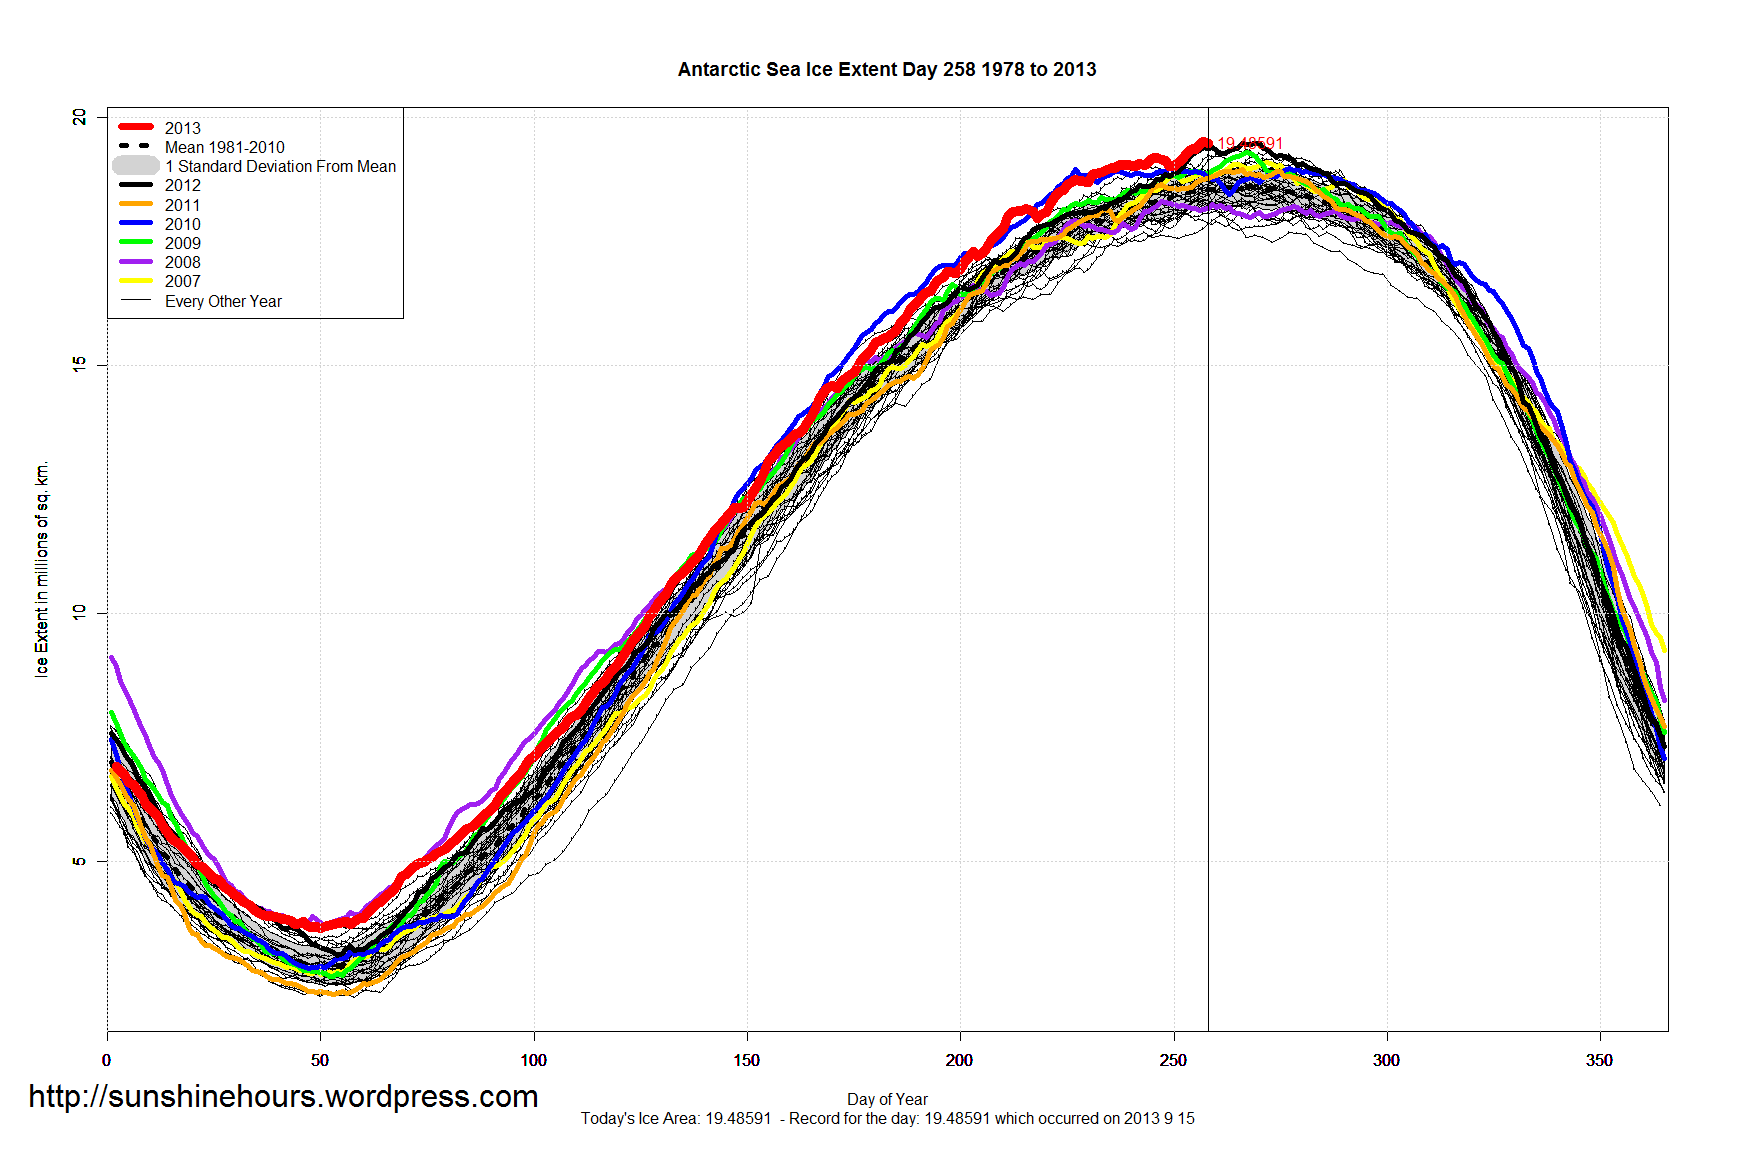
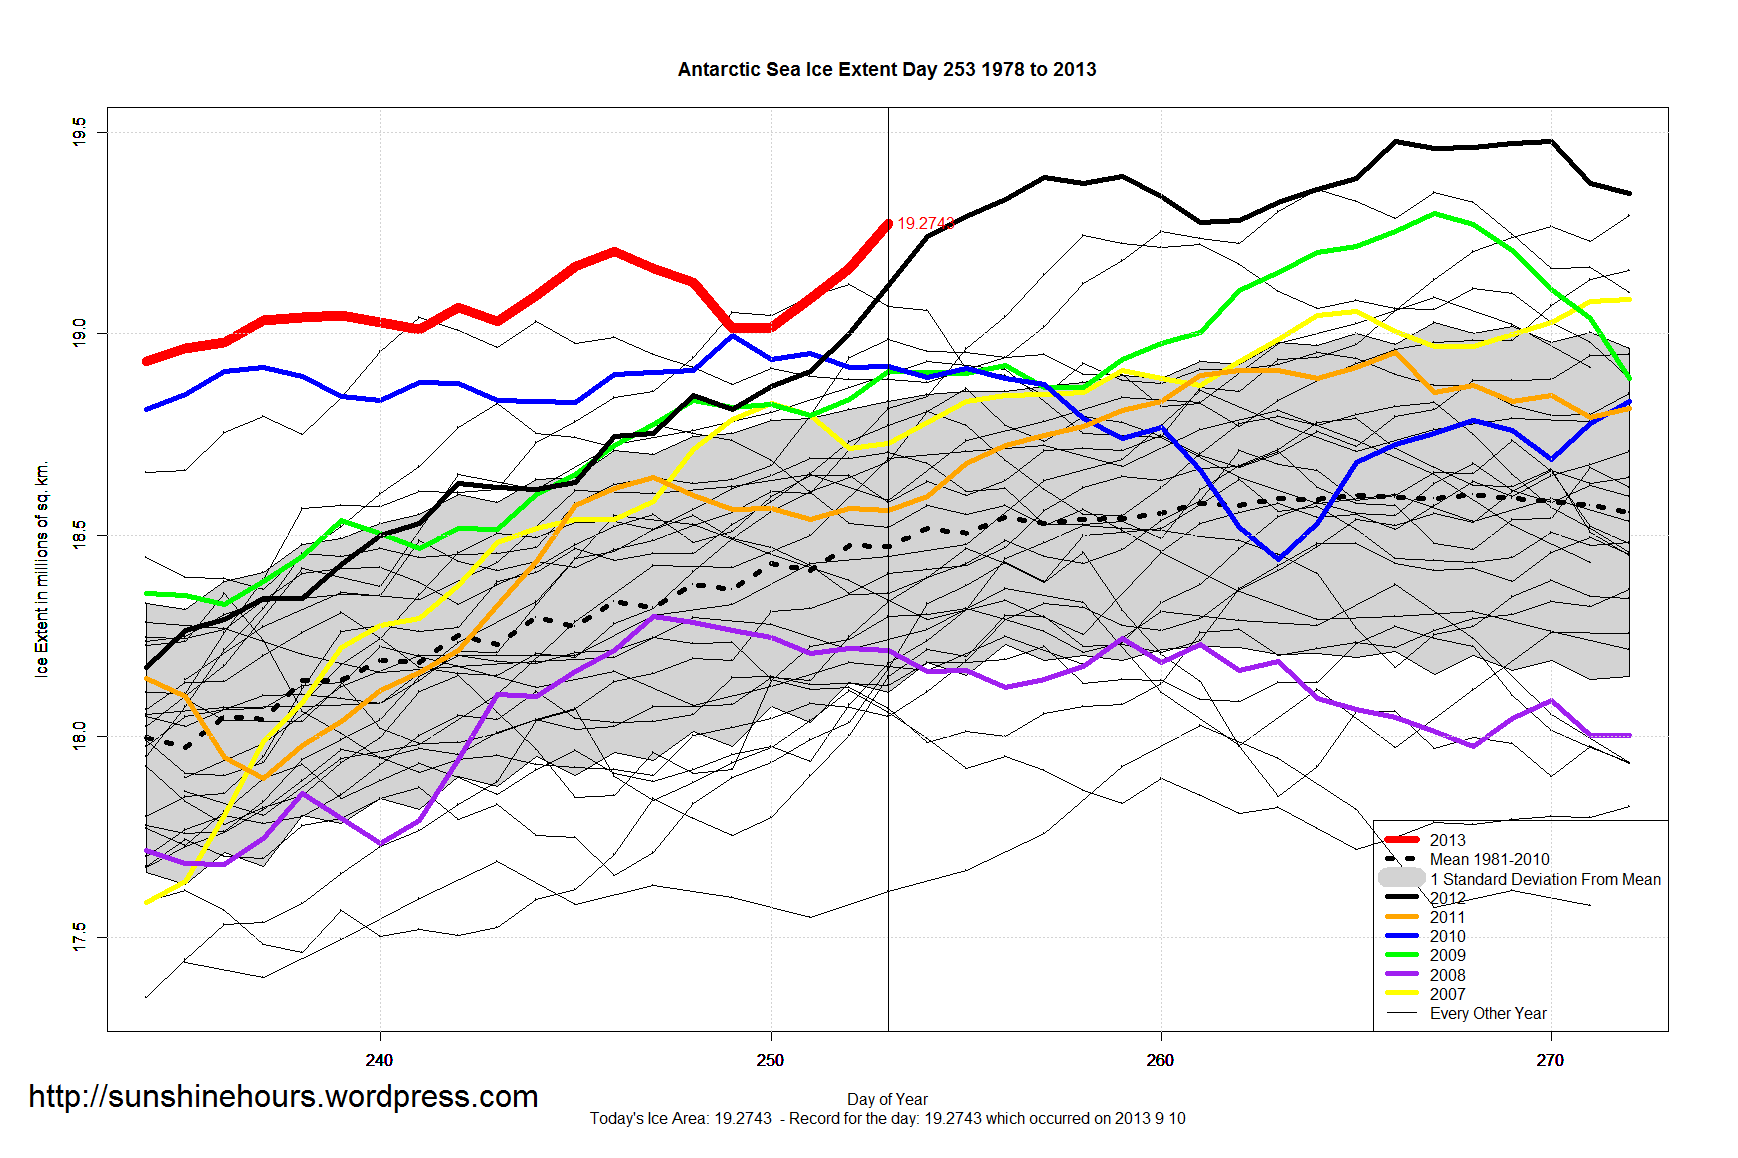
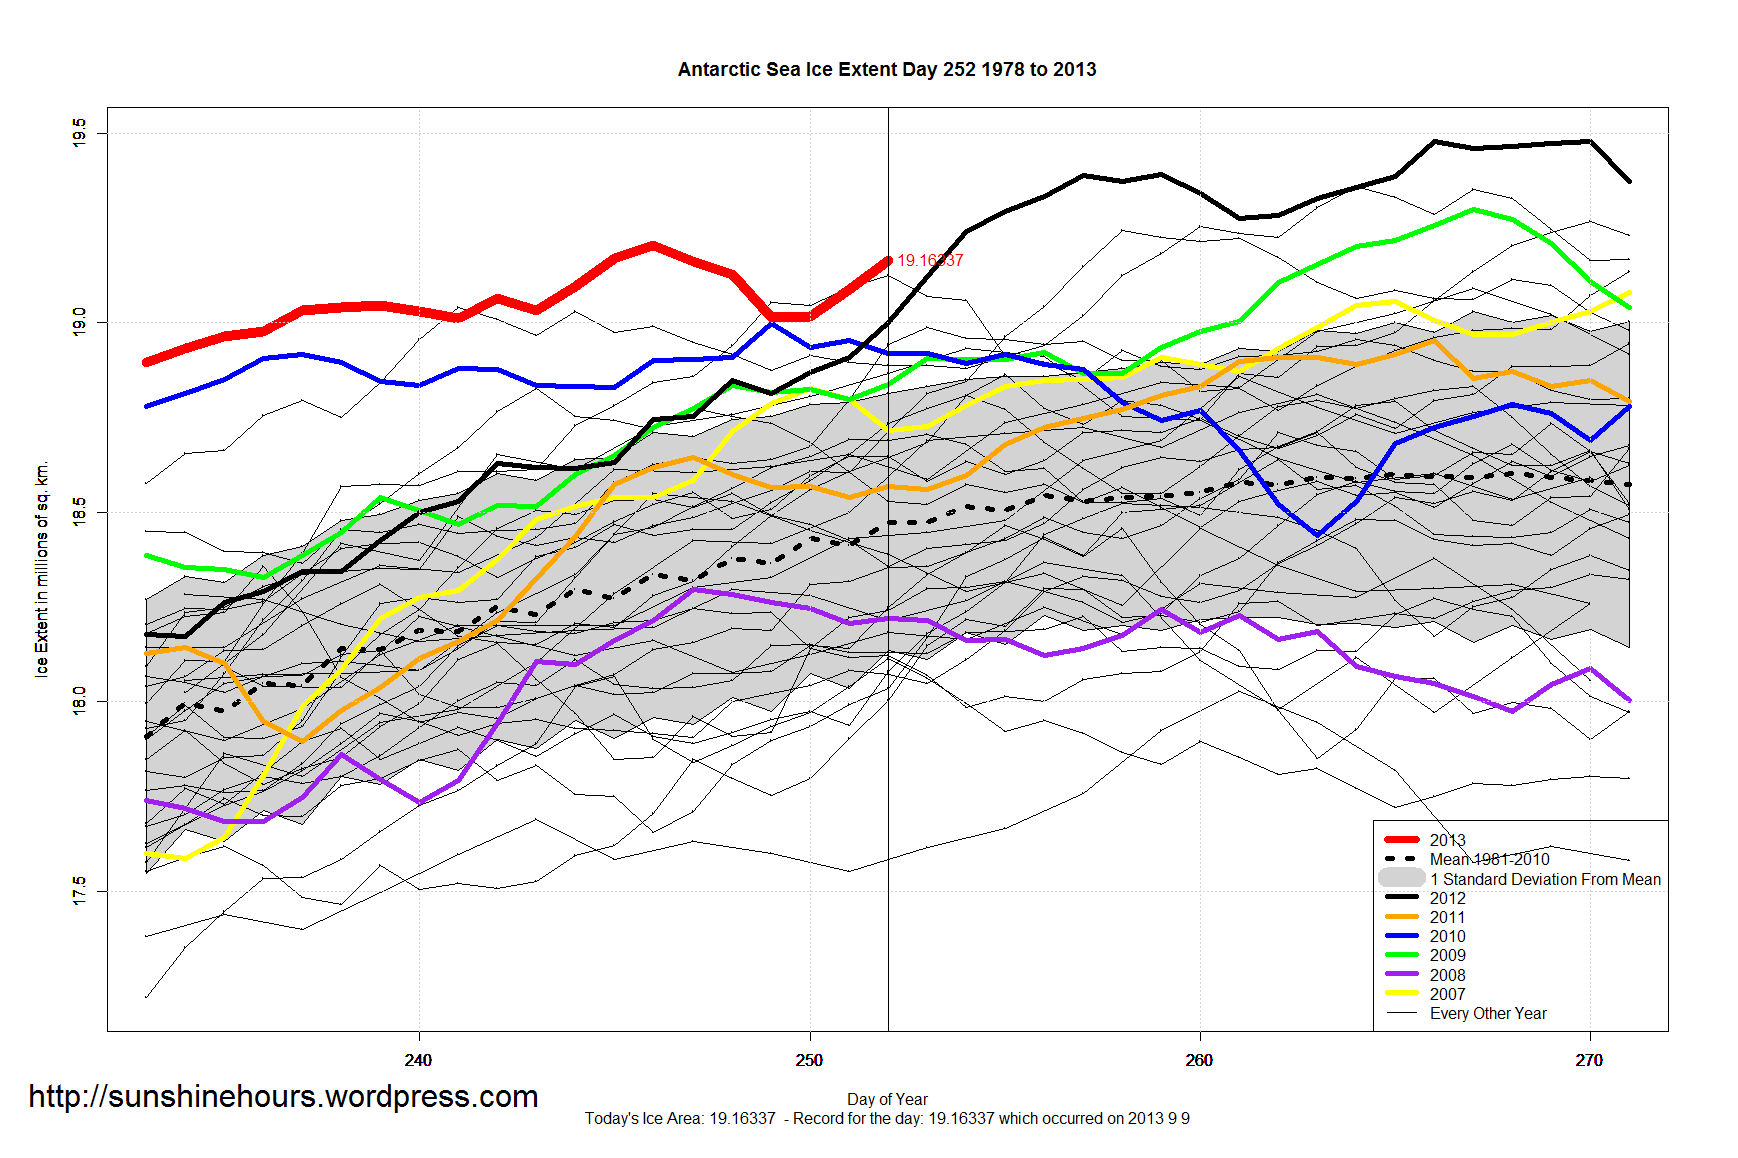
Antarctica Sea Ice Extent set an all-time record of 19.51234 million sq km on September 14 2013 (Day 257).

The old record was 19.47713 million sq km set in 2012.

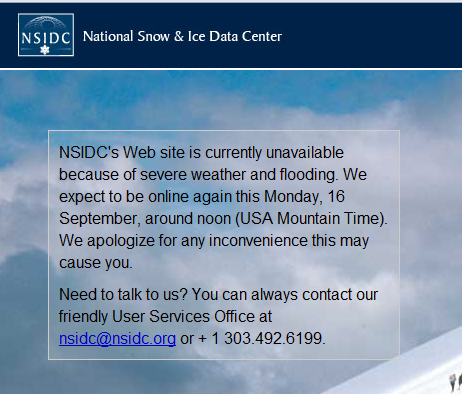
Click graph for bigger. Data is here. This post is a day late because NSIDC was closed due to flooding in Boulder.

Antarctic_Sea_Ice_Extent_Zoomed_2013_Day_258_1981-2010

Antarctic_Sea_Ice_Extent_2013_Day_258_1981-2010

German ‘green revolution’ may cost 1 trillion euros

“(Reuters) – Germany’s transition to renewable energy may cost up to 1 trillion euros ($1.34 trillion) in the next two decades, the environment minister said on Wednesday, piling pressure on his opponents to back plans to cap power price rises before the election.

With an eye on the September vote, Peter Altmaier, one of conservative Chancellor Angela Merkel’s most trusted ministers, has outlined plans to rein in subsidies for renewable power which have pushed up consumers’ electricity bills.

However, his plans may be doomed as the opposition Social Democrats (SPD) and Greens have reservations and could block legislation in the Bundesrat upper house.

“The costs of our energy reform and restructuring of energy provision could amount to around 1 trillion euros by the end of the 2030s,” Altmaier told the Frankfurter Allgemeine Zeitung newspaper.”


http://www.reuters.com/article/2013/02/20/us-germany-energy-idUSBRE91J0AV20130220

IPCC: We Predicted Less Antartic Ice and We Have No Idea Why It Is Increasing

UPDATE: Antarctica Set An All Time Record For Sea Ice Extent on Sept 14th. Read about it here.

David Rose is getting a lot of hate for telling the truth about shoddy climate models.

But this quote from the leaked upcoming AR5 jumped out at me:

“‘Most models simulate a small decreasing trend in Antarctic sea ice extent, in contrast to the small increasing trend in observations… There is low confidence in the scientific understanding of the small observed increase in Antarctic sea ice extent.’

Read the full article here:

http://www.dailymail.co.uk/news/article-2420783/Global-warming-just-HALF-said-Worlds-climate-scientists-admit-computers-got-effects-greenhouse-gases-wrong.html

NOAA August 2013 – Only 28 Were Warmer Like 1901,1913,1934,1936,1937,1938,1943,1947 etc

According to the NOAA August 2013 was the 92nd warmest out of 119. That means only 28 were warmer.

These are the 28: 1901,1913,1934,1936,1937,1938,1943,1947,1955,1958,1959,1969,1970,1983,1984,1988,1995,1998,2000,2001,2003,2005,2006,2007,2010,2011,2012

It was cool in the east though. The numbers below are the rank out of 119.

So North Carolina (for example) was 13th warmest out of 119. Which means 107 Augusts in NC were warmer.

NOAA_AUG_2013_Map

43rd Daily Record for Antarctic Sea Ice Extent – 2013 would be 3rd Highest Maximum of All Time

September 11th (Day 254) saw the 43rd Daily Record of the Year for Antarctic Sea Ice Extent. So far, 2013 would be the 3rd highest maximum of All Time behind 2012 and 2006.

2012’s maximum was 19.47713 million sq km
2006’s maximum was 19.35934 million sq km
2013’s maximum so far is 19.35119 million sq km

Click graph for bigger. Data is here.


Antarctic Ice Loss or Gain Last 150 Days (Up To Day 254 ) Antarctic_Sea_Ice_Extent_Zoomed_2013_Day_254_1981-2010

HADCET Aug 2013 – Tied For 41st Warmest out of 351

 HADCET (Central England Temperature) Aug 2013 was tied for 41st warmest.

2013 was tied with 1704 1727 1743 1792 1807 1831 1835 1856 and 1937.

The barplot is the Augusts since 1659. The temperature is the anomaly from the 1981 to 2010 average.

The yellow bars are the years warmer than August 2013. Green bars indicate a tie with August 2013. Click for bigger.

HADCET (since 1659) monthly mean - Aug