HADCRUT4 10 Years By Month = AMO

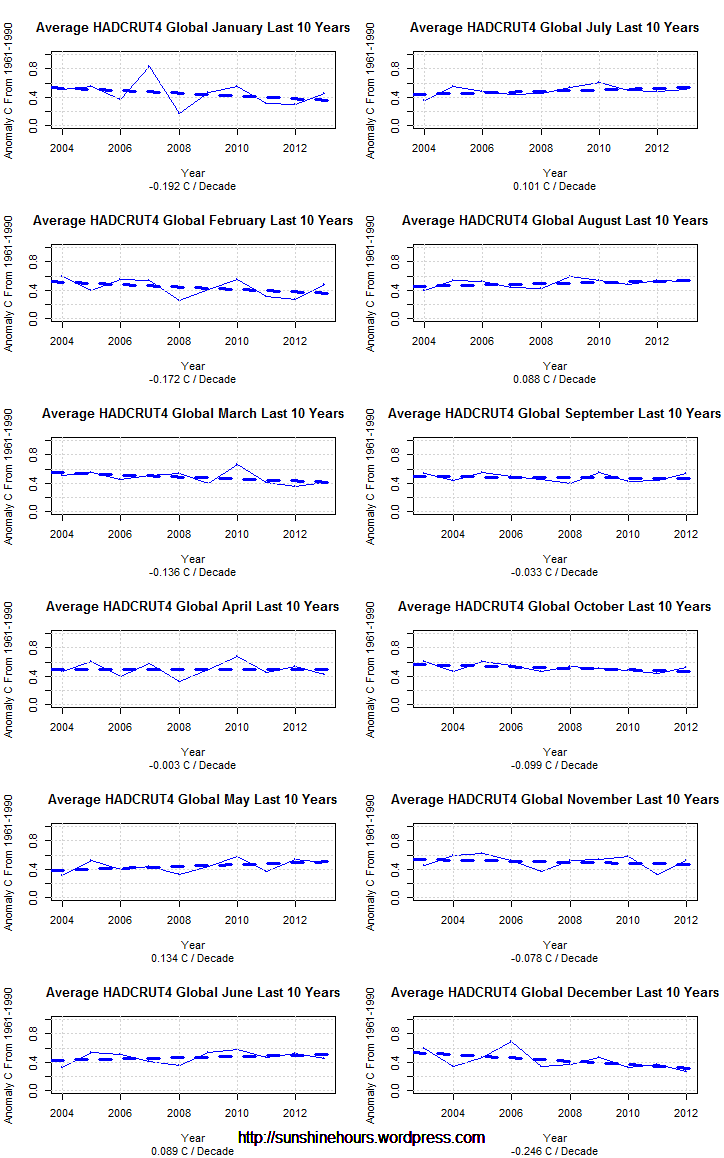
Over the last 10 years HADCRUT4 has had a slightly negative trend. But the months each have their own trend.

September to April have been cooling, while May – August have been warning, All 12 months with trends are below.

I wonder why CO2 has forsaken the winter months?

The interesting thing is this matches the AMO as you can see in the post I did in January. (I would do a new post but the US shutdown has shutdown the page I got the AMO data from).

When the AMO finishes going negative this will be very bad news for the CO2/Warmist Cult.. And even worse news for the world’s agriculture.

Right now, Dec/Jan/Feb are cooling at -0.17C/decade to -0.25C/decade. Brr.  Germany is already off to the coldest start of winter in 200 years.

Average HADCRUT4 Global  Last 10 Years

Mean Arctic Sea Ice Extent By Month For Last 10 Years (March April and May are climbing)

It is interesting to look at the mean Arctic Sea Extent for each month (for the last 10 years) all on one page.

The decadal trend is at the bottom of each graph. The dashed blue line is the linear trend. The green line is the loess trend.

January is dropping slightly, February is flat, March April and May are all climbing.

June is sropping but it has a major uptick from 2010.

July to September are dropping (but with an uptick at the end)

There is no data for Oct/Nov/Dec 2013 because of the shutdown. But all 3 will have an uptick for 2013.

Average Arctic Sea Ice Extent by Month Since 2004

Precedented Warming in Antarctica

Warmists like to claim warming in every part of the world is unprecedented.

This paper says just the opposite. Warming has been more dramatic in the 1700s and 1800s than today.

“We present a new stable isotope record from Ellsworth Land which provides a valuable 308-year record (1702-2009) of climate variability from coastal West Antarctica. Climate variability at this site is strongly forced by sea surface temperatures (SSTs) and atmospheric pressure in the tropical Pacific and related to local sea ice conditions. The record shows that this region has warmed since the late 1950s, at a similar magnitude to that observed in the Antarctic Peninsula and central West Antarctica, however, this warming trend is not unique. More dramatic isotopic warming (and cooling) trends occurred in the mid-19th and 18th centuries, suggesting that at present the effect of anthropogenic climate drivers at this location has not exceeded the natural range of climate variability in the context of the past ~300 years.

http://onlinelibrary.wiley.com/doi/10.1002/2013GL057782/abstract


HADCET September 2013 – Only 128 Years Were Warmer

 HADCET (Central England Temperature) Sep 2013 was tied for 129th warmest out of 352 at 13.7C. The warmest September was 16.8C  in 2006. The 2nd warmest was 16.6C in 1729!!!!

The barplot is the Septembers since 1659. The temperature is the anomaly from the 1981 to 2010 average.

The yellow bars are the years warmer than September 2013. Green bars indicate a tie with September 2013. Click for bigger.

HADCET (since 1659) monthly mean - Sep

Government Shutdown Stops Sea Ice Data Updates From NOAA

There were no NSIDC sea ice updates today. I emailed NSIDC to ask why and got this prompt and polite reply.

“Thank you for contacting the National Snow and Ice Data Center.Because our data provider, the National Oceanic and Atmospheric Administration (NOAA), has shut down the data stream as part of the government shutdown, we are temporarily unable to update the product.

I apologize for the inconvenience.

Best regards,
xxxxxxxx xxxxxxxxxx
NSIDC User Services”


U.S. Fish and Wildlife Service Says Killing Eagles is OK!

“SAN FRANCISCO, Sept. 27 (UPI) —
A Solano County, Calif., wind farm would be the first renewable energy project in the nation allowed to kill eagles under a federal plan, a U.S. agency said.
Under the U.S. Fish and Wildlife Service proposal, outlined in a draft environmental report released Thursday, the Shiloh IV Wind Project would be issued a golden eagle take permit for its 3,500-acre plant in the Montezuma Hills, the San Francisco Chronicle reported.
The plan would allow the company’s 50 wind turbines to kill as many as five golden eagles in a five-year period in exchange for measures to protect the birds, including retrofitting 133 power poles to prevent electrocutions, the Chronicle said.
“The bottom line is a permit will help preserve eagles,” said Scott Flaherty, the deputy assistant regional director of external affairs for the Fish and Wildlife Service.”

http://www.breitbart.com/system/wire/upiUPI-20130927-131354-9098

Paraphrasing … They had to kill the Eagles to save them, *

It is a pretty sick world where an agency tasked with preserving Eagles is goving out permits to kill Eagles and turning a blind eye to the Eagles already being electrocuted.

Shilo IV is rated at 102.5 MW , which means it may average 25MW.


Did you know you can buy a 100MW gas generator for around 30 million.


Antarctica Sea Ice Extent 3rd Highest of All-Time on Sept 27 2013

Antarctica Sea Ice Extent took an unexpected 50,000 sq km jump yesterday. It was the 3rd highest extent of all-time.

The top 5 Antarctic Sea Ice Extents of all-time all occurred since Sept 14th 2013.  10 out of the top 15 were in 2013. The remaining 5 occurred in 2012.

2013 has also set 55 daily records.

Click graph for bigger. Data is here.


Antarctic Ice Loss or Gain Last 150 Days (Up To Day 270 ) Antarctic_Sea_Ice_Extent_Zoomed_2013_Day_270_1981-2010

IPCC Statement About Last 3 Decades

“Each of the last three decades has been successively warmer at the Earth’s surface than any preceding decade since 1850”

My Response (using HADCRUT4 data)

Decade Mean Anomaly C

1850 -0.32
1860 -0.33
1870 -0.26
1880 -0.30
1890 -0.36
1900 -0.41
1910 -0.39
1920 -0.25
1930 -0.12
1940 0.00
1950 -0.06
1960 -0.05
1970 -0.08

Each of the 4 decades after the 1870s were successively COLDER at the Earth’s surface than any preceding decade since 1850

Why did it take until the 1920s to get as warm as the 1870s?

Each of the 3 decades after the 1900s were successively warmer at the Earth’s surface than any preceding decade since 1850

But the next 3 decades after the 1940s were COLDER than the 1940s.

Why?

Explain your work.

IPCC AR5 Admits They Have No Clue What Caused the 15 Year Pause in Warming

From the leaked AR5 Summary:

“The observed reduction in warming trend over the period 1998–2012 as compared to the period 1951–1 2012, is due in roughly equal measure to a cooling contribution from internal variability and a reduced trend in radiative forcing (medium confidence). The reduced trend in radiative forcing is primarily due to volcanic eruptions and the downward phase of the current solar cycle. However, there is low confidence in quantifying the role of changes in radiative forcing in causing this reduced warming trend. {Box 9.2; 10.3.1; Box 10.2}”

Translation: It was the sun. Or super secret volcanoes. Or something.