Antarctic Sea Ice – 24% and 738,000 sq km Above Normal – Day 42

A week ago I was sure a new record would be set for highest minimum. Two days ago I was sure the record would not be set. Now I’m not predicting.

Antarctic Sea Ice Extent is 738,000 sq km above the 1981-2010 mean. Which is 24% above. The anomaly was slightly higher today because of the minimal melt – 30,000 sq km.

Extent is 3.805 million sq km, and is still 110,000 sq km above the record highest minimum set in 2008.

I’ve added the 2008 Highest Minimum point to this graph. Data is here. Click for bigger.

Antarctic_Sea_Ice_Extent_Zoomed_2014_Day_42_1981-2010


Antarctic Sea Ice – 717,000 sq km Above Normal – Day 41

Antarctic Sea Ice Extent is 717,000 sq km above the 1981-2010 mean. Which is 23% above. Today was the first non-record day in 18 days.

Extent is 3.83 million sq km, and is still 140,000 sq km above the record highest minimum set in 2008.

I’ve added the 2008 Highest Minimum point to this graph. (But it isn’t looking as good for a new record now). Data is here. Click for bigger.

Antarctic_Sea_Ice_Extent_Zoomed_2014_Day_41_1981-2010


Sea Ice Update February 10 2014

A quick update for sea ice extent:

  • Global Sea Ice is 70,000 sq km below the 1981-2010 mean.
  • Antarctic Sea Ice is  728,000 sq km above the 1981-2010 mean and probably NOT on track to break the record for highest minimum.  Day 40 was still a daily record (23rd of the year), but only by 2120 sq km.
  • Arctic Sea Ice is 798,000 sq km below the 1981-2010 mean.

Graphs below. Click for bigger.

Global_Sea_Ice_Extent_Zoomed_2014_Day_40_1981-2010 Antarctic_Sea_Ice_Extent_Zoomed_2014_Day_40_1981-2010 Arctic_Sea_Ice_Extent_Zoomed_2014_Day_40_1981-2010

Antarctic Sea Ice – 22nd Daily Record of 2014 – 18th In A Row – Day 39

The 22nd daily record for Antarctic Sea Ice Extent in 2014 was set yesterday on Feb 8  (Day 39). The old record was from 2008.

The old record was broken by 78,260 sq km. Sea Ice is 807,000 sq km above the 1981-2010 mean.

I’ve added the 2008 Highest Minimum point to this graph. (But it isn’t looking as good for a new record now). Data is here. Click for bigger.

Antarctic_Sea_Ice_Extent_Zoomed_2014_Day_39_1981-2010


Antarctic Sea Ice Extent is 27.4% above normal as of Feb 7 2014

Antarctic Sea Ice Extent  is really on track to have the highest minimum in the modern satellite era.

Antarctic Sea Ice Extent as of Feb 7 2014 was 904,000 sq km above the 1981-2010 mean and 220,000 sq km above 2008.

904,000 sq km above normal is 27.4%. Day 37 was the 20th daily record of the year.

I’ve added the 2008 Highest Minimum point to this graph. Data is here. Click for bigger.

Antarctic_Sea_Ice_Extent_Zoomed_2014_Day_37_1981-2010


Antarctic Sea Ice – 29% Above Normal – 17th Daily Record of 2014 – 13th In A Row – Day 34

The 17th daily record for Antarctic Sea Ice Extent in 2014 was set yesterday on Feb 3 (Day 34).

The old record was broken by 290,000 sq km. Sea Ice is 980,000 sq km above the 1981-2010 mean. Thats 28.65%.

And WOW …. I know this is probably just an aberration (but it isn’t a normal time so who knows) but extent only fell 3230 sq km from day 33 to 34. Normally at this time of year extent falls around 40,000-100,000 sq km per day.

Caveat: the raw data has 0.00058 sq km in the missing column (which is usually 0). Not sure what that means, but that is only 580 sq km.

I’ve added the 2008 Highest Minimum point to this graph. Data is here. Click for bigger.

Antarctic_Sea_Ice_Extent_Zoomed_2014_Day_34_1981-2010


Antarctic Sea Ice – 16th Daily Record of 2014 – 12th In A Row – Day 33

The 16th daily record for Antarctic Sea Ice Extent in 2014 was set yesterday on Feb 2 (Day 33). For the first time this year the old record was from 2012, not 2008. 2012 did not have a high minimum, but did go on to set a new all time record at maximum (which was broken in 2013).

The old record was broken by 240,000 sq km. Sea Ice is 904,000 sq km above the 1981-2010 mean. Thats 25.76% above the 1981-2010 mean.

I’ve added the 2008 Highest Minimum point to this graph. Data is here. Click for bigger.

Antarctic_Sea_Ice_Extent_Zoomed_2014_Day_33_1981-2010


Hail Mary Pass Attempt By Warmists to Claim Antarctica Sea Ice is Not Increasing

David Appell was kind enough to alert me to a paper written by I. Eisenman, W. N. Meier, and J. R. Norris.

They titled their paper “A spurious jump in the satellite record: is Antarctic sea ice really expanding?”

I don’t plan to demean myself by spending a lot of time on this silly hail mary pass attempt. But I will post the evidence from the papers own supplemental materials.

That evidence was pointed out by P.R. Holland in an interactive comment here.

“This paper contains solid and important science and I congratulate the authors on their
vigilance. It is certainly important to know that the uncertainties in the ice area/extent
timeseries might be larger than thought (depending upon how this finding is addressed
by the author of the timeseries in question).

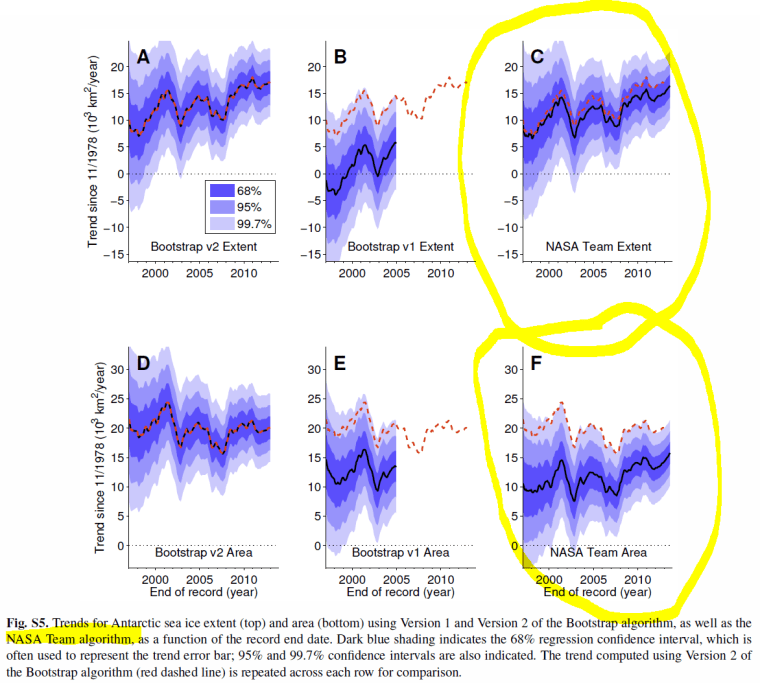
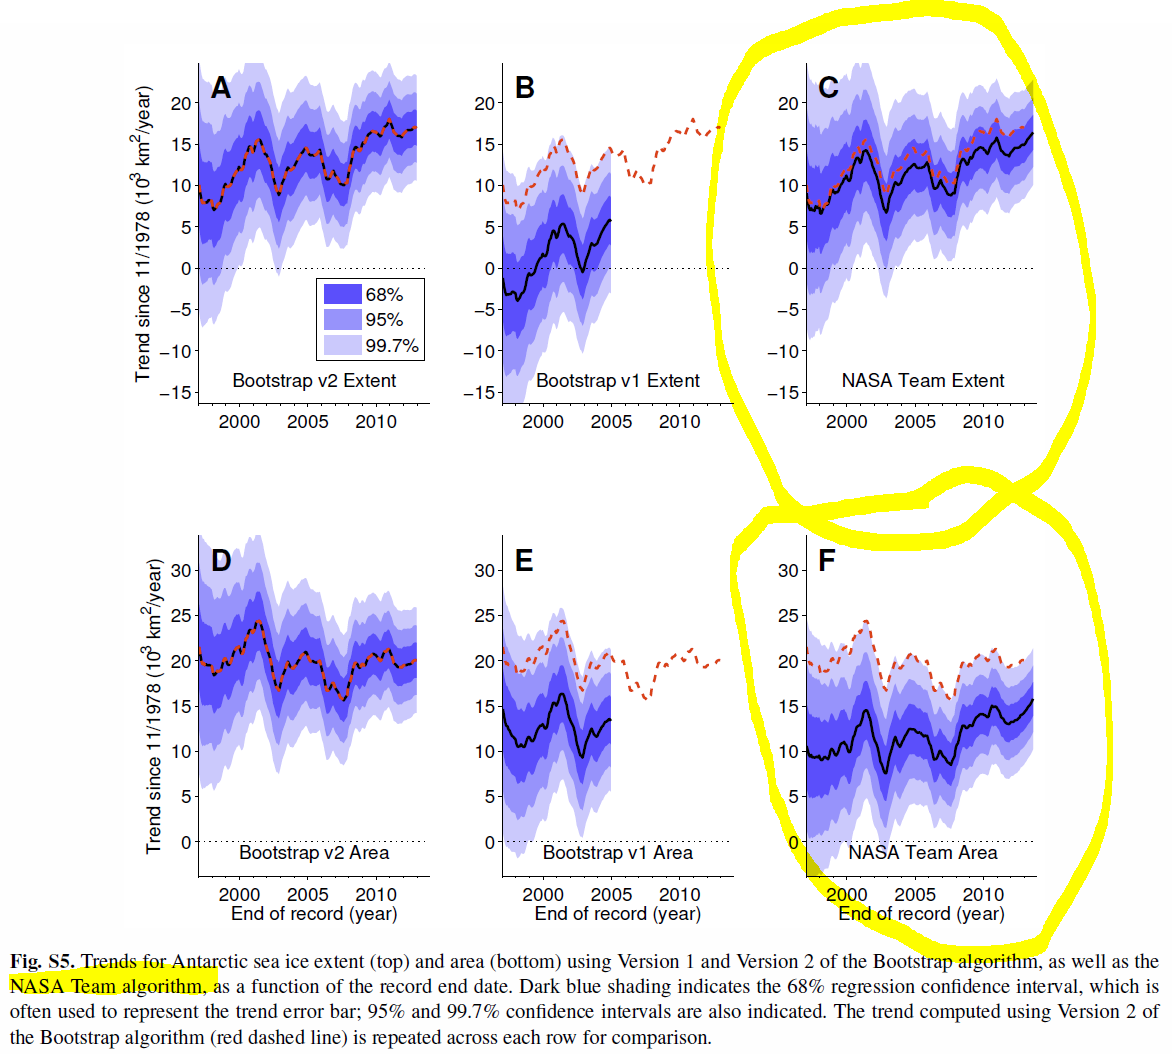
However, doesn’t Figure S5 in the supplementary material show that whatever the
source of the Bootstrap issue, there is no doubt that Antarctic sea ice is increasing in
both area and extent? The trends appear significant whichever of the three time series
one chooses. Even if one discards Bootstrap altogether on the basis of this paper, the
NASA Team series clearly shows significant increases. These two facts imply that the
title of this paper is misleading, and so is much of the discussion and abstract. The
clearly significant increases in all 3 datasets are not accurately reflected by the paper
text, abstract, or title.

With the eyes of the climate change lobbies (on both sides) watching this debate, it
is very important that papers’ titles, abstract, and conclusions accurately convey the
facts. Very few journalists will check the content of the paper before reporting its title,
and no-one should be expected to examine the supplementary figures of a paper.”

Figure S5 from supplement here. The yellow circled items are the NASA team data that is not using the bootstrap algorithm.

Cryosphere S5

Sea Ice Update February 2 2014

A quick update for sea ice extent:

Global Sea Ice is 192,000 sq km above normal.
Antarctic Sea Ice is at record levels for this day and is 219,000 sq km above 2008 and 940,000 sq km above the 1981-2010 mean and on track to break the record for highest minimum.
Arctic Sea Ice is 746,000 sq km below the 1981-2010 mean.

Graphs below. Click for bigger.

Global_Sea_Ice_Extent_Zoomed_2014_Day_32_1981-2010 Antarctic_Sea_Ice_Extent_Zoomed_2014_Day_32_1981-2010 Arctic_Sea_Ice_Extent_Zoomed_2014_Day_32_1981-2010

Antarctic Sea Ice – 14th Daily Record of 2014 – 10th In A Row – Day 31

The 14th daily record for Antarctic Sea Ice Extent in 2014 was set yesterday on Jan 31 (Day 31). The old record was from 2008.

The old record was broken by 159,750 sq km. Sea Ice is 913,000 sq km above the 1981-2010 mean.

I’ve added the 2008 Highest Minimum point to this graph Data is here. Click for bigger.

Antarctic_Sea_Ice_Extent_Zoomed_2014_Day_31_1981-2010