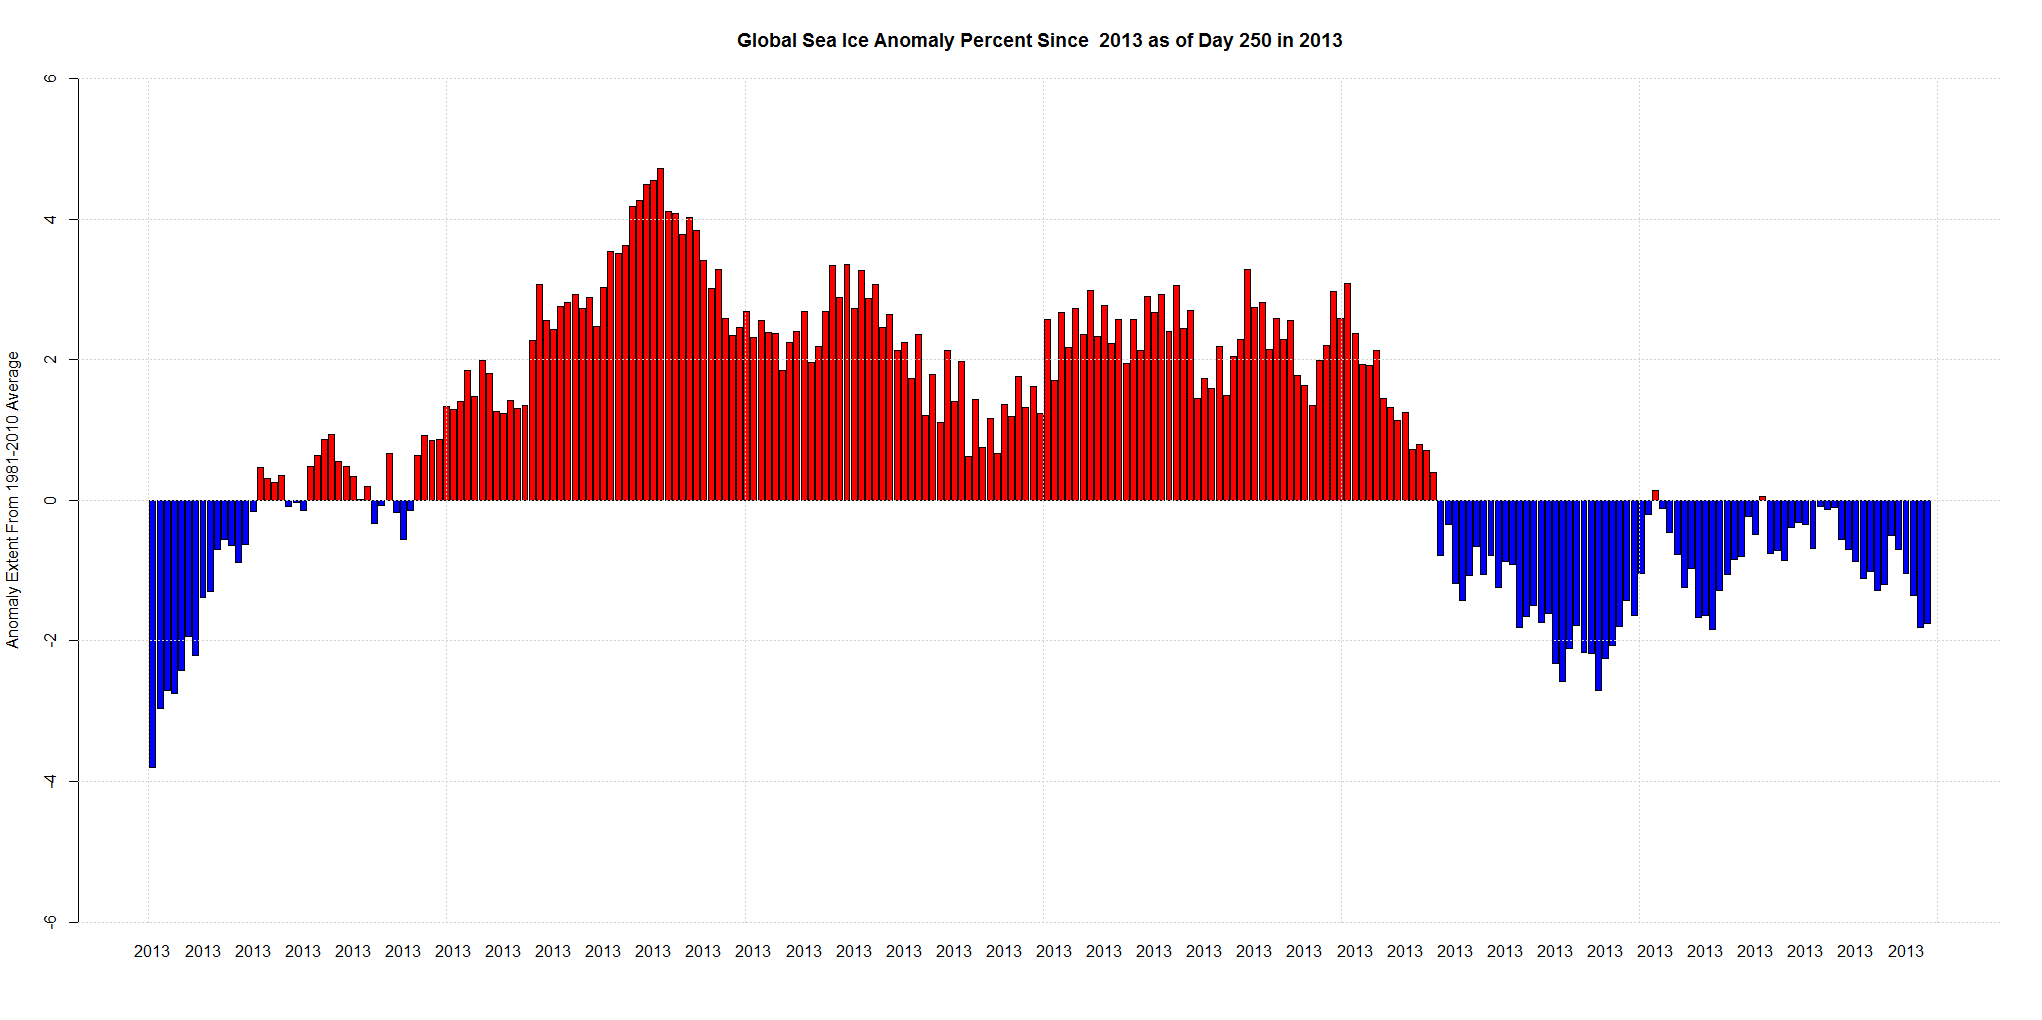
Right now the mean for the year for Global Sea Ice Anomaly percent is +0.7% above the 1981-2010 mean. The green line represents the mean.
The anomaly started out near -4%, rose to over +4% earlier in the year, down to-2% and is now back up to 1%.

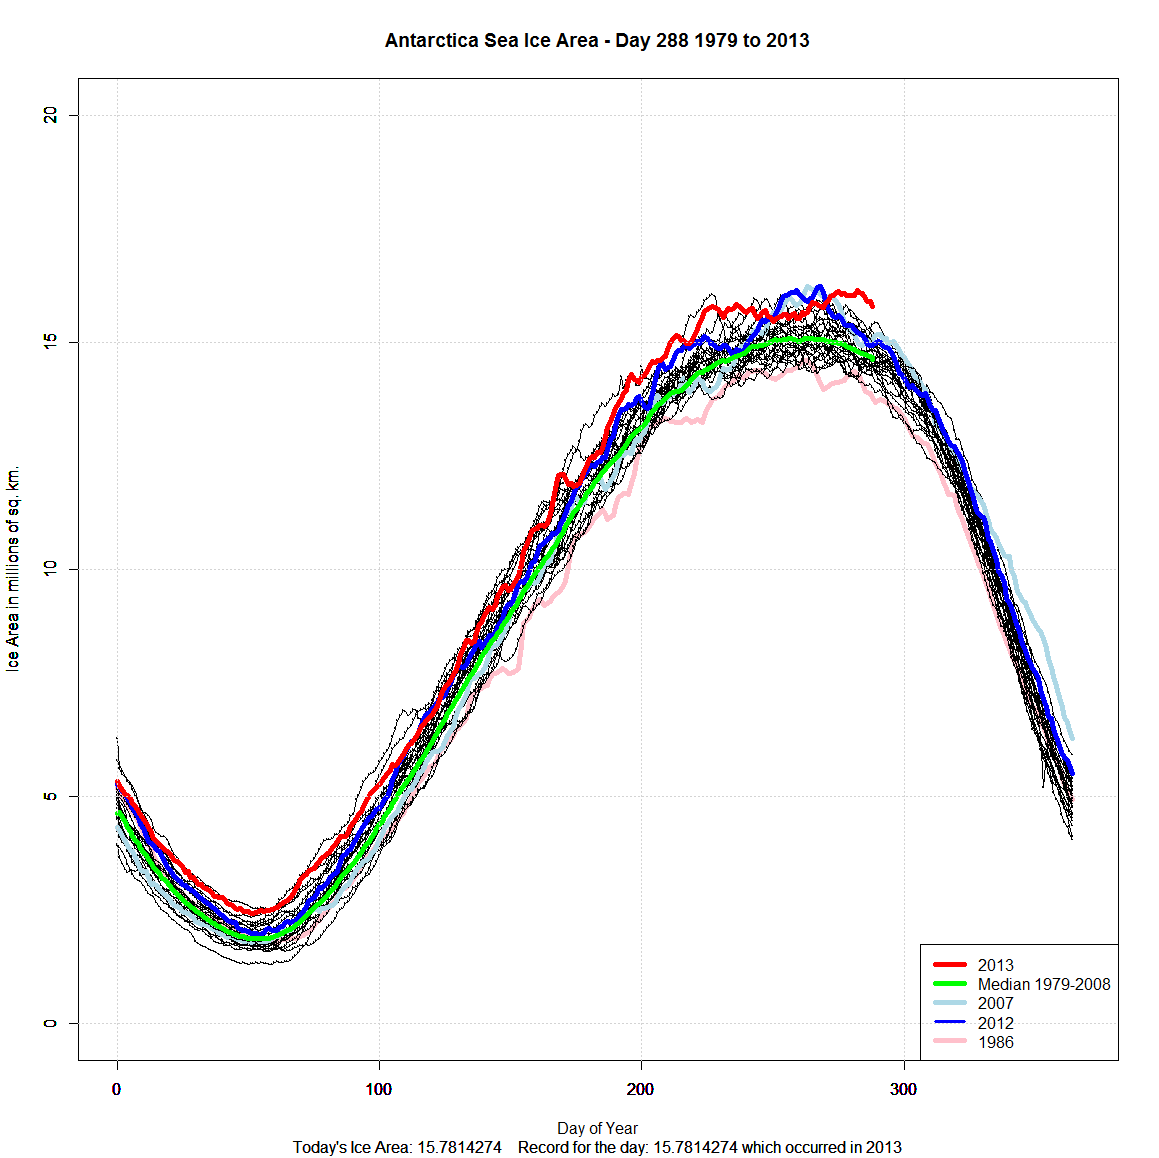
Antarctic Sea Ice Area came within 85,200 sq km short of an all time record. Sea Ice Area reached 16.14718 million sq km on day 282. This was the 7th highest of all time.
I normally do Sea Ice Extent, but Cryosphere uses Sea Ice Area.
Sea Ice Area had lagged Extent for most of the peak, but suddenly advanced after the normal maximum was reached. The maximum for 2013 was reached on day 282 which is 19 days later than the 2007 record.
2007 holds the record for most Sea Ice Area at 16.23238 million sq km.
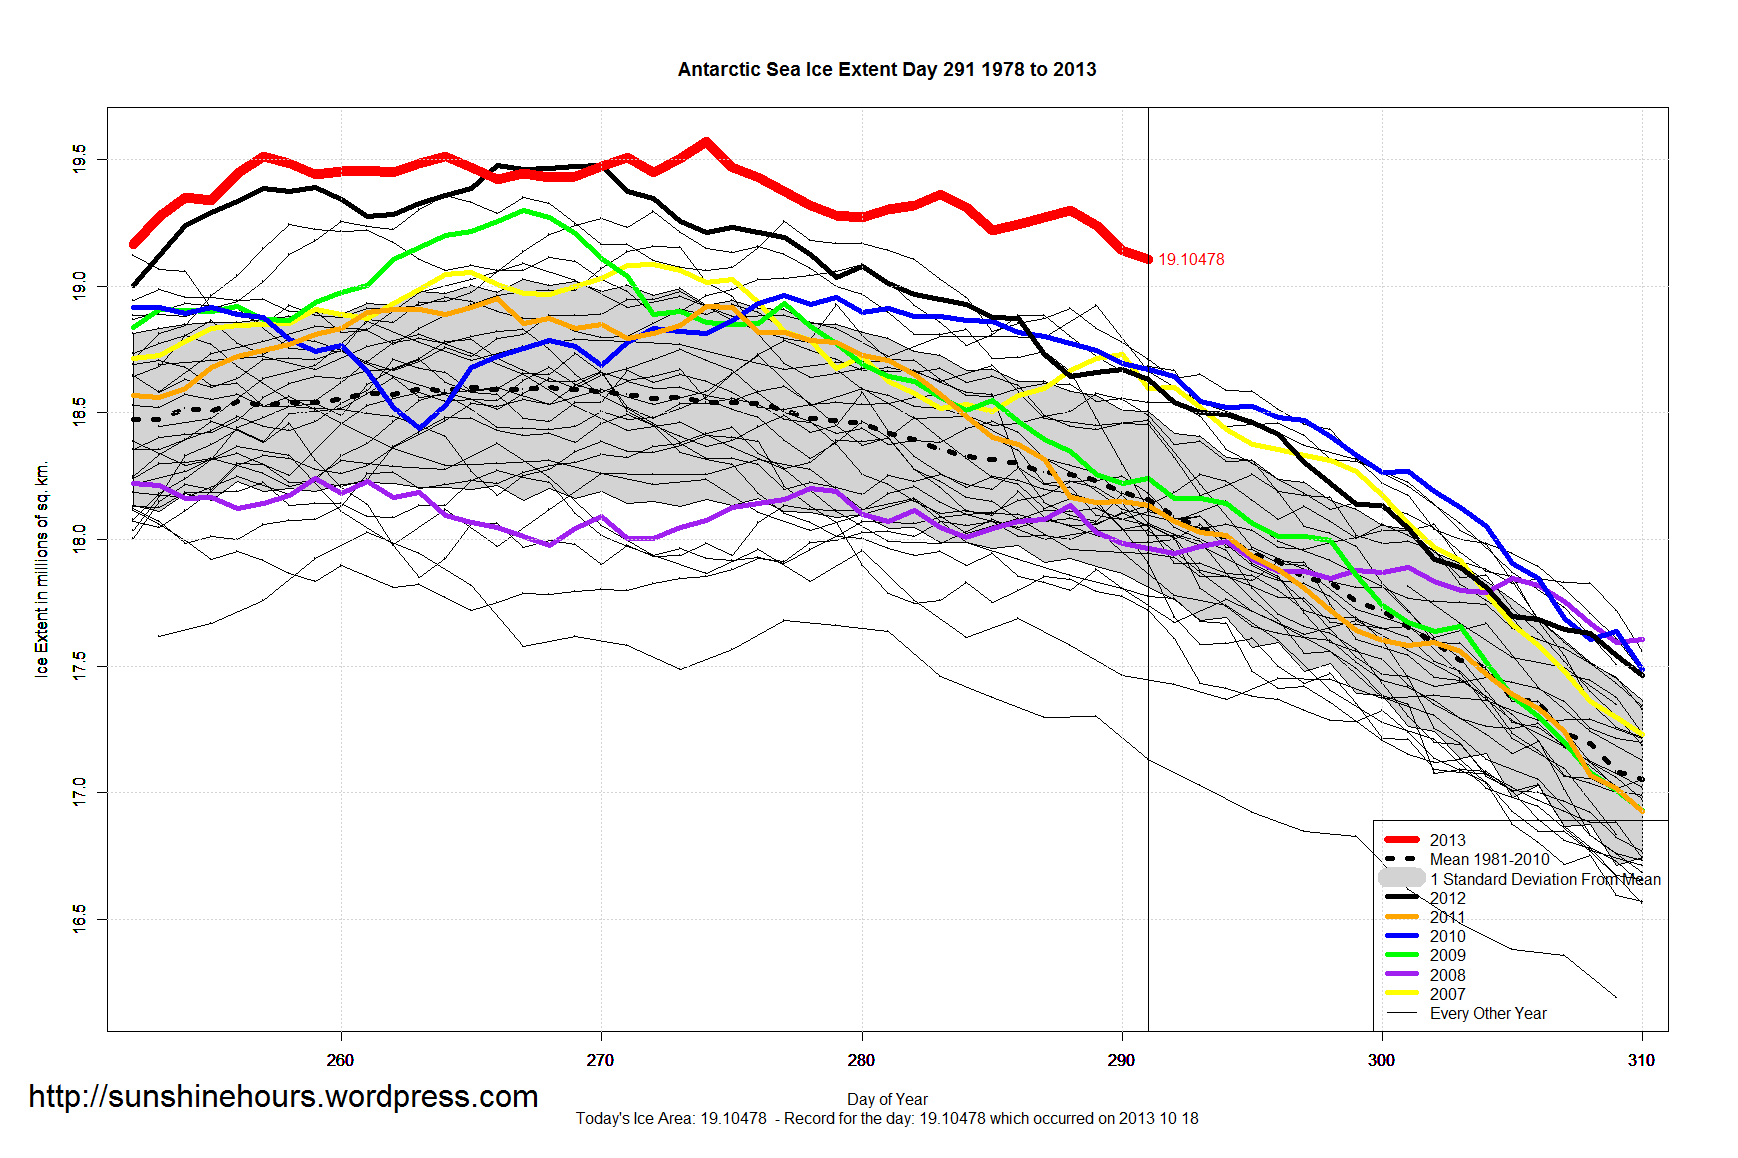
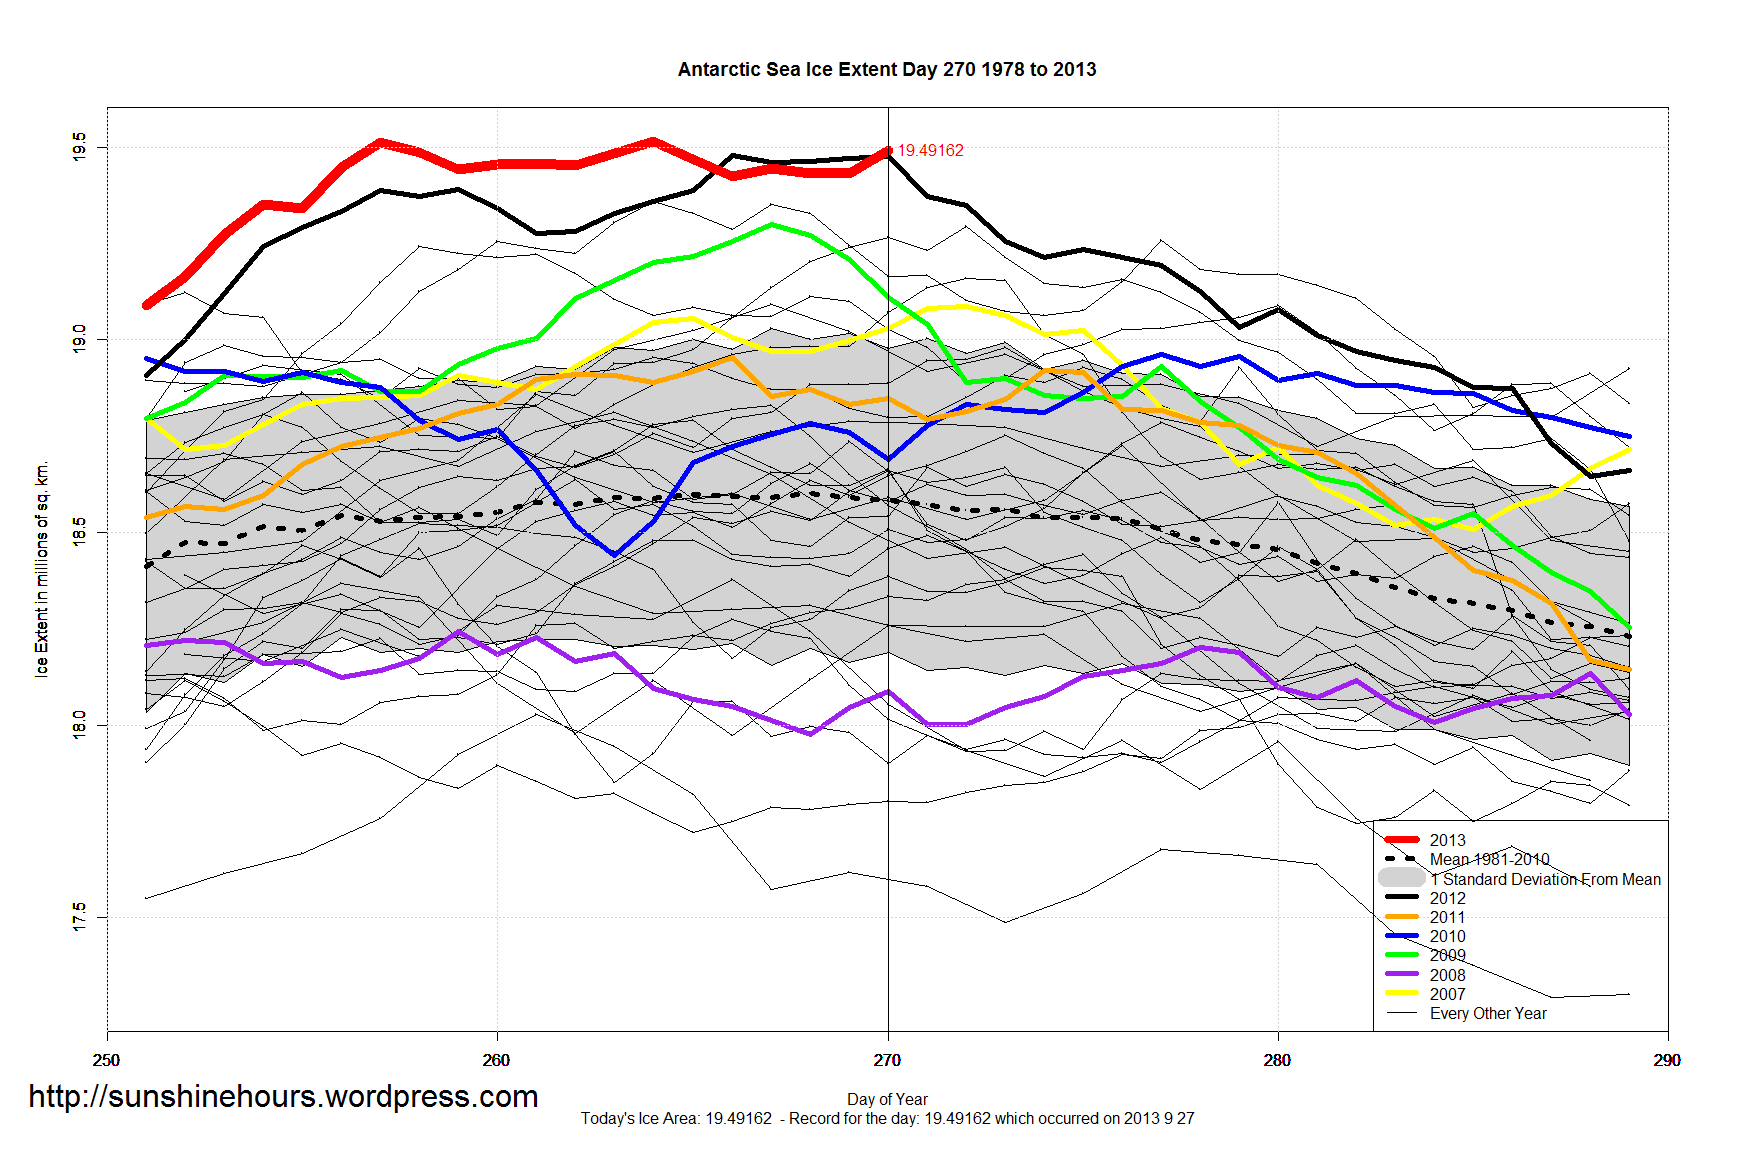
October 18th (Day 291) saw the 21st Daily Record for Antarctic Sea Ice Extent in a row! It was also the 75th daily record for 2013.
| Year | No of Daily Records |
| 2008 | 125 |
| 2010 | 107 |
| 2013 | 75 |
| 2007 | 21 |
| 2006 | 8 |
| 2009 | 8 |
| 2012 | 8 |
| 2000 | 4 |
| 2004 | 3 |
| 2005 | 3 |
| 1979 | 2 |
| 1998 | 2 |
There are only 73 days left in the year so I’m not sure if 2013 can set a record for most daily records. It has a chance at coming 2nd. And considering how far above the previous years records (400,000 sq km) anything could happen.
Click graph for bigger. Data is here.
Antarctica set a third All-Time Record for sea ice extent while the US federal government was “shutdown”. Data here.
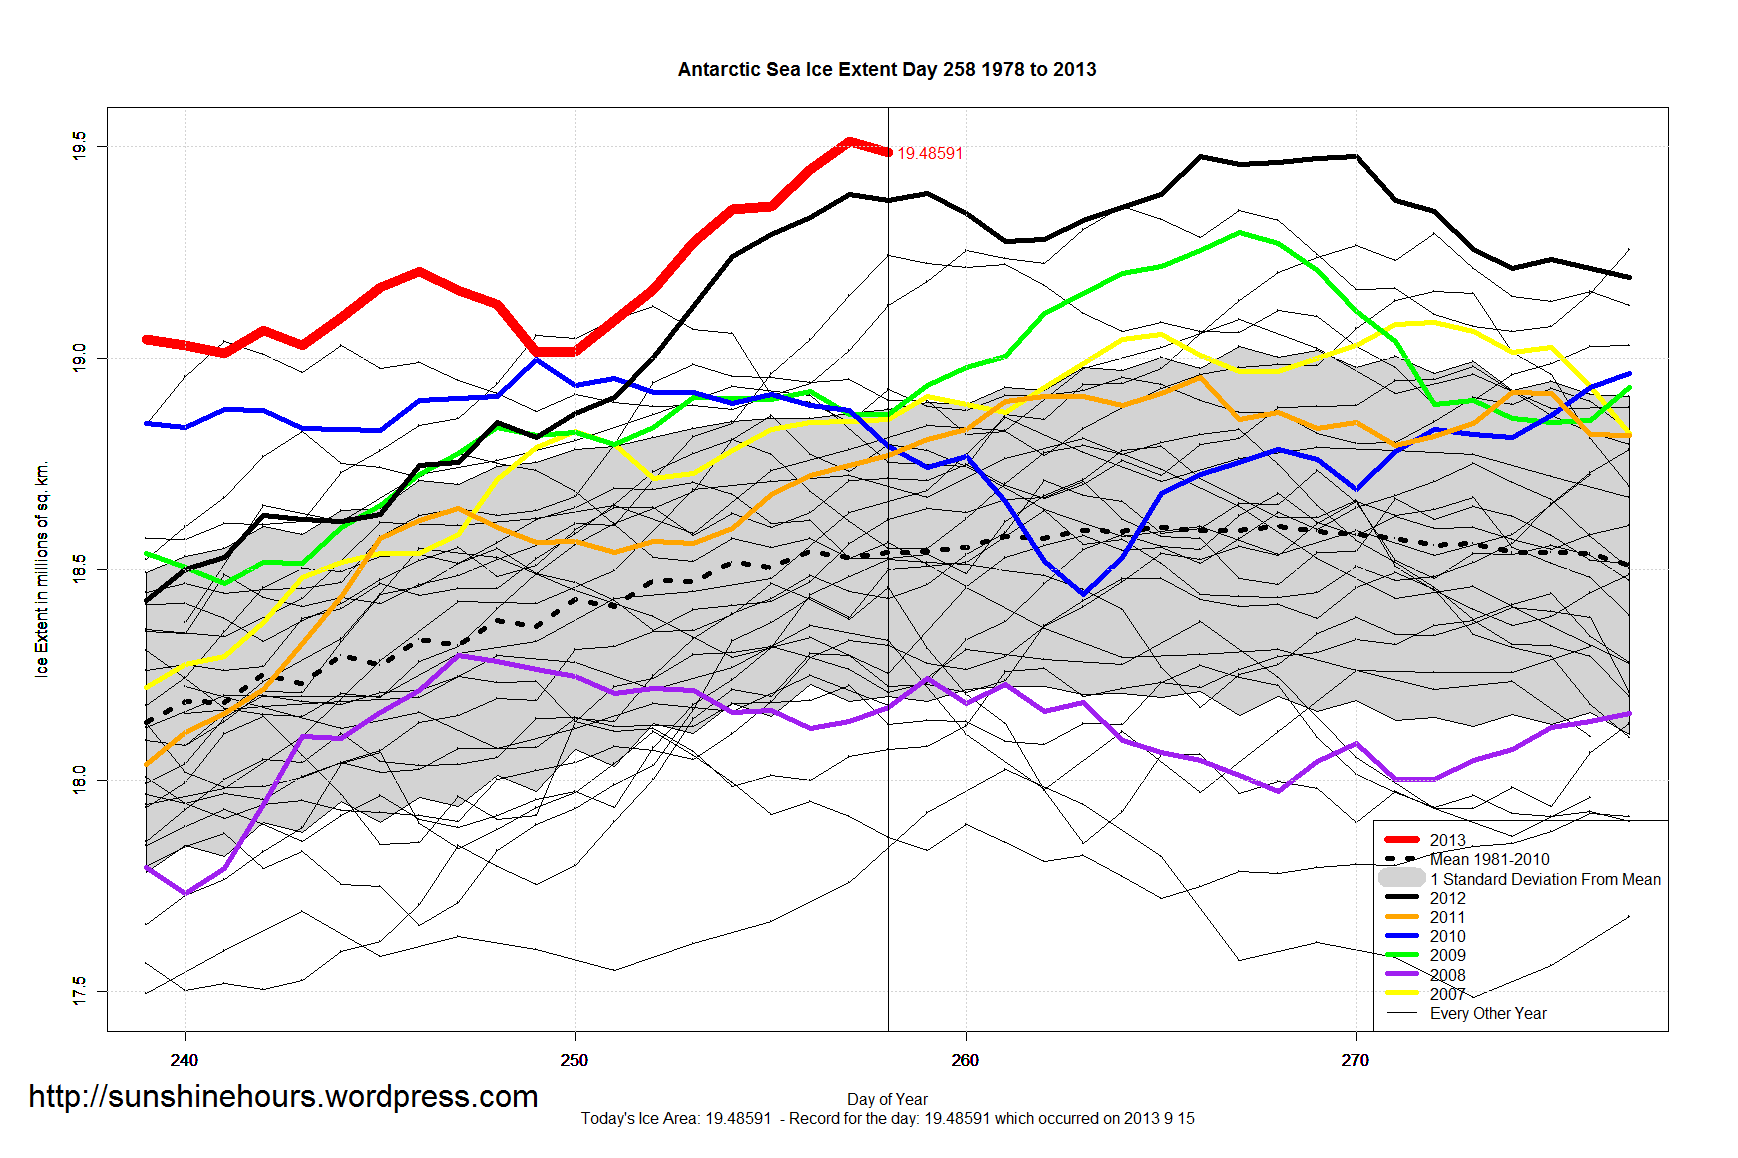
The first All-Time Record was September 14th with 19.51234 million sq km. (I am using all the digits for a good reason)
The 2nd All-Time Record was September 21 with 19.51394 million sq km. – only 1600 sq km higher.
Then the shutdown happened and all the data I use was frozen at September 30th. Today the data was updated.
The 3rd All-Time Record was set on October 2nd with 19.57088 million sq km.
Here is a portion of the latest graph showing the 3rd record.
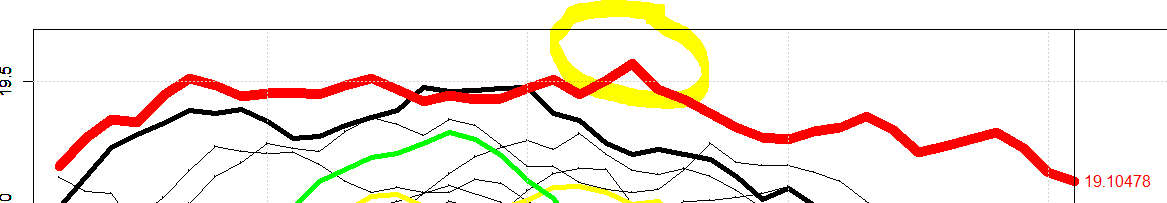
The graph below contains data up until October 18 – Day 291. Click to make bigger.
Update: Below I noted that “there could have been one more record”. I was right. A 3rd All-time Record for Antarctic Sea Extent was set.
On October 3rd NSIDC put out a press release on the Arctic/Antarctic Sea Ice.
Let us take a look at the comments on Antarctic Sea Ice.
“As the Arctic was reaching its minimum extent for the year, Antarctic sea ice was reaching record high levels, culminating in a Southern Hemisphere winter maximum extent of 19.47 million square kilometers (7.52 million square miles) on September 22. ”
Wrong. The 2012 record was 19.47 million sq km on September 22, 2012. The 2013 record was 19.51234 million and was set on September 14th. Then the record was broken again with 19.51394 million sq km on September 21, 2013.
And looking at the graph until October 1st (when the shutdown ended the data ) there could have been one more record.
“The September 2013 monthly average was also a record high, at 19.77 million square kilometers (7.63 million square miles) slightly higher than the previous record in 2012.”
Wrong. The September 2013 monthly average was 19.35 million sq km which was 100,000 sq km higher than the September 2012 average of 19.25 million sq km. ”
One or two scientists claim it is because of the wind. But it could be the AMO and/or ocean temperatures. I think the wind claim is just an excuse.
“In contrast to the sharp downward trend in September Arctic sea ice, Antarctic September sea ice has been increasing at 1.1 percent per decade relative to the 1981 to 2010 average.”
And the anomaly at maxium was 900,000 sq km above the 1981-2010 average.
“The tiny gain in Antarctica’s ice is an interesting puzzle for scientists,” said NSIDC lead scientist Ted Scambos.
Tiny Gain? The September average in 1986 was 17.69 million sq km. In 2013 it was 19.35 million sq km. That is 1.6 million sq km higher!
“The rapid loss of ice in the Arctic should be ringing alarm bells for everyone.”
If it wasn’t for the August 2012 Cyclone. The trend would be up from 2007.
There were no NSIDC sea ice updates today. I emailed NSIDC to ask why and got this prompt and polite reply.
“Thank you for contacting the National Snow and Ice Data Center.Because our data provider, the National Oceanic and Atmospheric Administration (NOAA), has shut down the data stream as part of the government shutdown, we are temporarily unable to update the product.
I apologize for the inconvenience.
Best regards,
xxxxxxxx xxxxxxxxxx
NSIDC User Services”
Antarctic Sea Ice Extent doesn’t want to start melting.
Day 273 is 248,000 sq km higher than the previous daily record set in 2012.And is only 9110 sq km lower than the all-time record set 9 days ago.
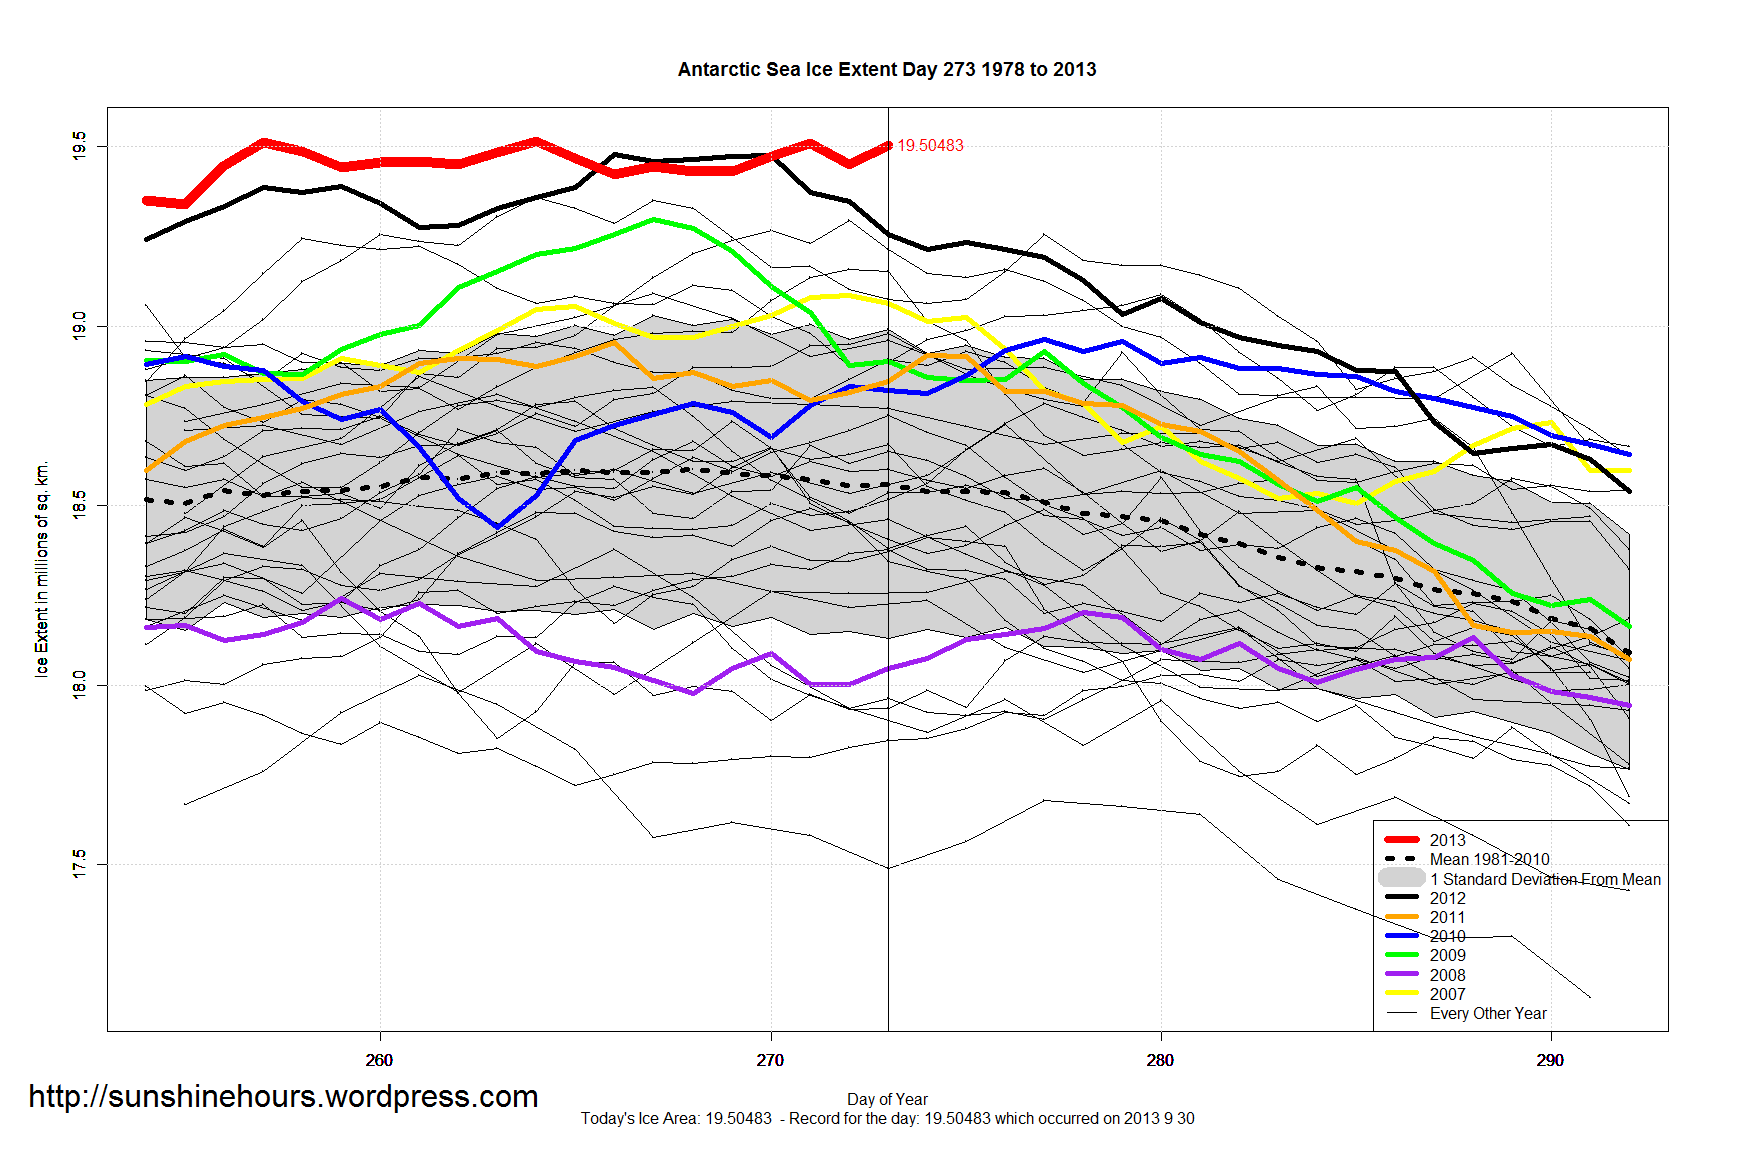

Antarctica Sea Ice Extent took an unexpected 50,000 sq km jump yesterday. It was the 3rd highest extent of all-time.
The top 5 Antarctic Sea Ice Extents of all-time all occurred since Sept 14th 2013. 10 out of the top 15 were in 2013. The remaining 5 occurred in 2012.
2013 has also set 55 daily records.
Click graph for bigger. Data is here.
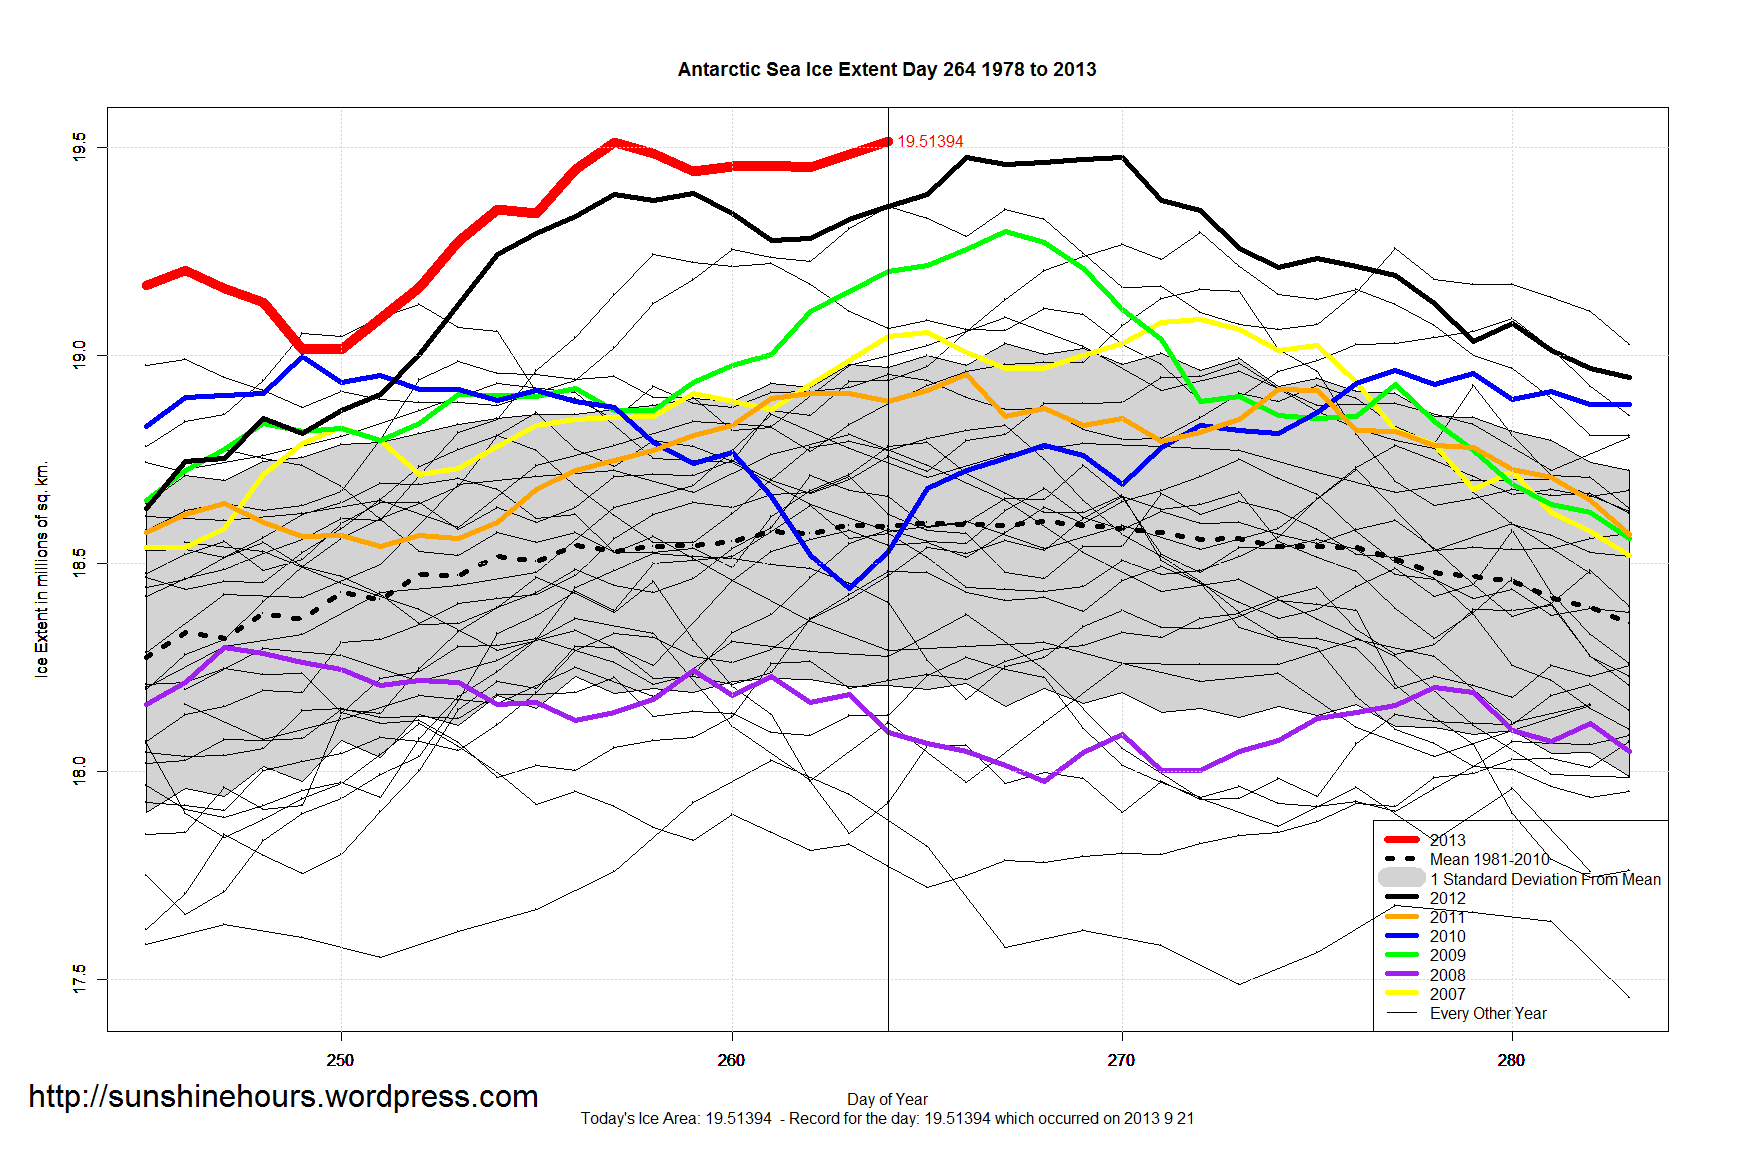
Antarctica Sea Ice Extent set another all-time record of 19.51394 million sq km on Sept 22 2013.
The old record was 19.51234 million sq km which was set on September 14 2013 (Day 257).
The record was broken by .00264 million sqk km.
Click graph for bigger. Data is here.
Antarctic Sea Ice Extent has dropped two days in a row (see below) after setting an all time record.
It may very well rise again. But I thought I would publish some stats.
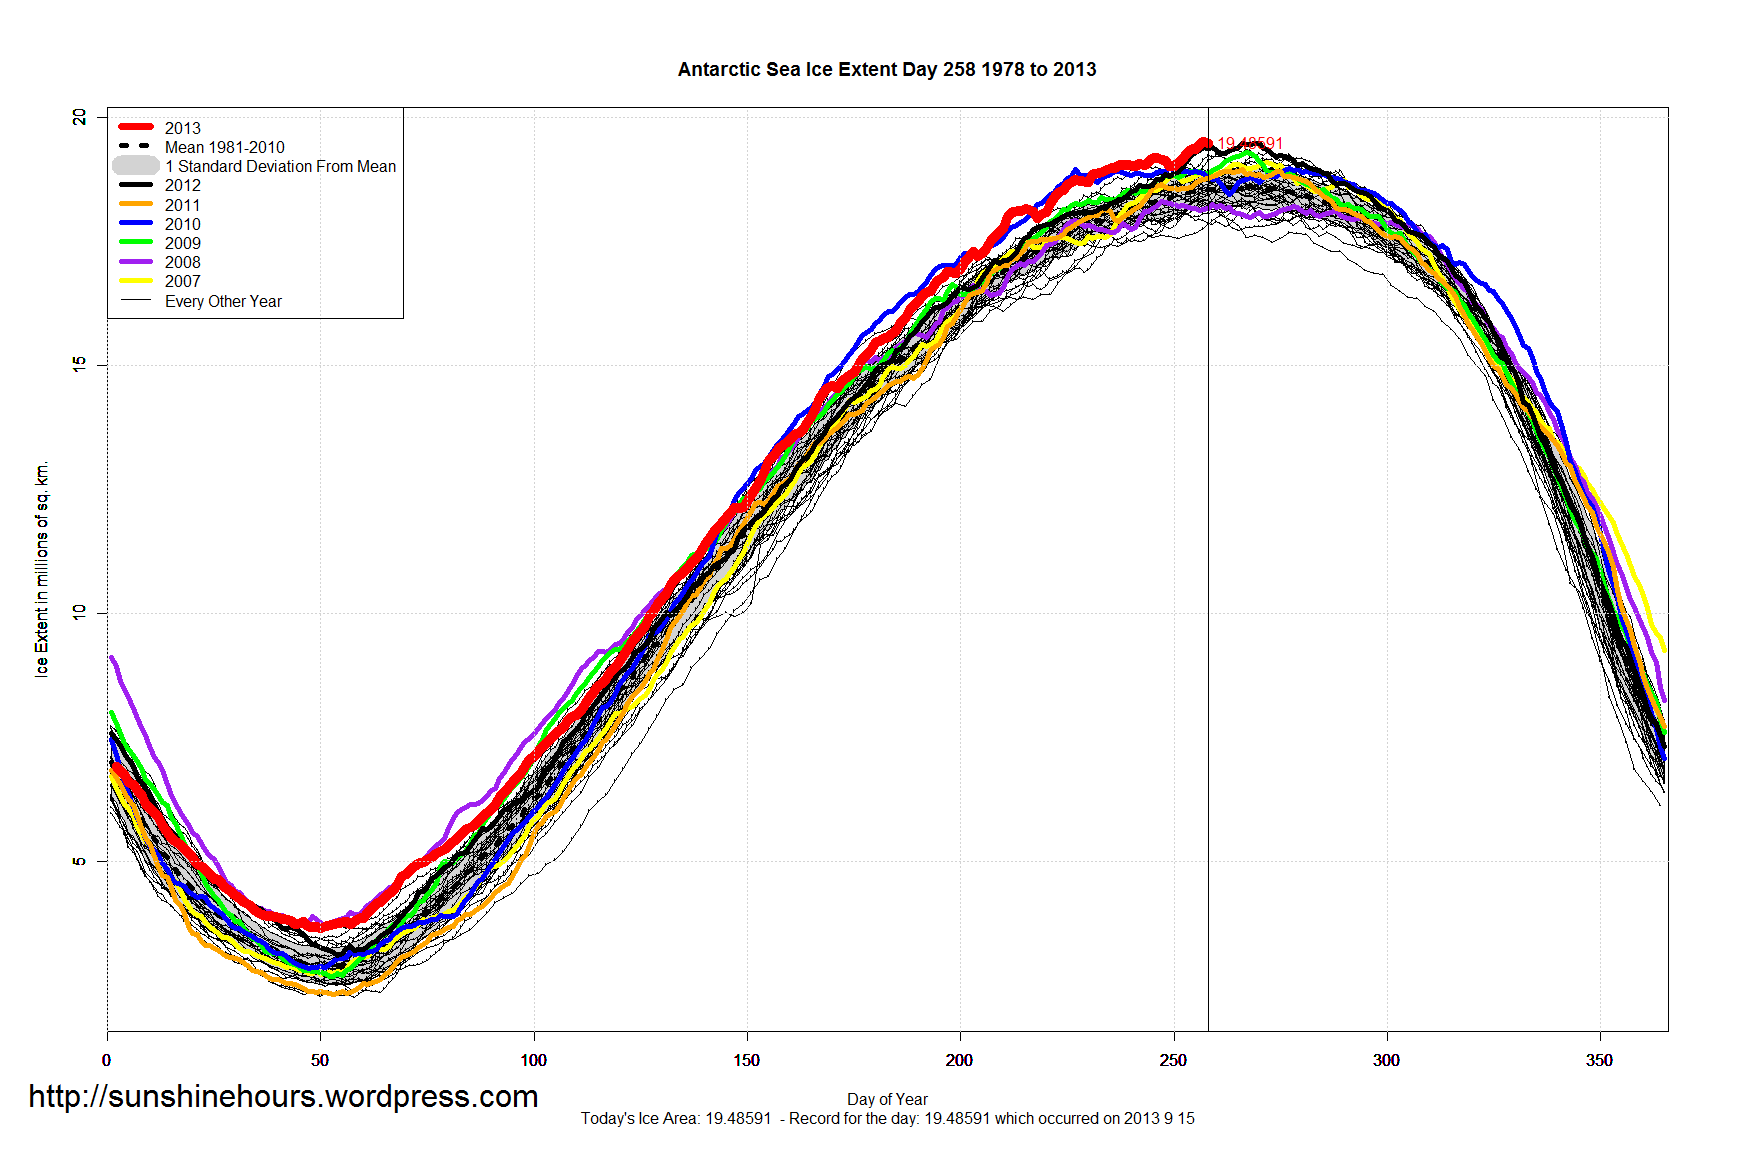
Maximum Sea Ice Extent for 2013 occurred (so far) on day 257 which was the 10th earliest. The earliest was day 243 in 1994. The latest was day 277 in 1988. The lowest max was in 1986.
Minimum Sea Ice Extent for 2013 occurred on day 50 which was the 7th earliest. It was the 2nd highest minimum behind 2008. The earliest minimum was also in 1994 on day 43. The latest minimum occurred on day 65 in 1986. The lowest minimum was in 1997.
| Year | Min | Max | day of Max | day of Min |
| 2013 | 3.6504 | 19.51234 | 257 | 50 |
| 2012 | 3.11109 | 19.47713 | 266 | 54 |
| 2011 | 2.31884 | 18.95328 | 266 | 53 |
| 2010 | 2.8422 | 18.9968 | 249 | 47 |
| 2009 | 2.67096 | 19.29864 | 267 | 53 |
| 2008 | 3.69176 | 18.29726 | 247 | 51 |
| 2007 | 2.7227 | 19.08545 | 272 | 50 |
| 2006 | 2.4866 | 19.35934 | 264 | 51 |
| 2005 | 2.80387 | 19.29451 | 272 | 49 |
| 2004 | 3.25927 | 19.12341 | 252 | 51 |
| 2003 | 3.6257 | 18.67907 | 268 | 48 |
| 2002 | 2.69691 | 18.11556 | 252 | 51 |
| 2001 | 3.44094 | 18.49324 | 271 | 50 |
| 2000 | 2.58248 | 19.15817 | 272 | 49 |
| 1999 | 2.70723 | 18.98068 | 273 | 51 |
| 1998 | 2.7715 | 19.2433 | 258 | 56 |
| 1997 | 2.26415 | 18.79094 | 265 | 58 |
| 1996 | 2.59733 | 18.83039 | 267 | 56 |
| 1995 | 3.32988 | 18.7353 | 269 | 55 |
| 1994 | 3.08286 | 18.8266 | 243 | 43 |
| 1993 | 2.28078 | 18.709 | 263 | 50 |
| 1992 | 2.49238 | 18.4663 | 255 | 54 |
| 1991 | 2.55355 | 18.66993 | 273 | 58 |
| 1990 | 2.78435 | 18.3788 | 273 | 53 |
| 1989 | 2.7229 | 18.27368 | 266 | 51 |
| 1988 | 2.63862 | 18.78456 | 277 | 55 |
| 1987 | 3.01642 | 18.52332 | 258 | 52 |
| 1986 | 2.95395 | 18.02672 | 261 | 65 |
| 1985 | 2.60211 | 18.93215 | 254 | 50 |
| 1984 | 2.38292 | 18.37747 | 266 | 58 |
| 1983 | 2.84656 | 18.81042 | 263 | 55 |
| 1982 | 2.8927 | 18.55004 | 246 | 52 |
| 1981 | 2.69524 | 18.85906 | 261 | 51 |
| 1980 | 2.52686 | 19.09137 | 267 | 57 |
| 1979 | 2.91521 | 18.36699 | 256 | 48 |

