Sea Ice Update April 8 2014 – Global Sea Ice 959,000 Above The Mean and Antarctica Set Another Record

A quick update for sea ice extent:

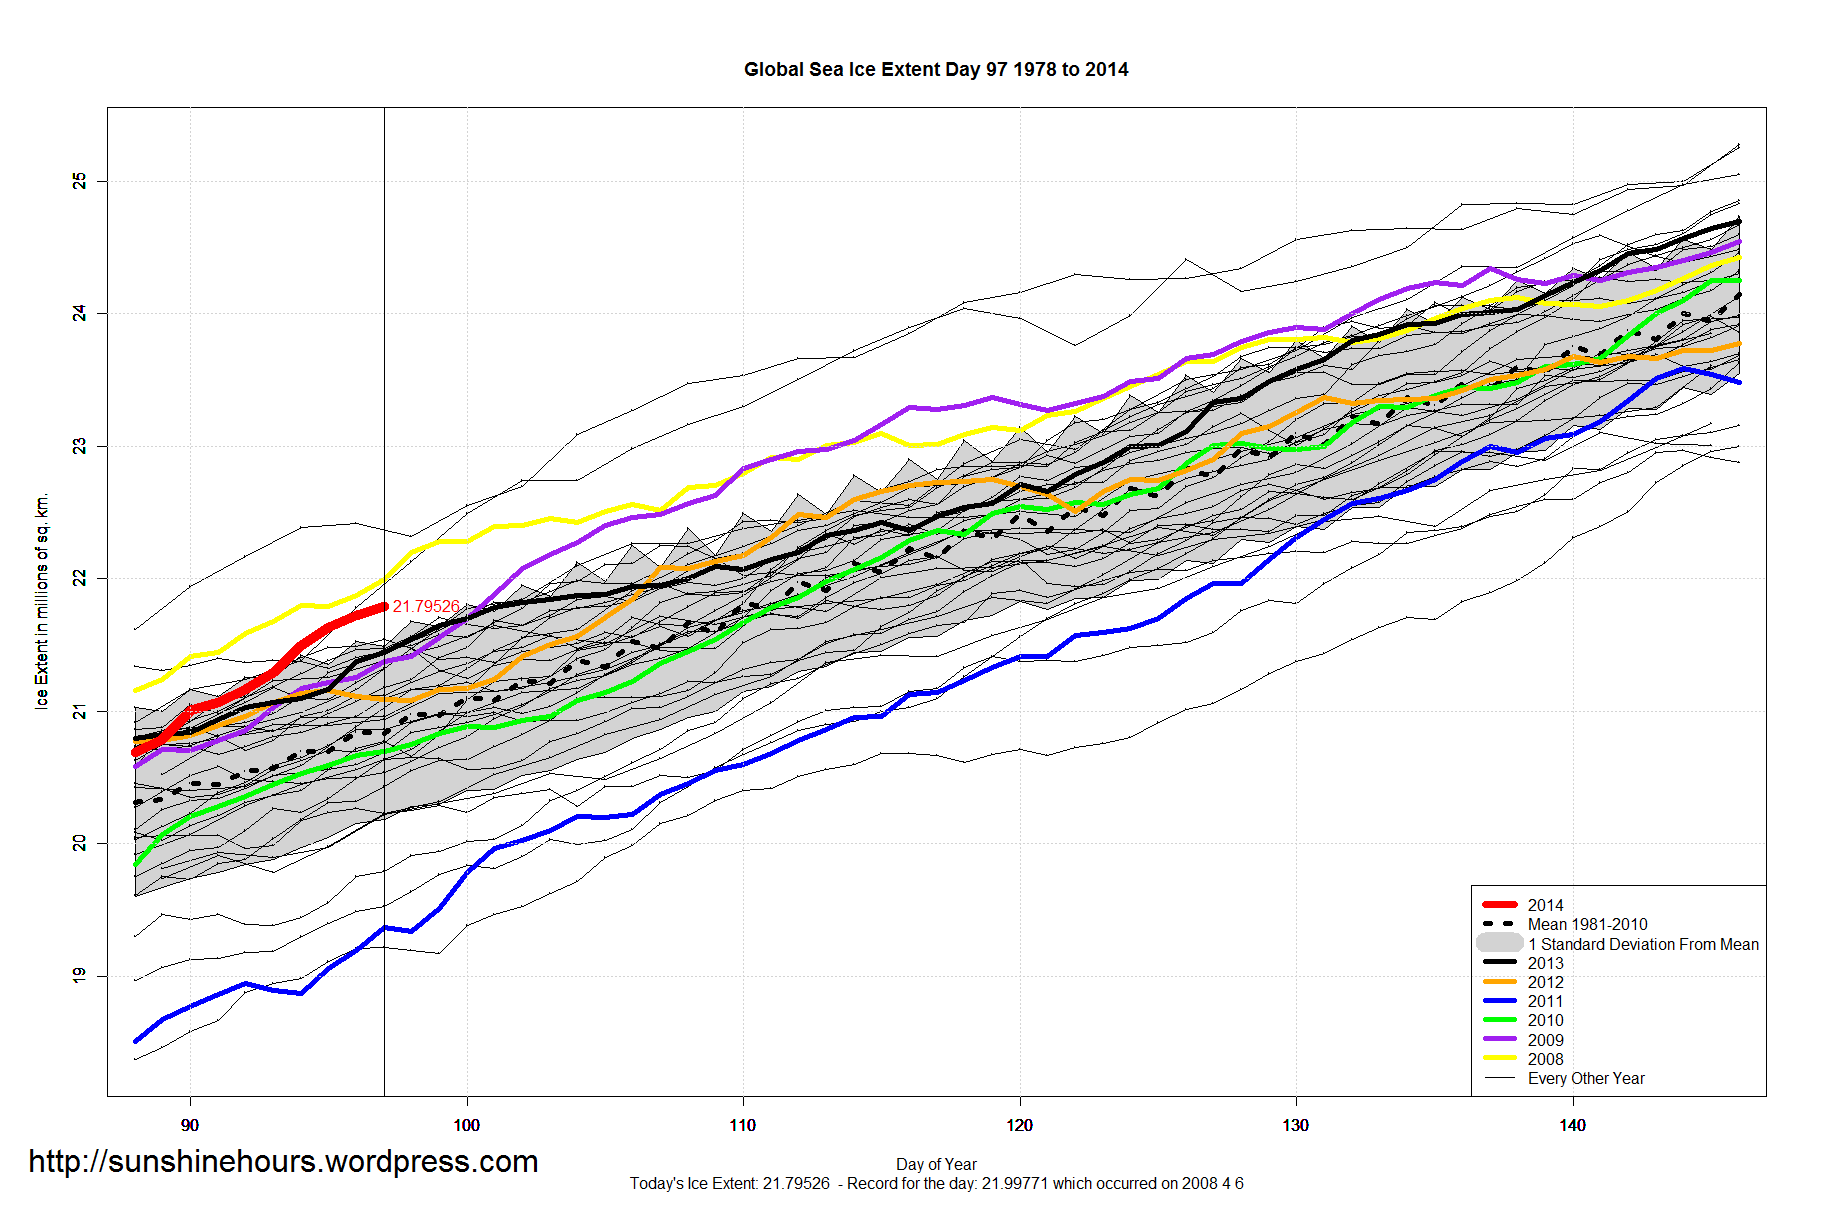
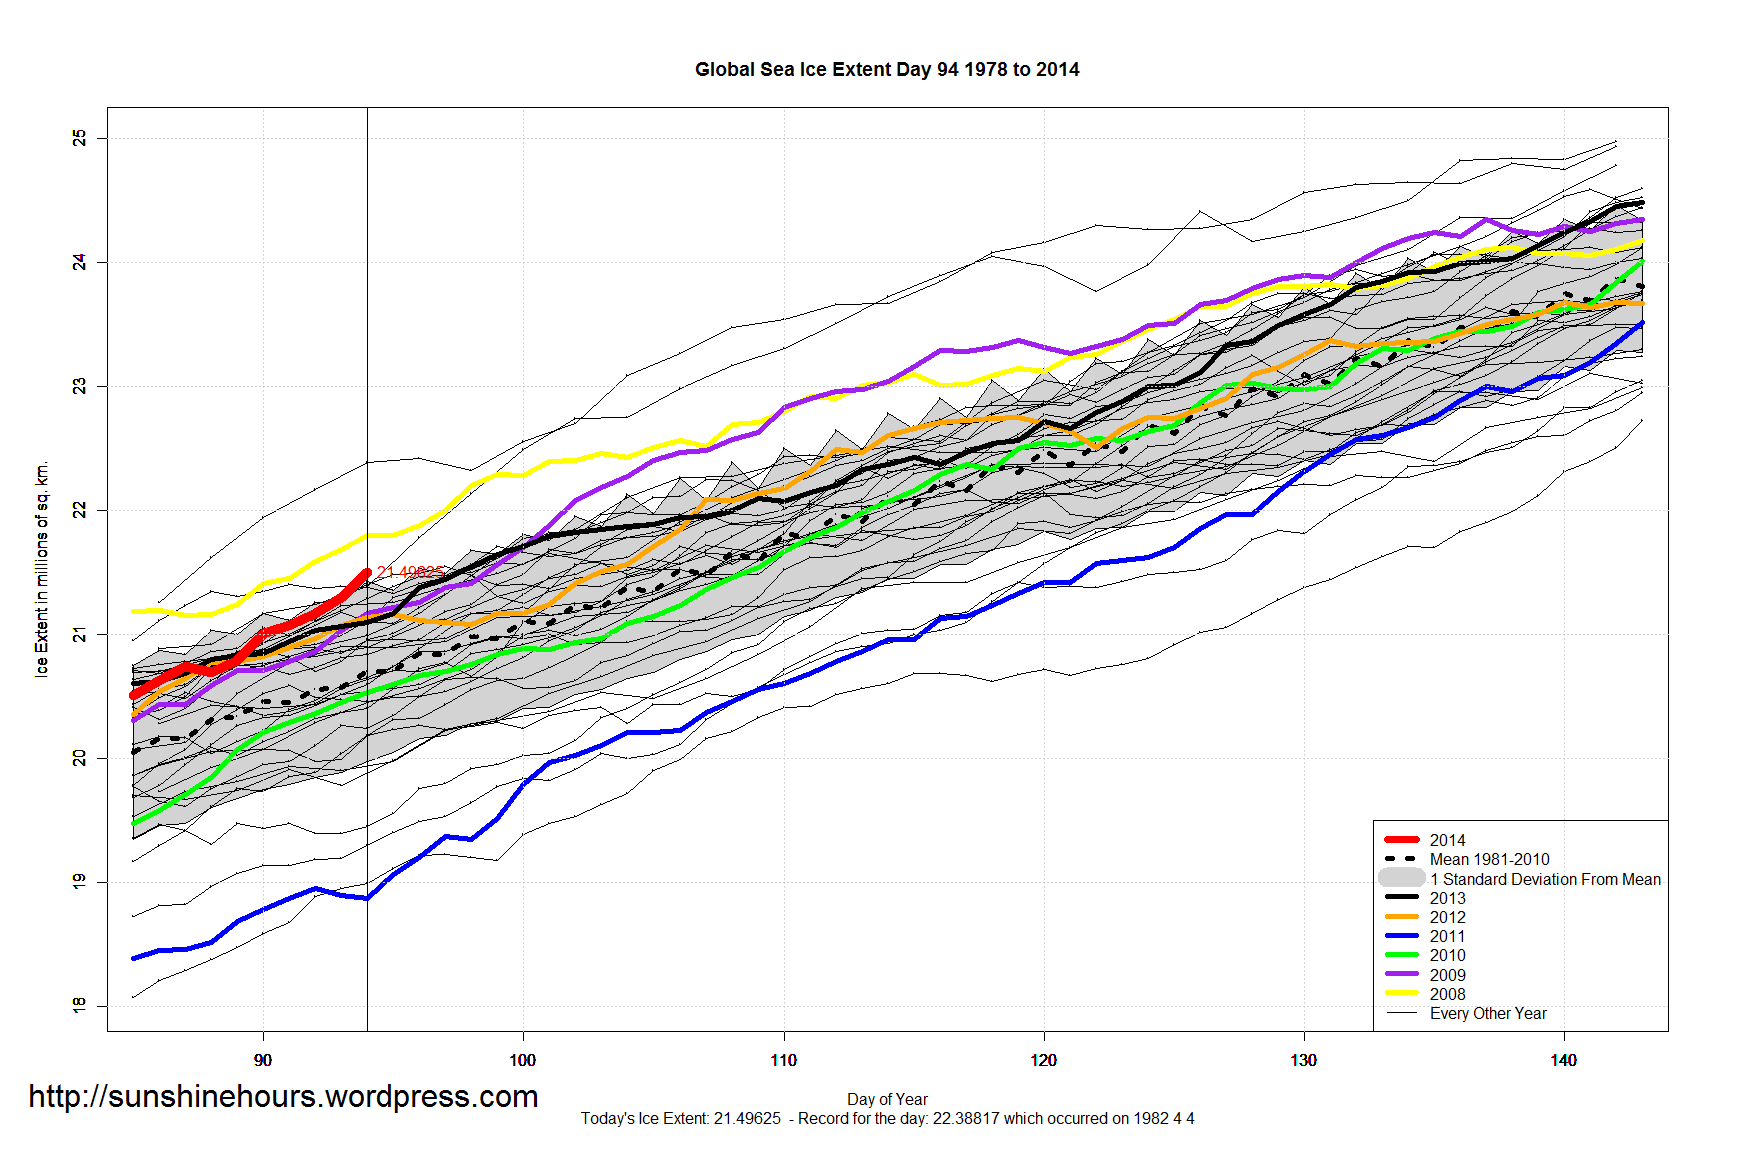
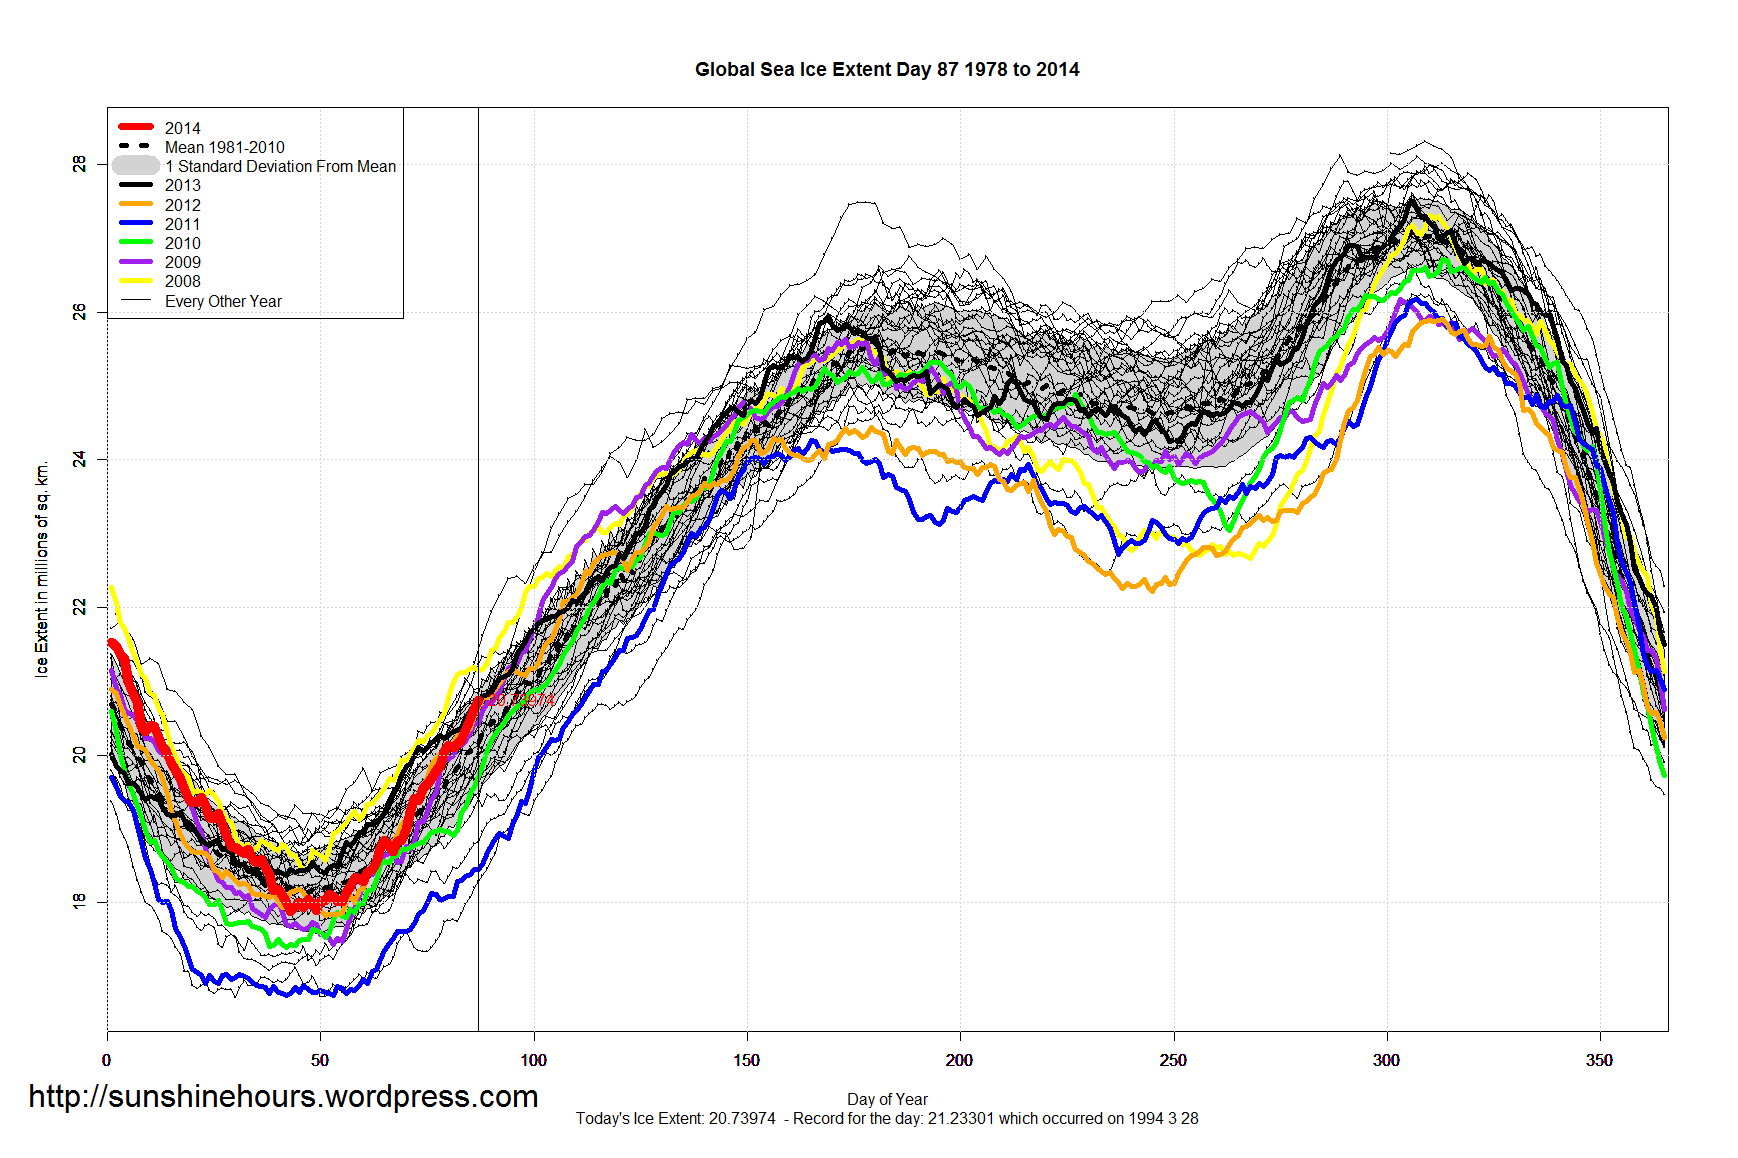
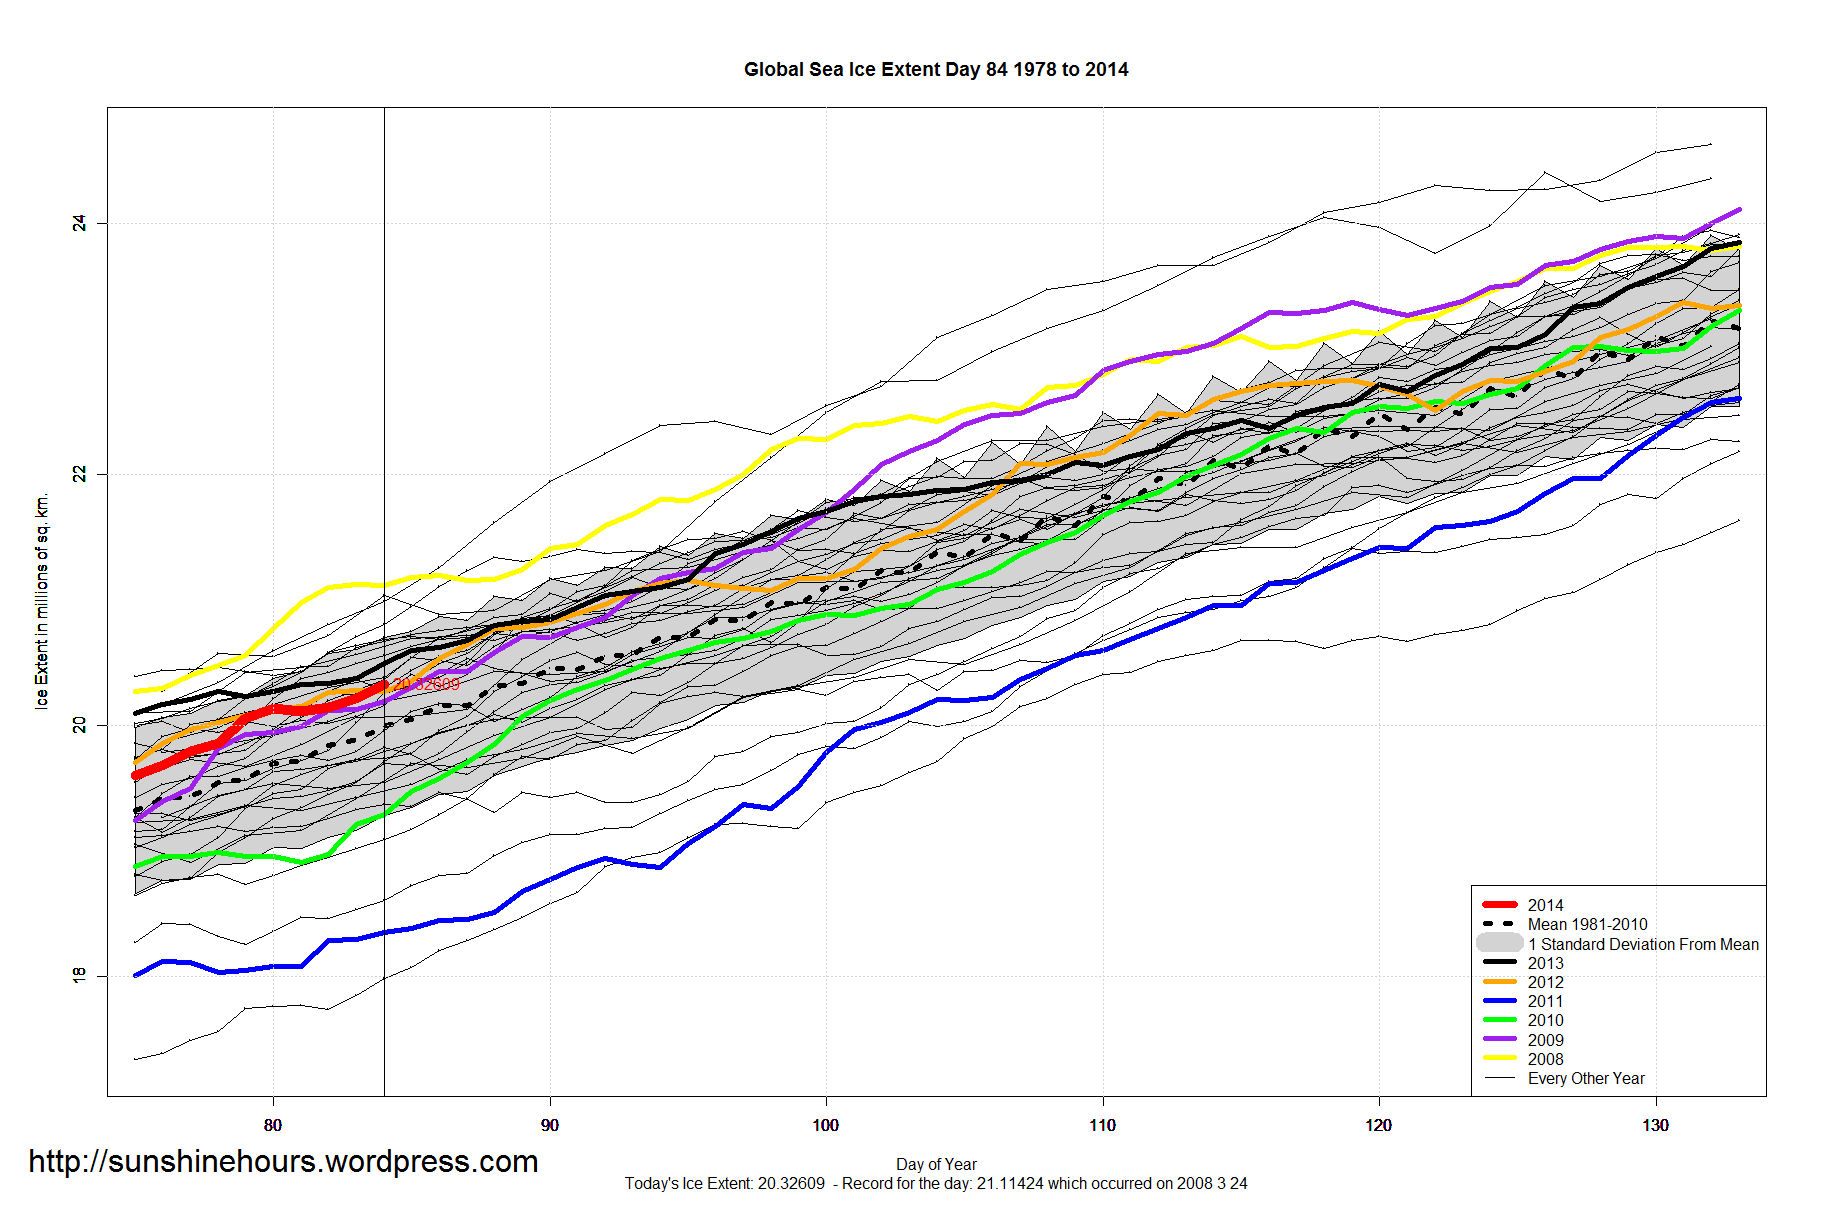
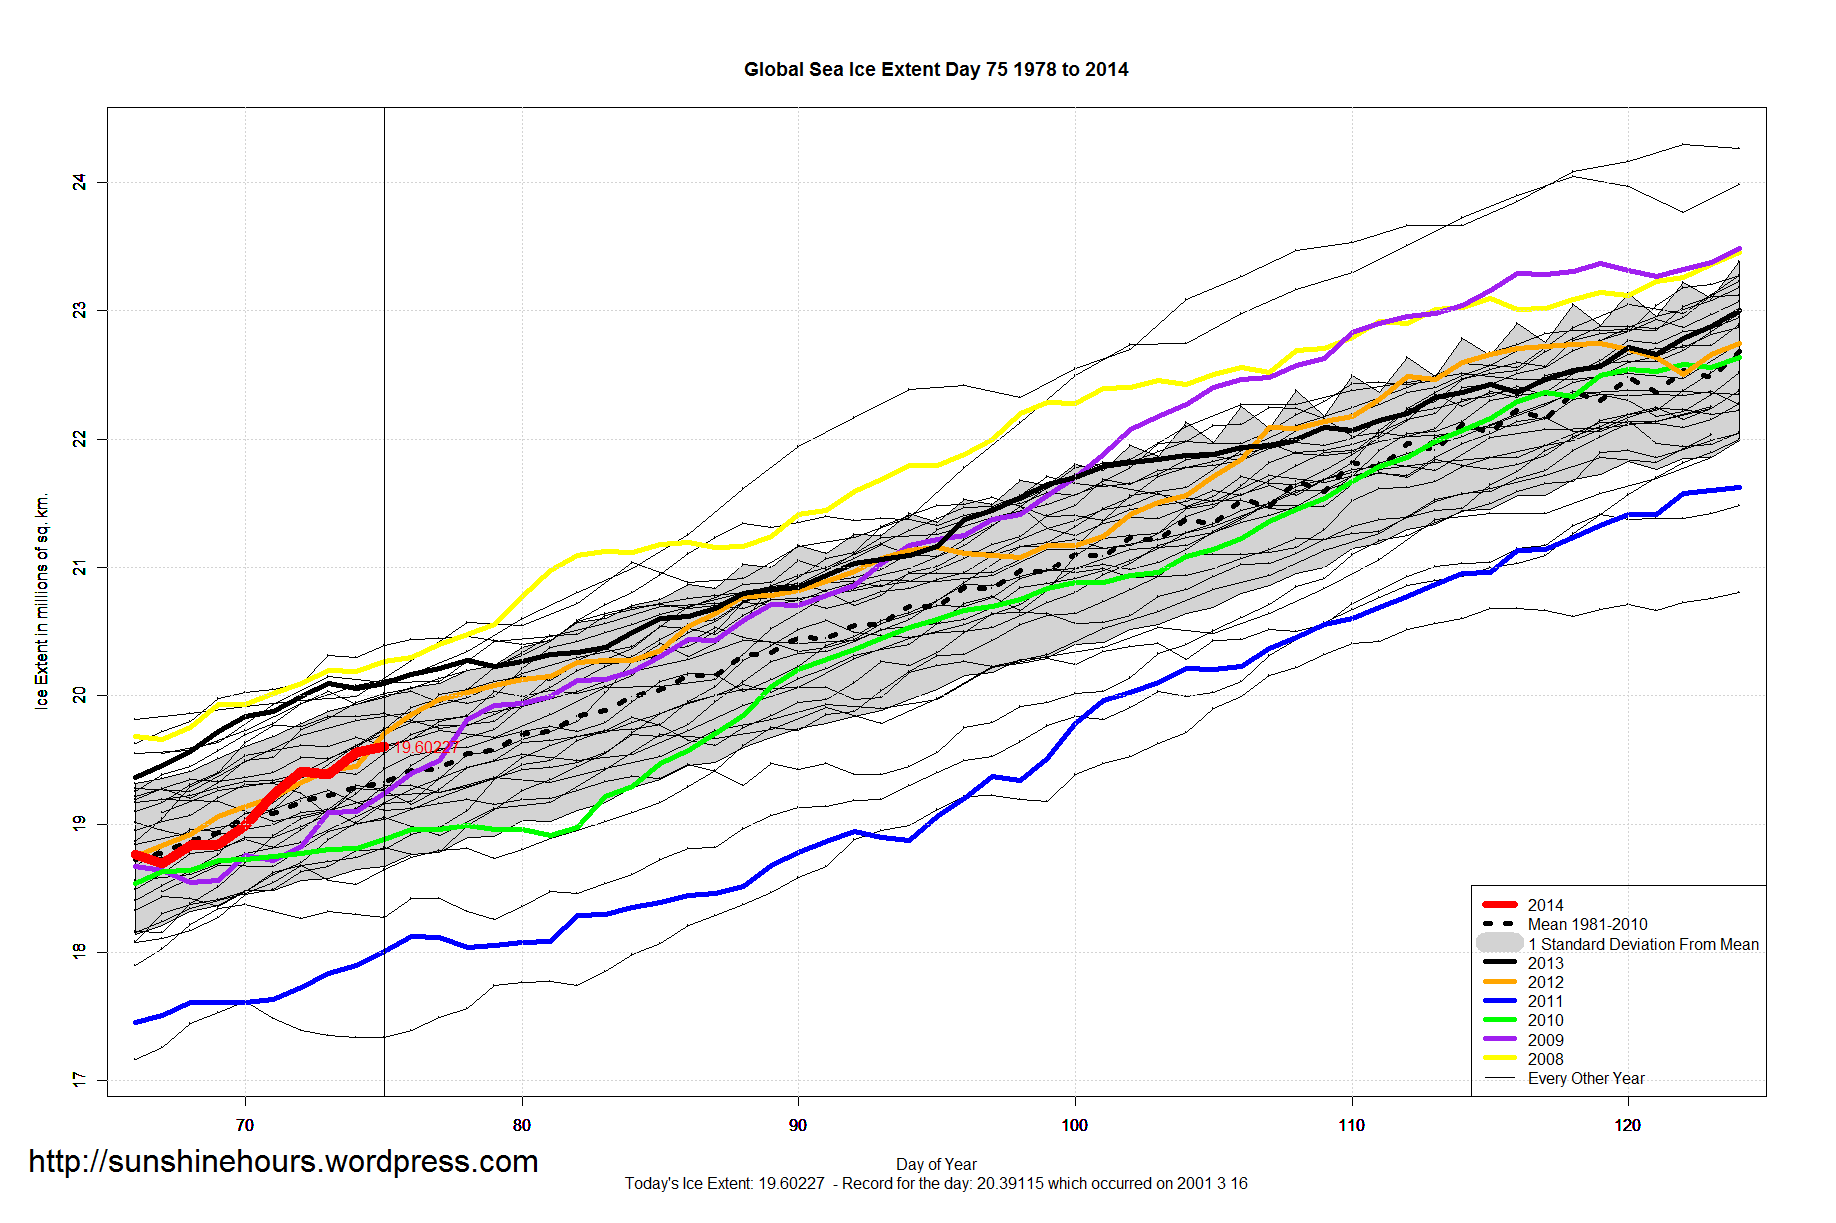
  • Global Sea Ice Extent is 959,000 above the 1981-2010 mean. That is ranked 4th for the day. And that is 4.61% above ‘normal’.
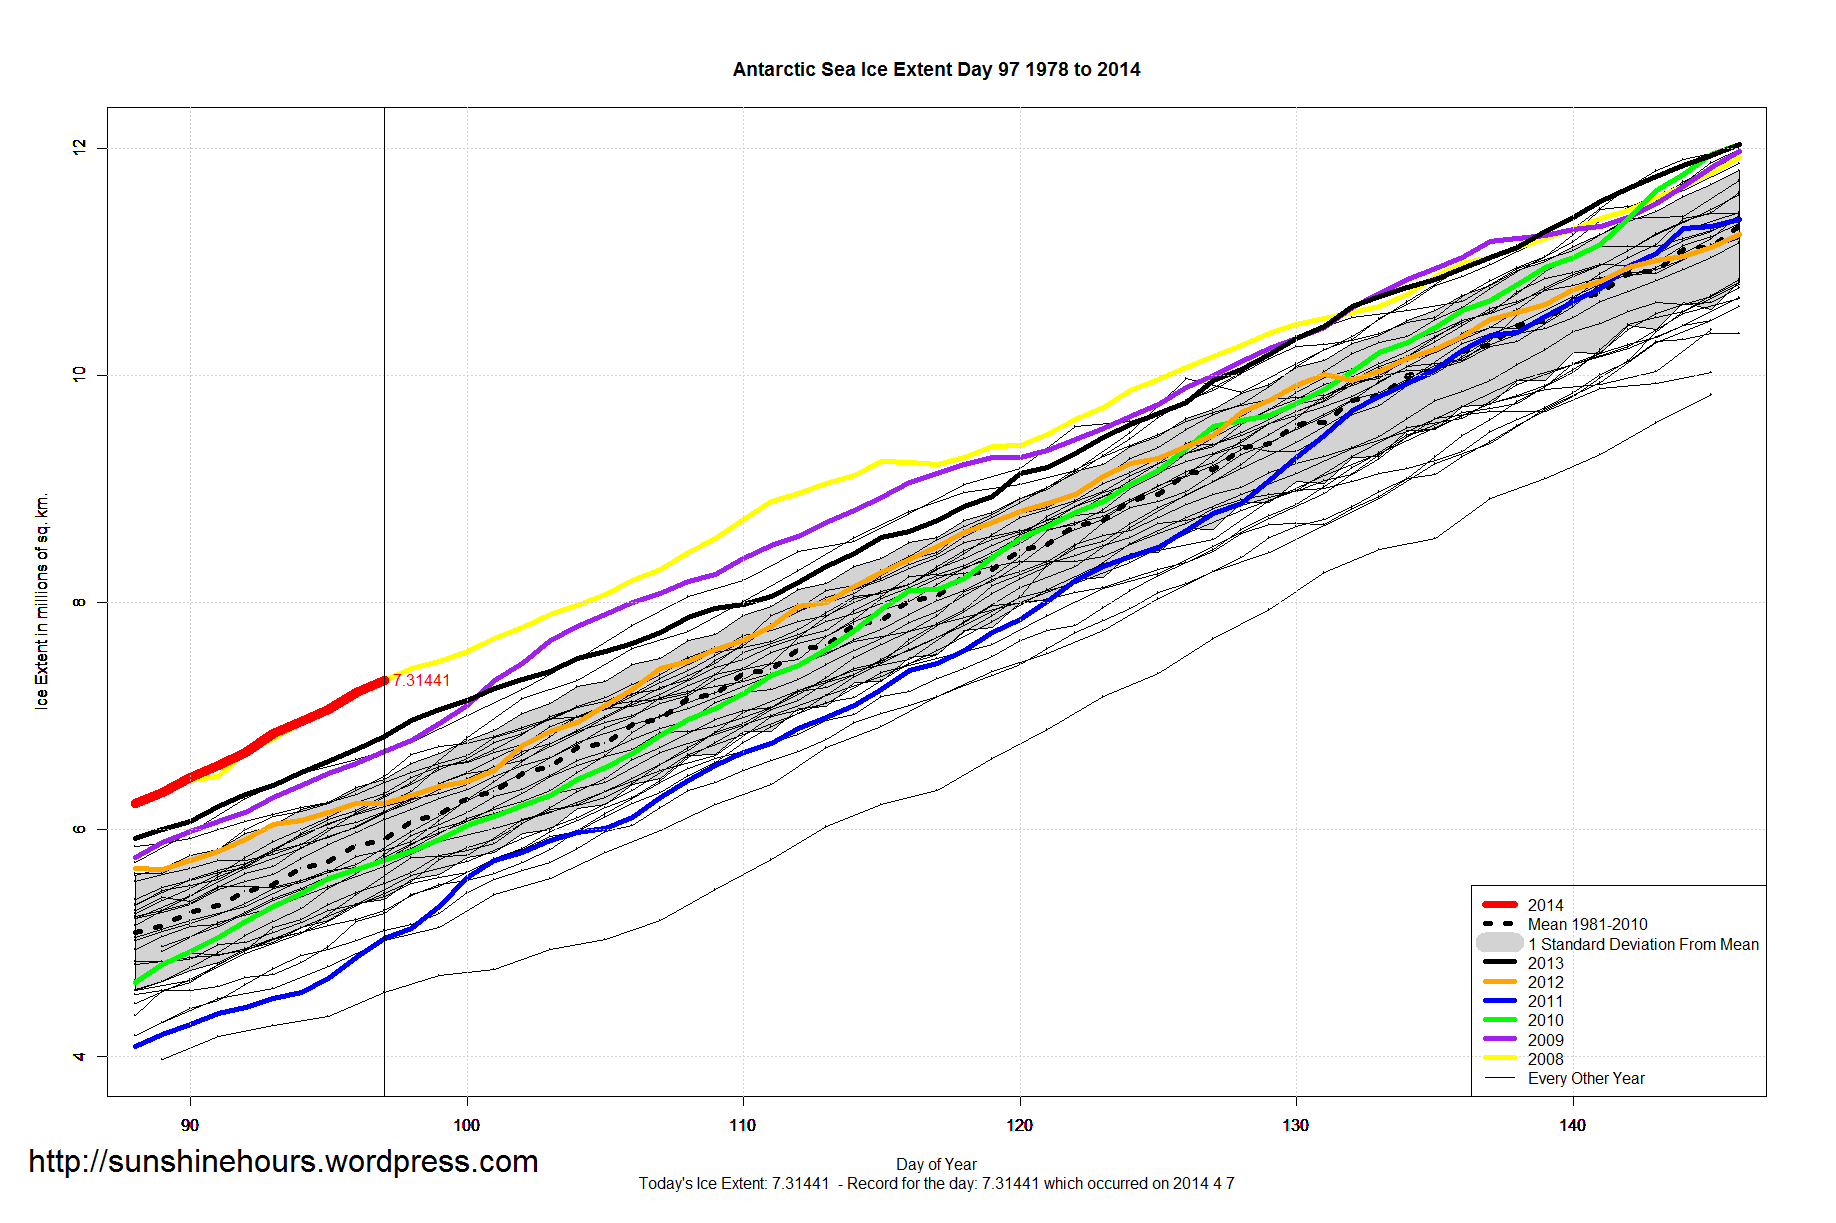
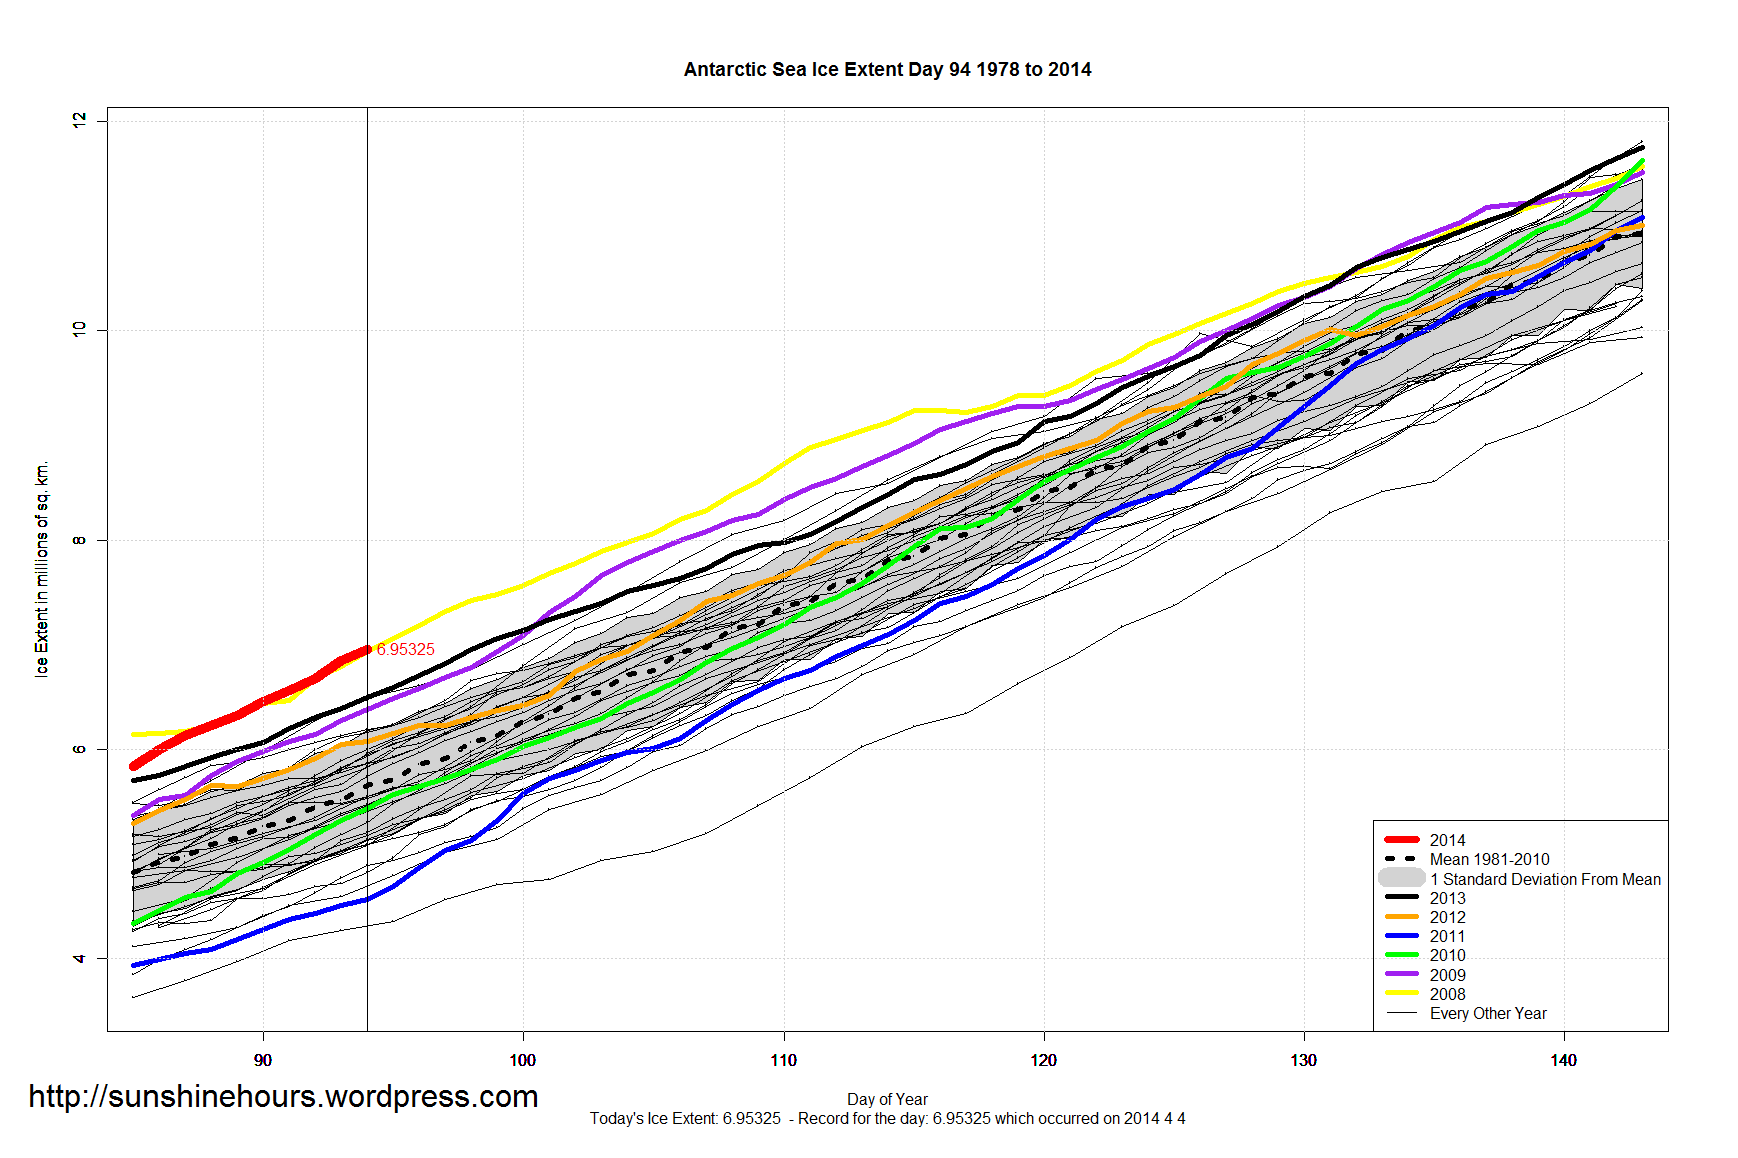
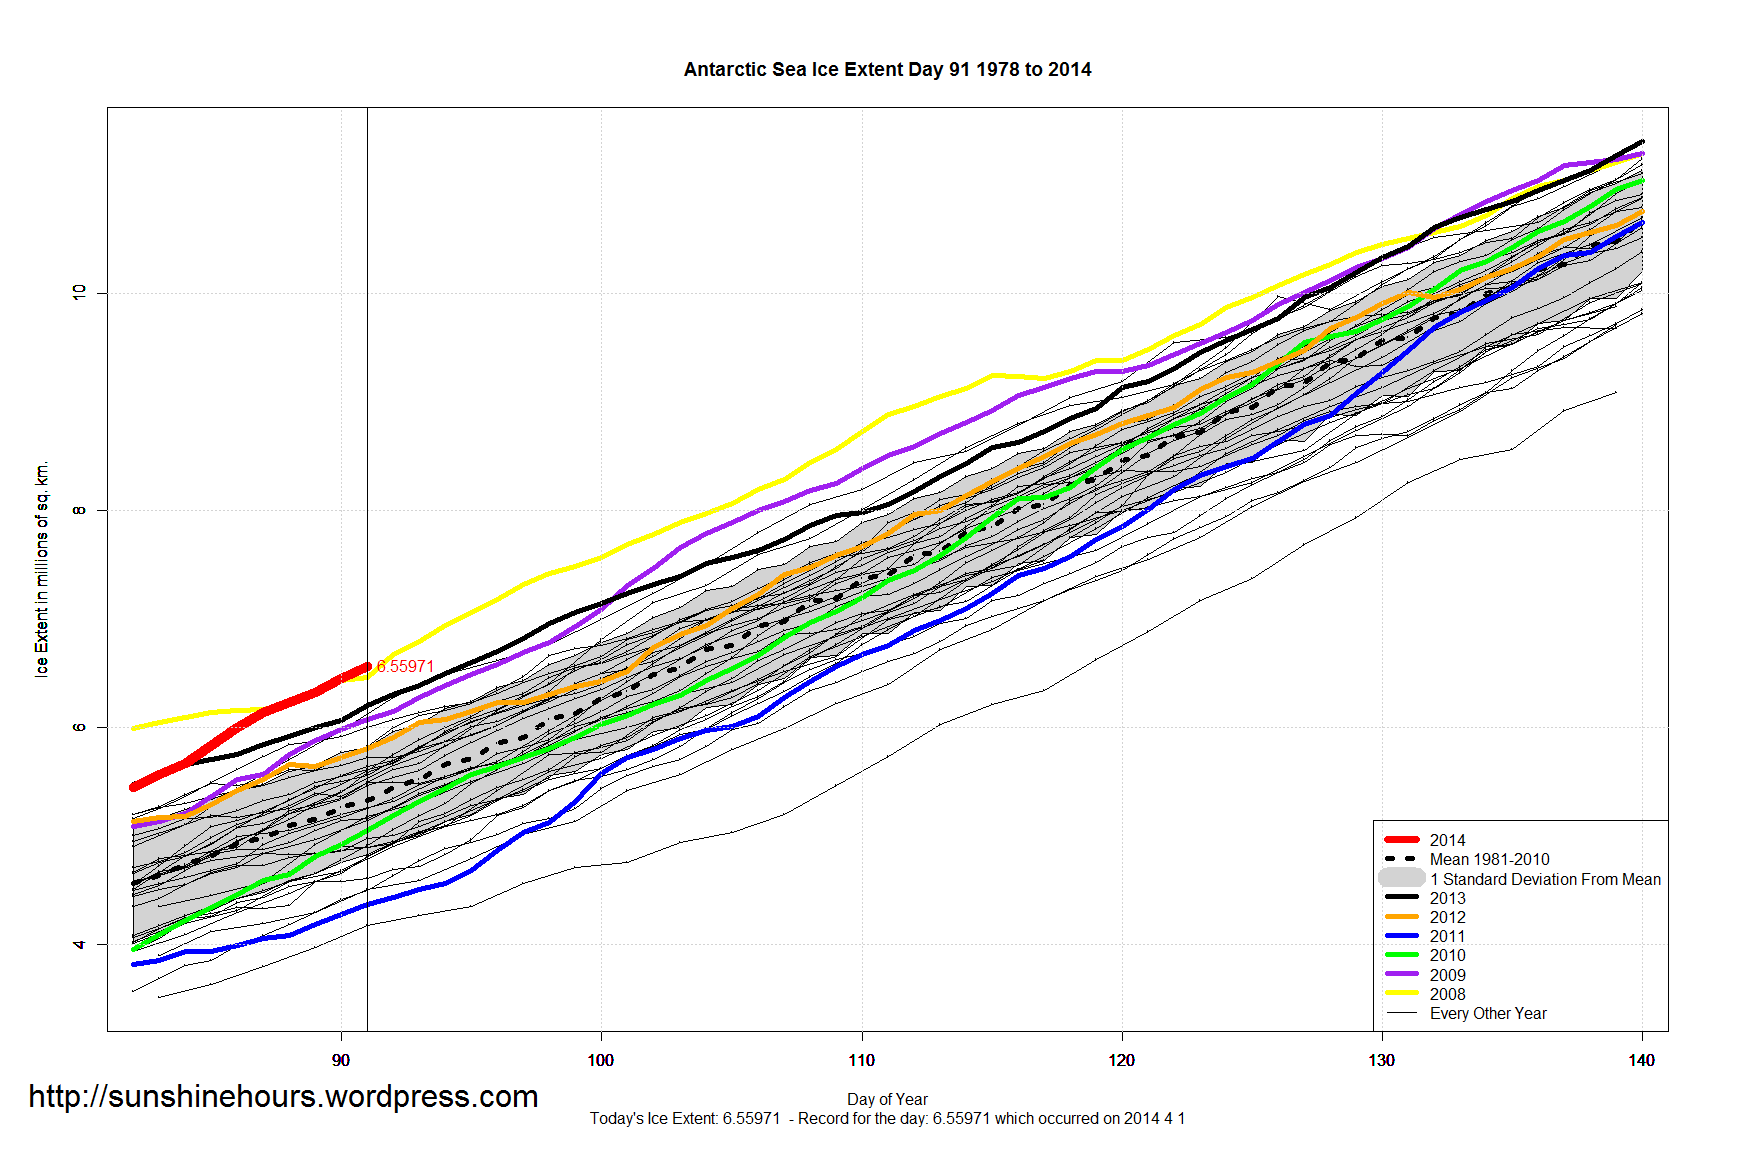
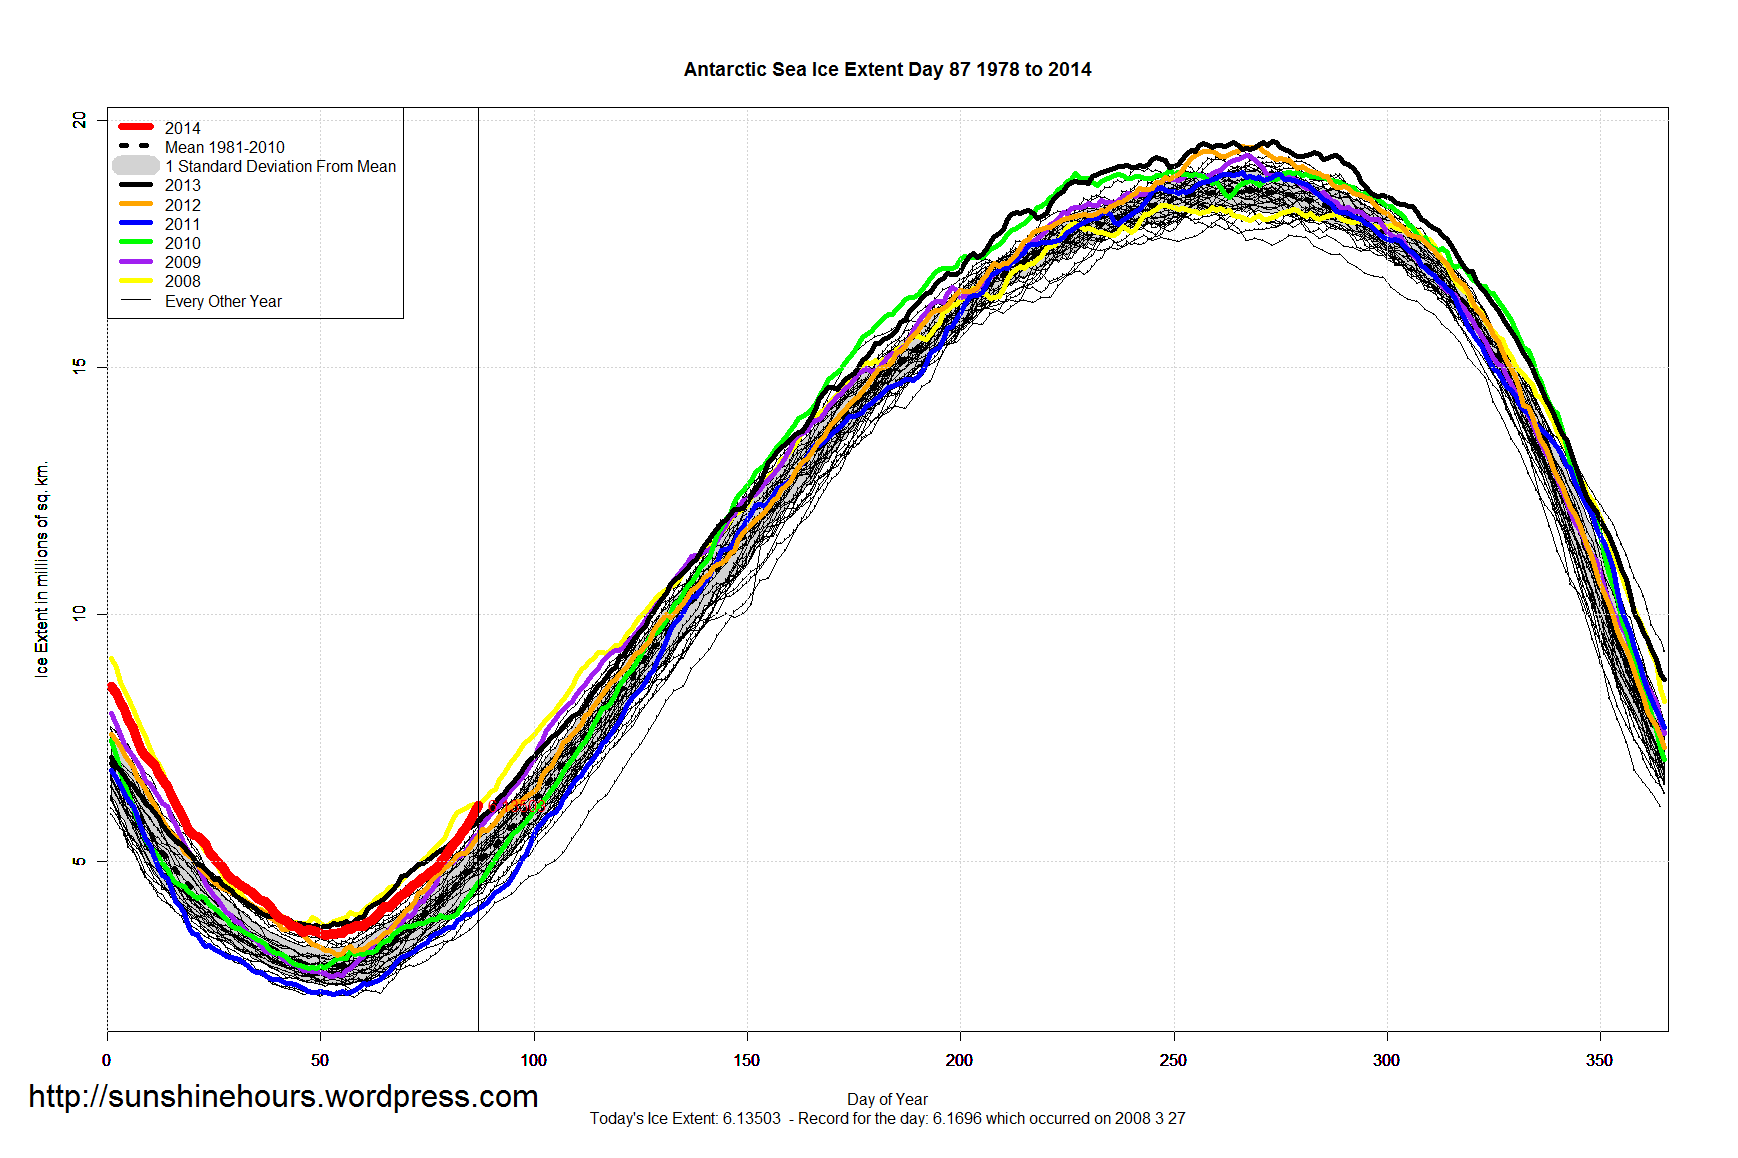
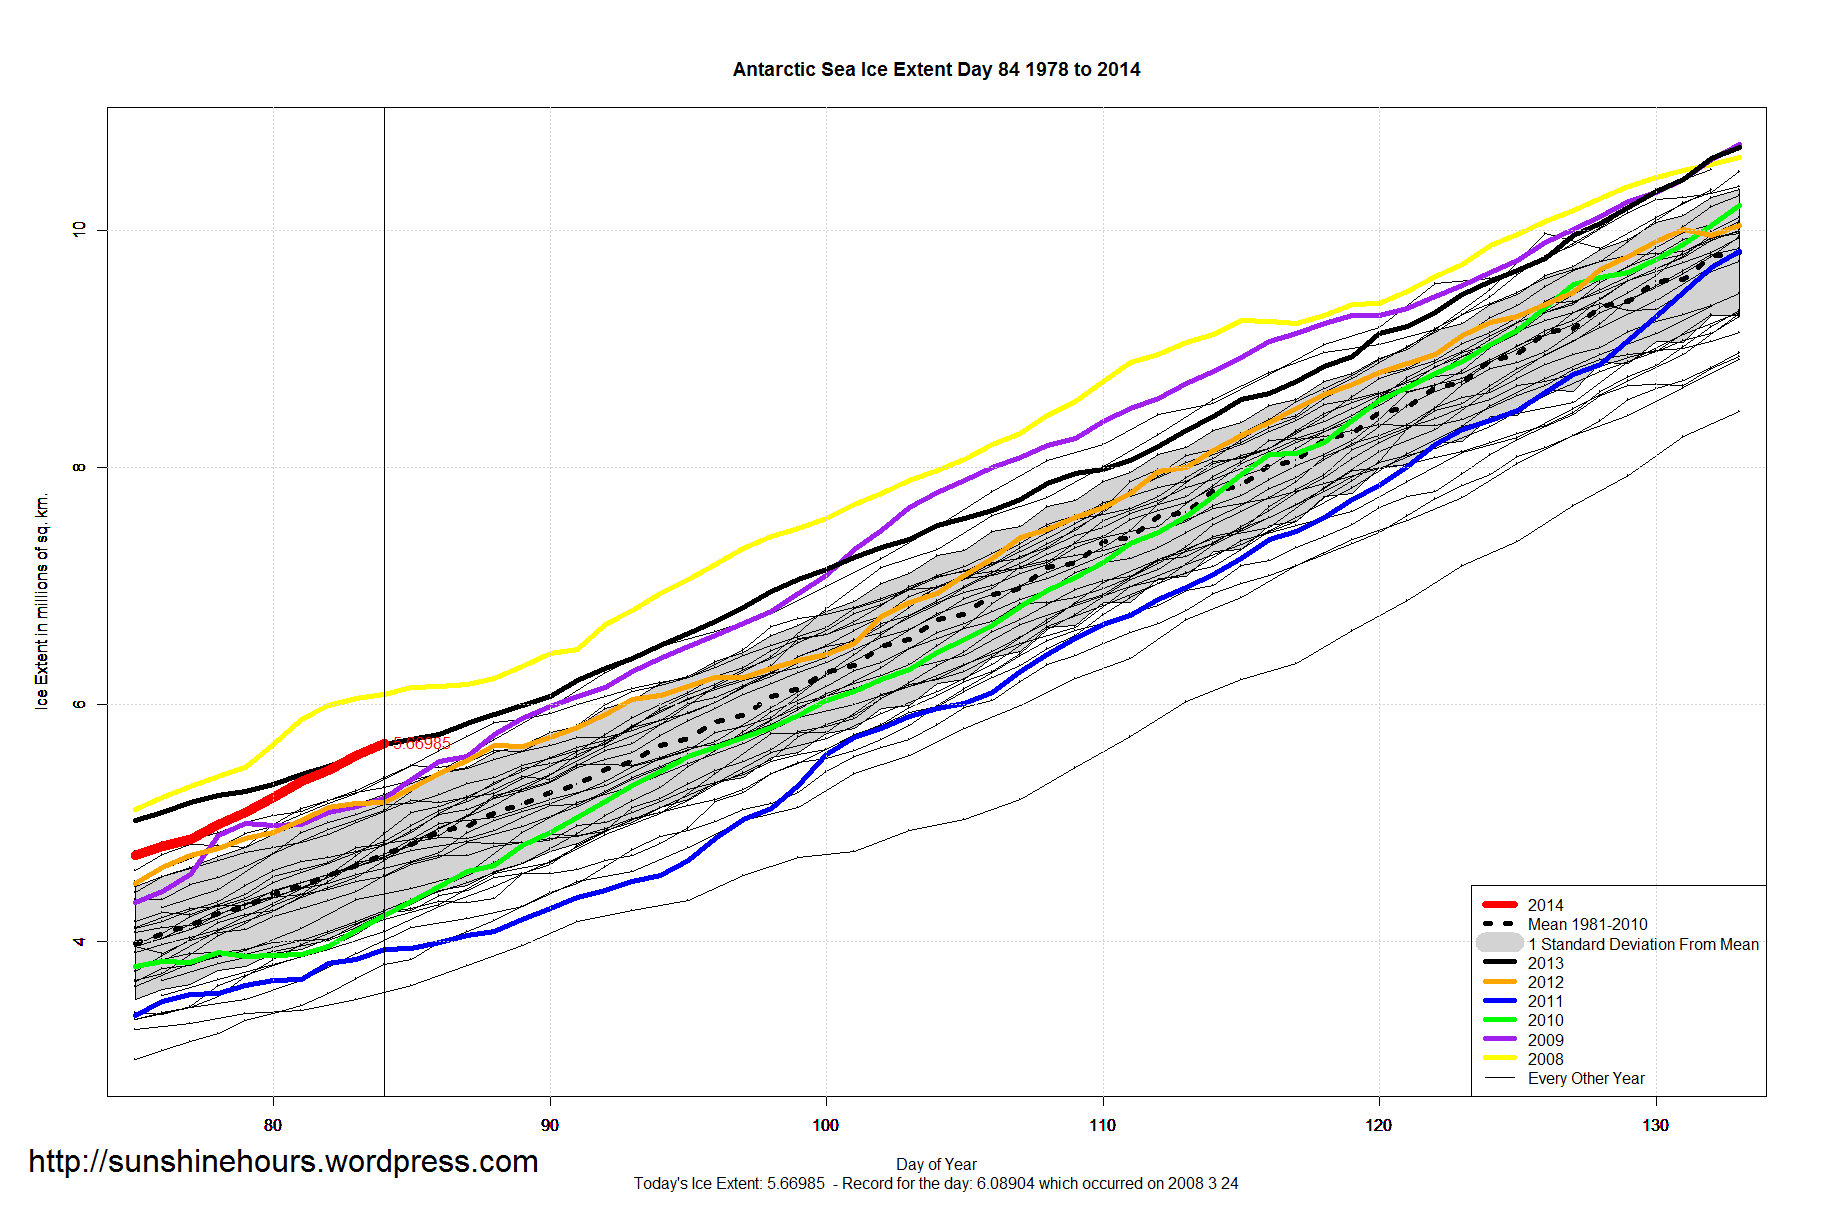
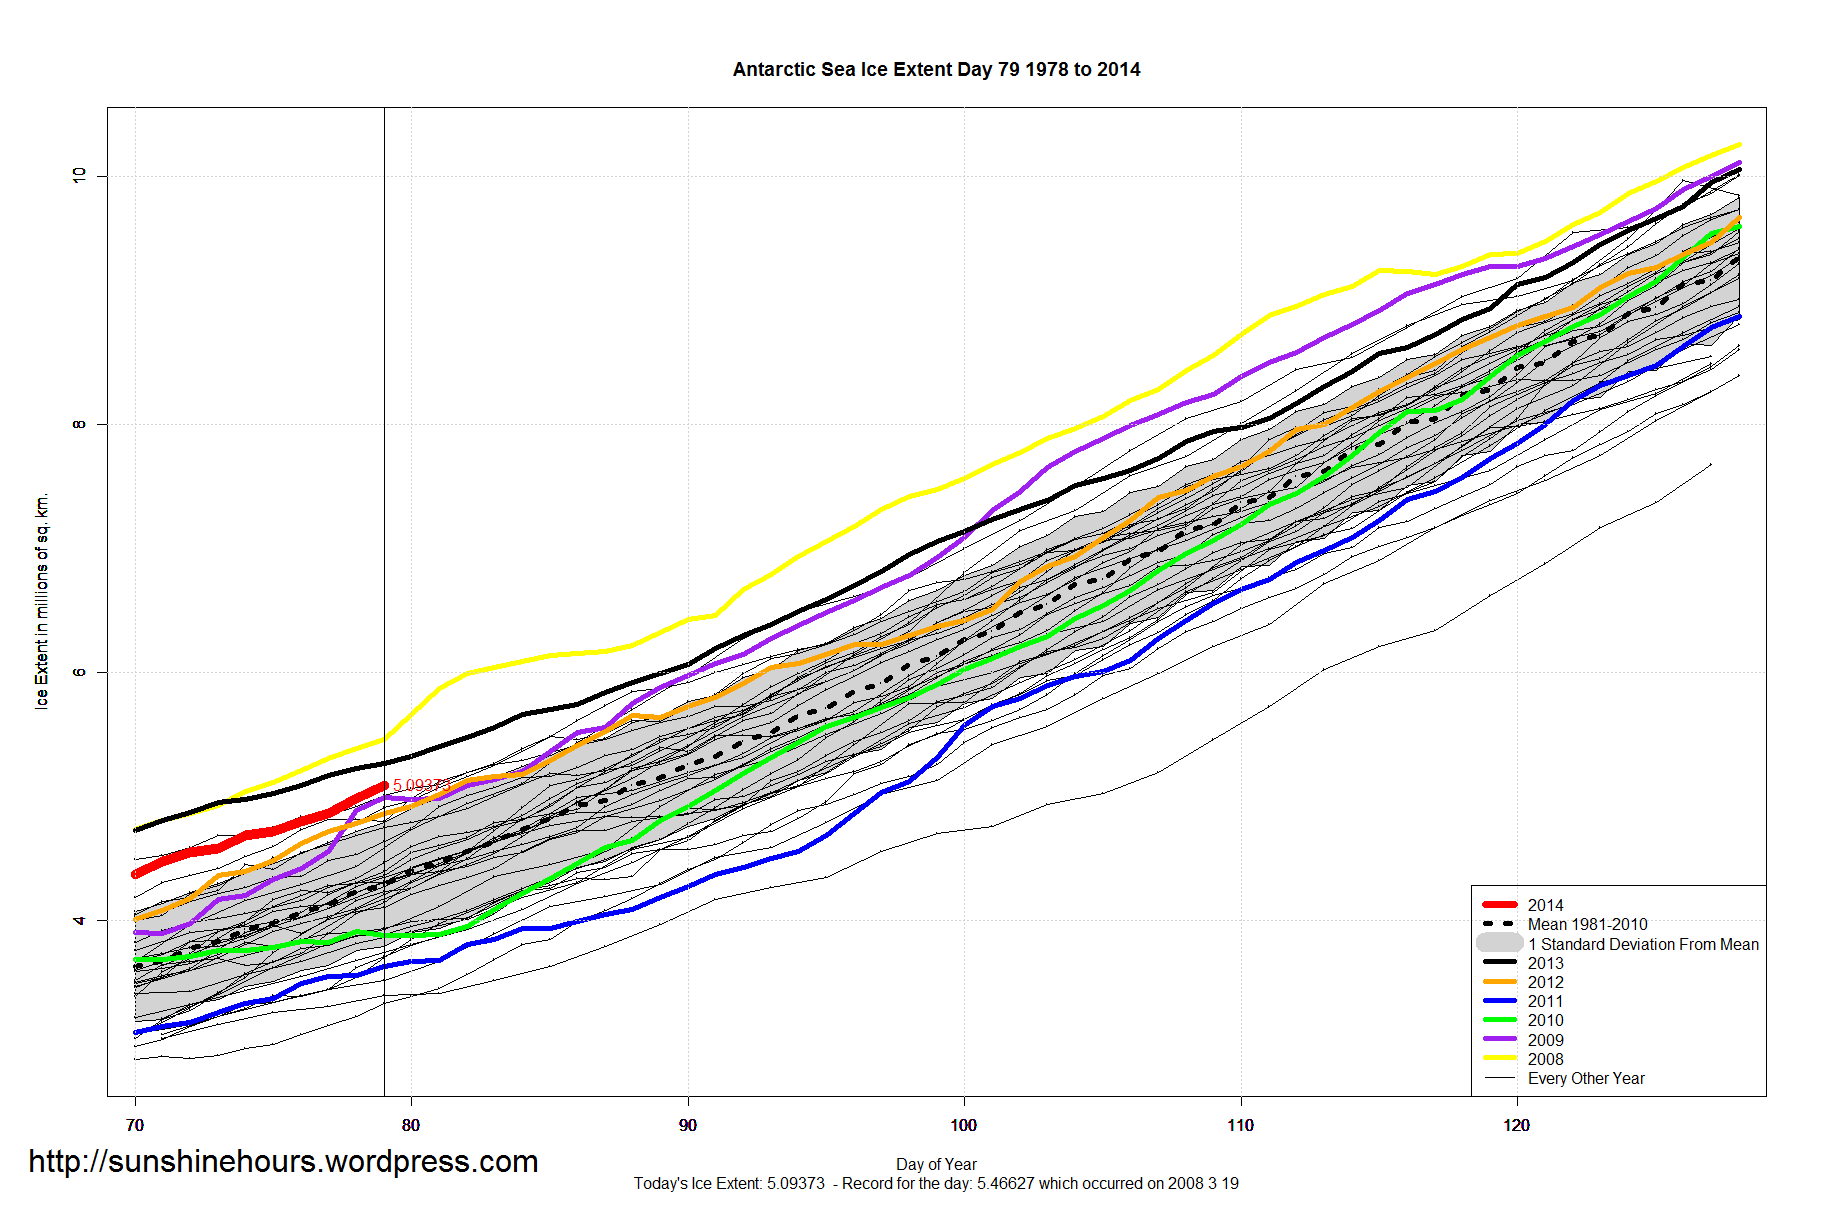
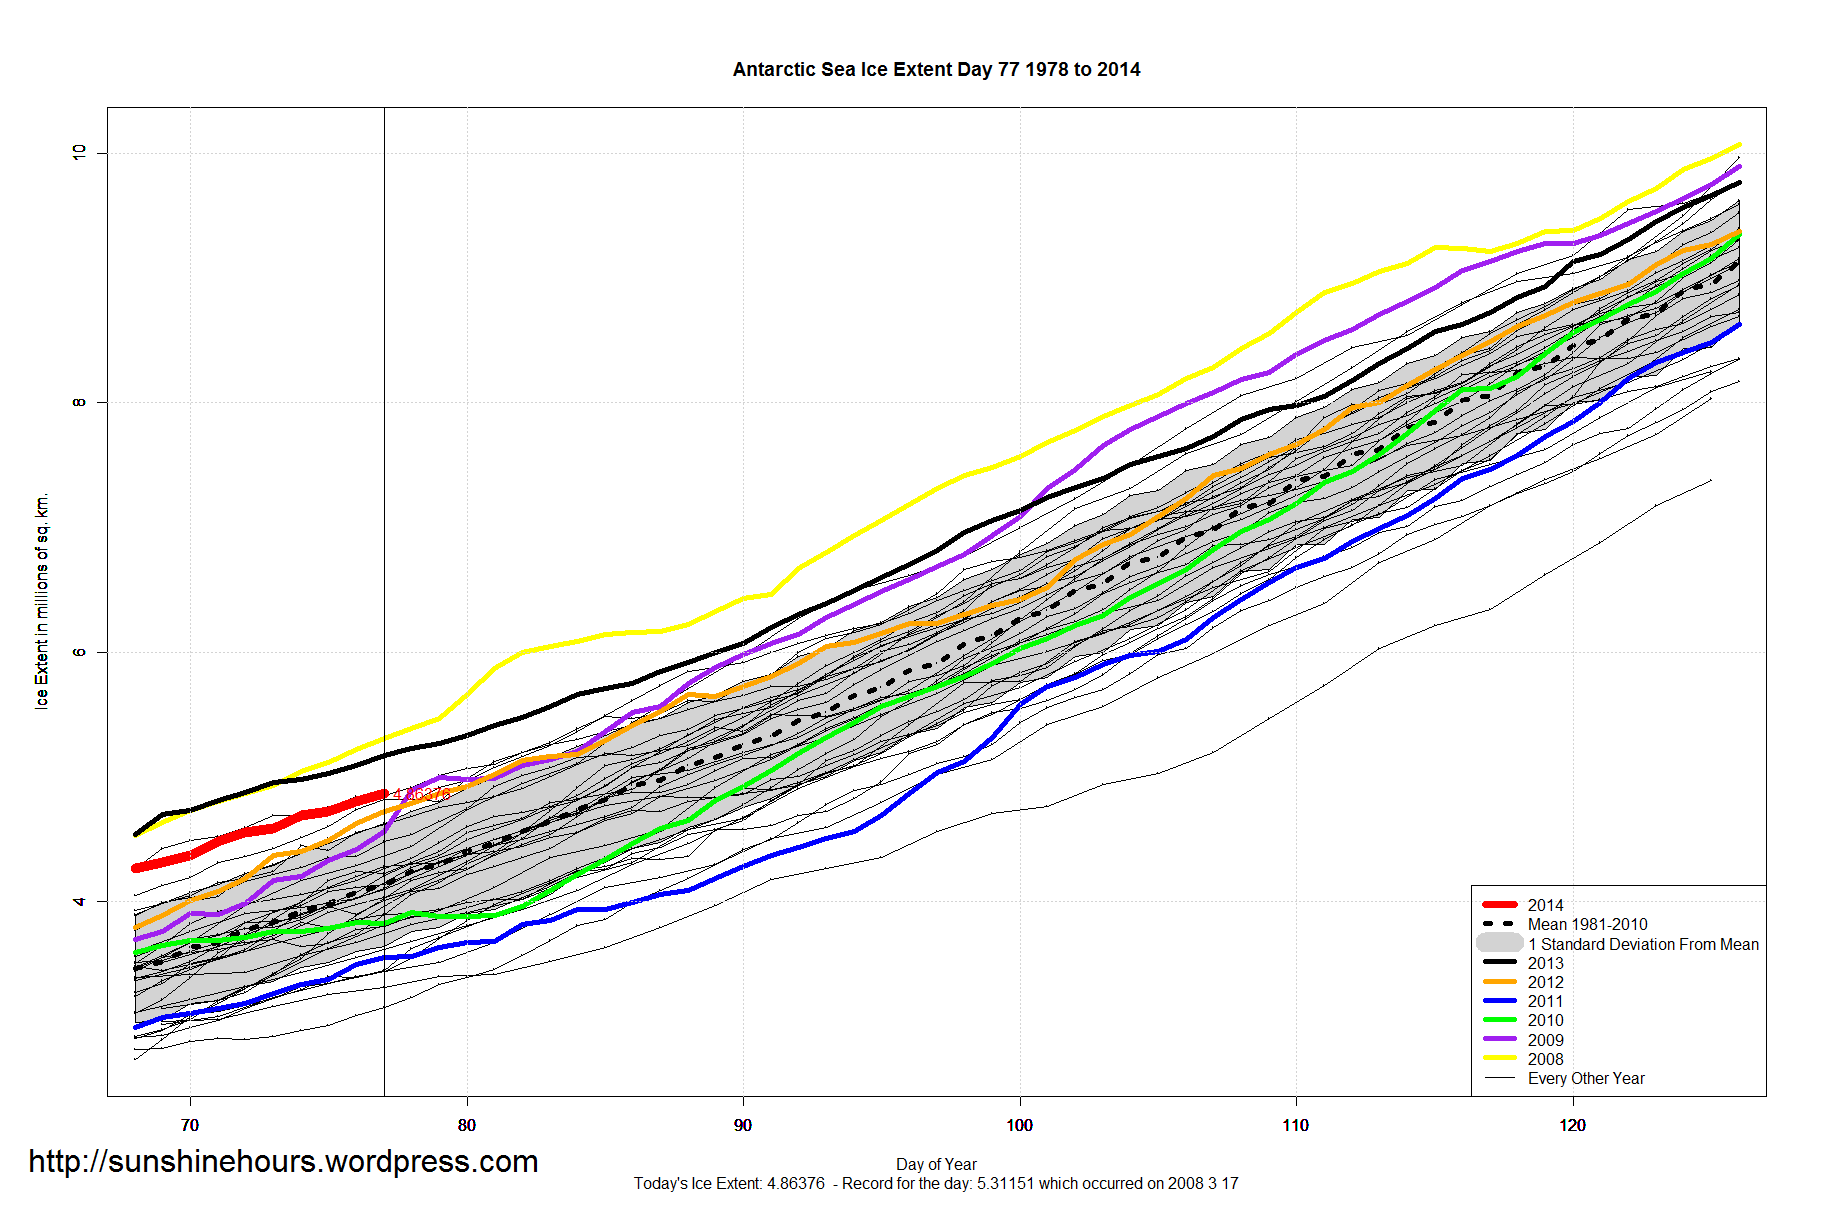
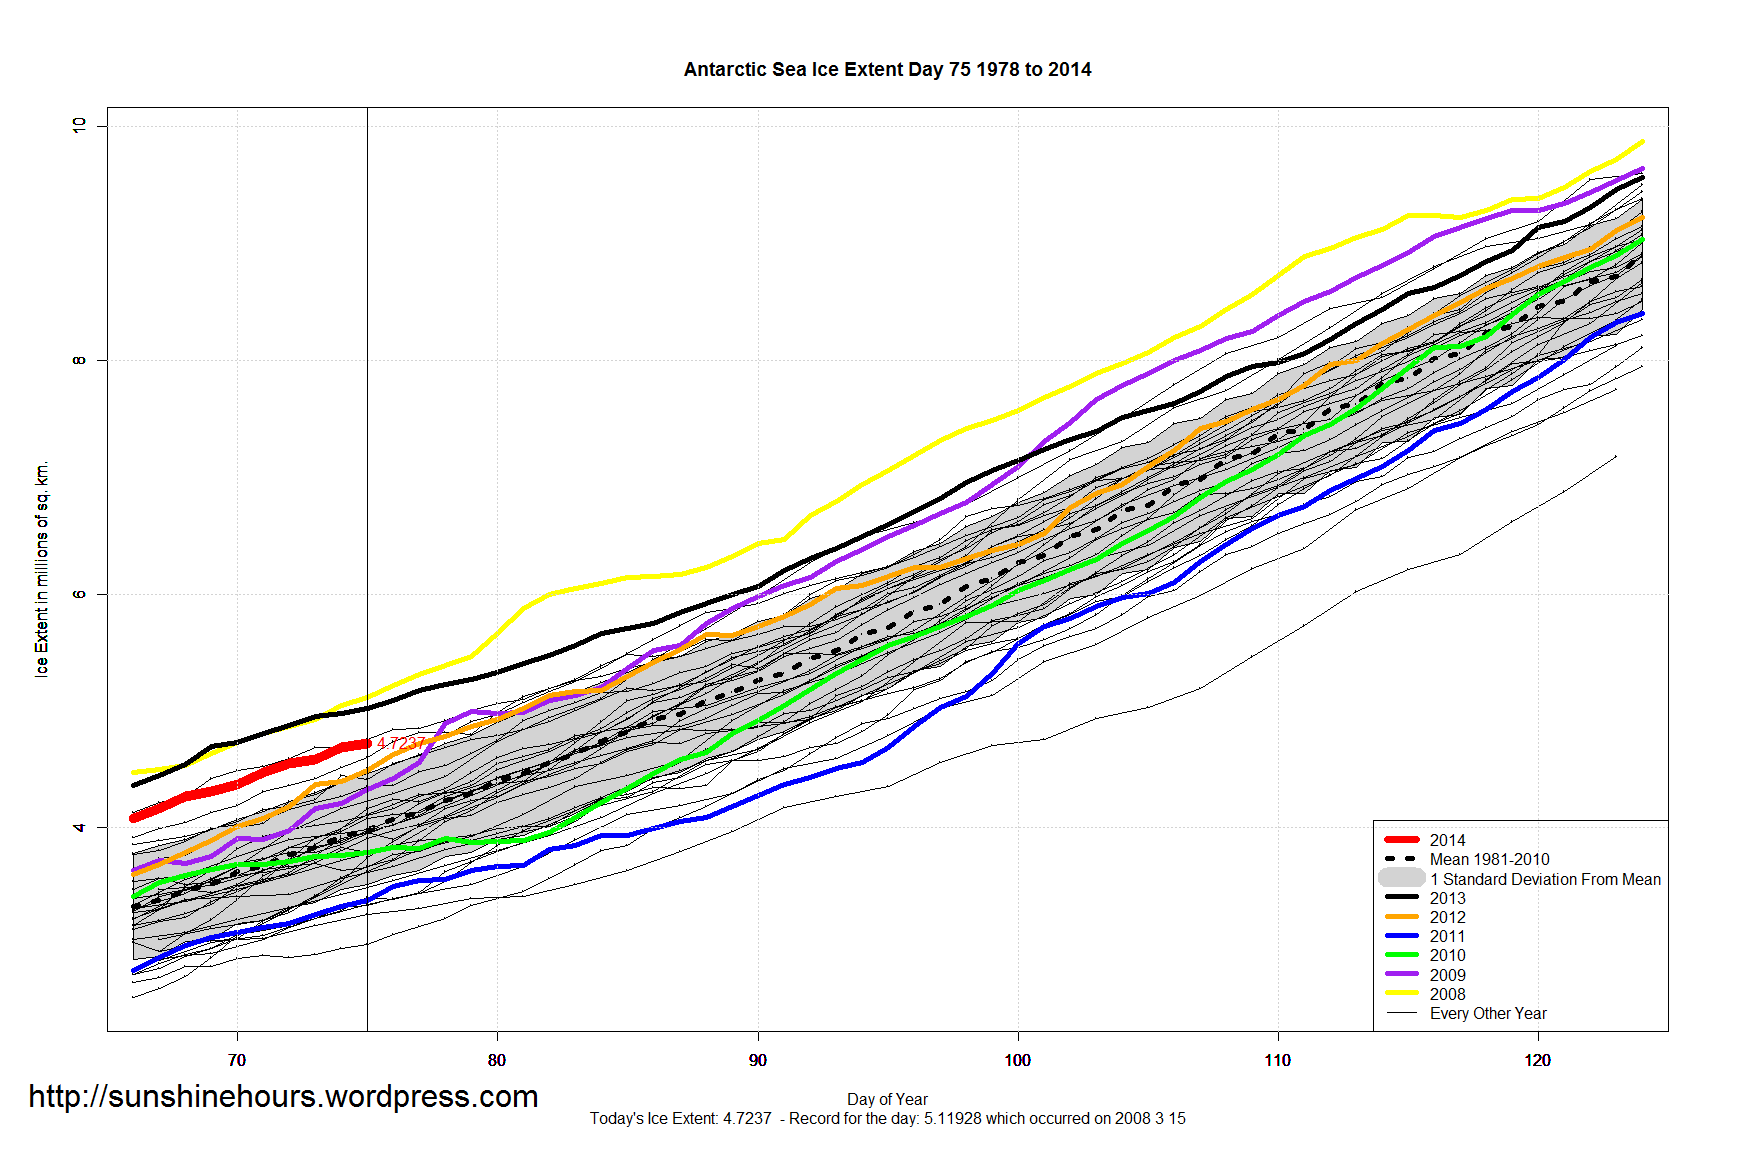
  • Antarctic Sea Ice Extent is 1,403,000 above the 1981-2010 mean. That is ranked 1st for the day. And that is 23.74% above ‘normal’. 30th Daily Record for this year.
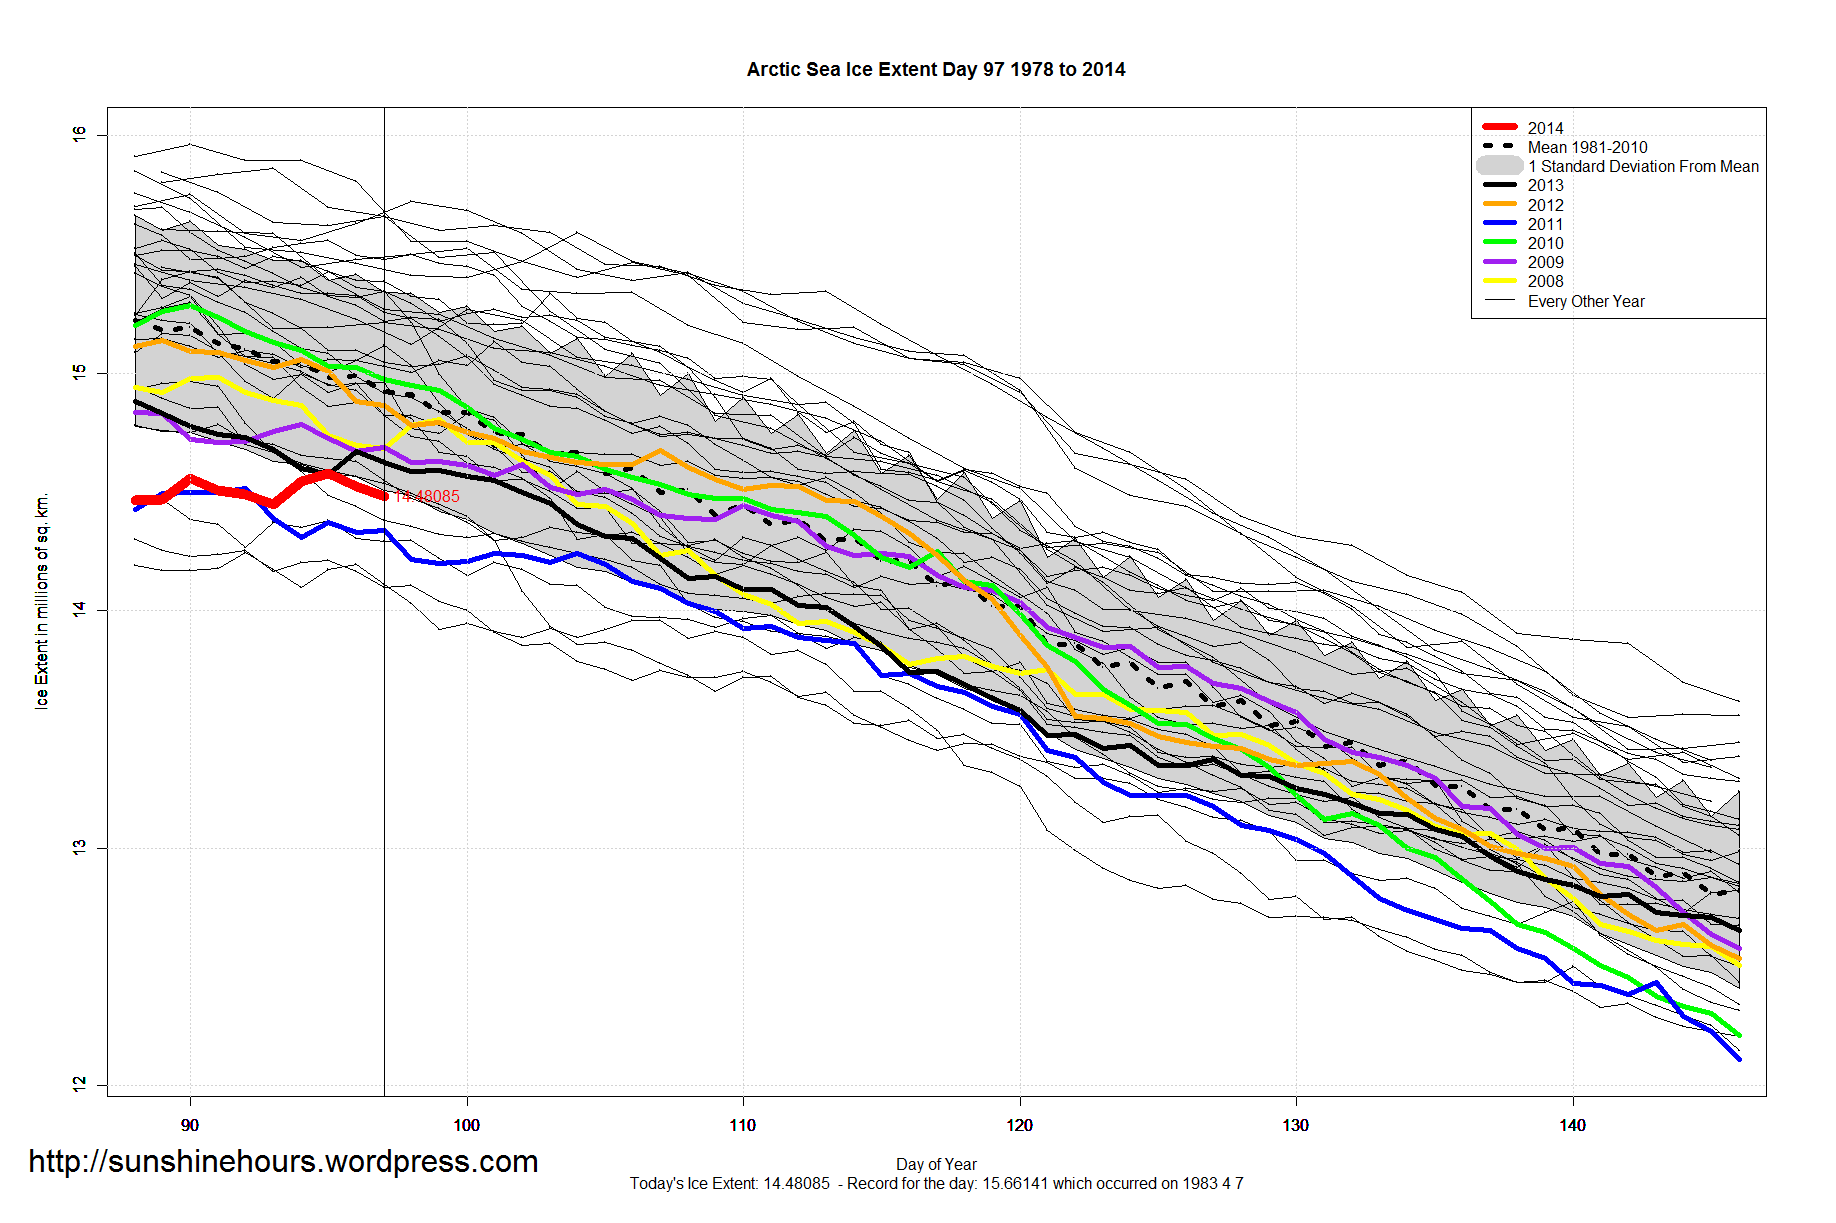
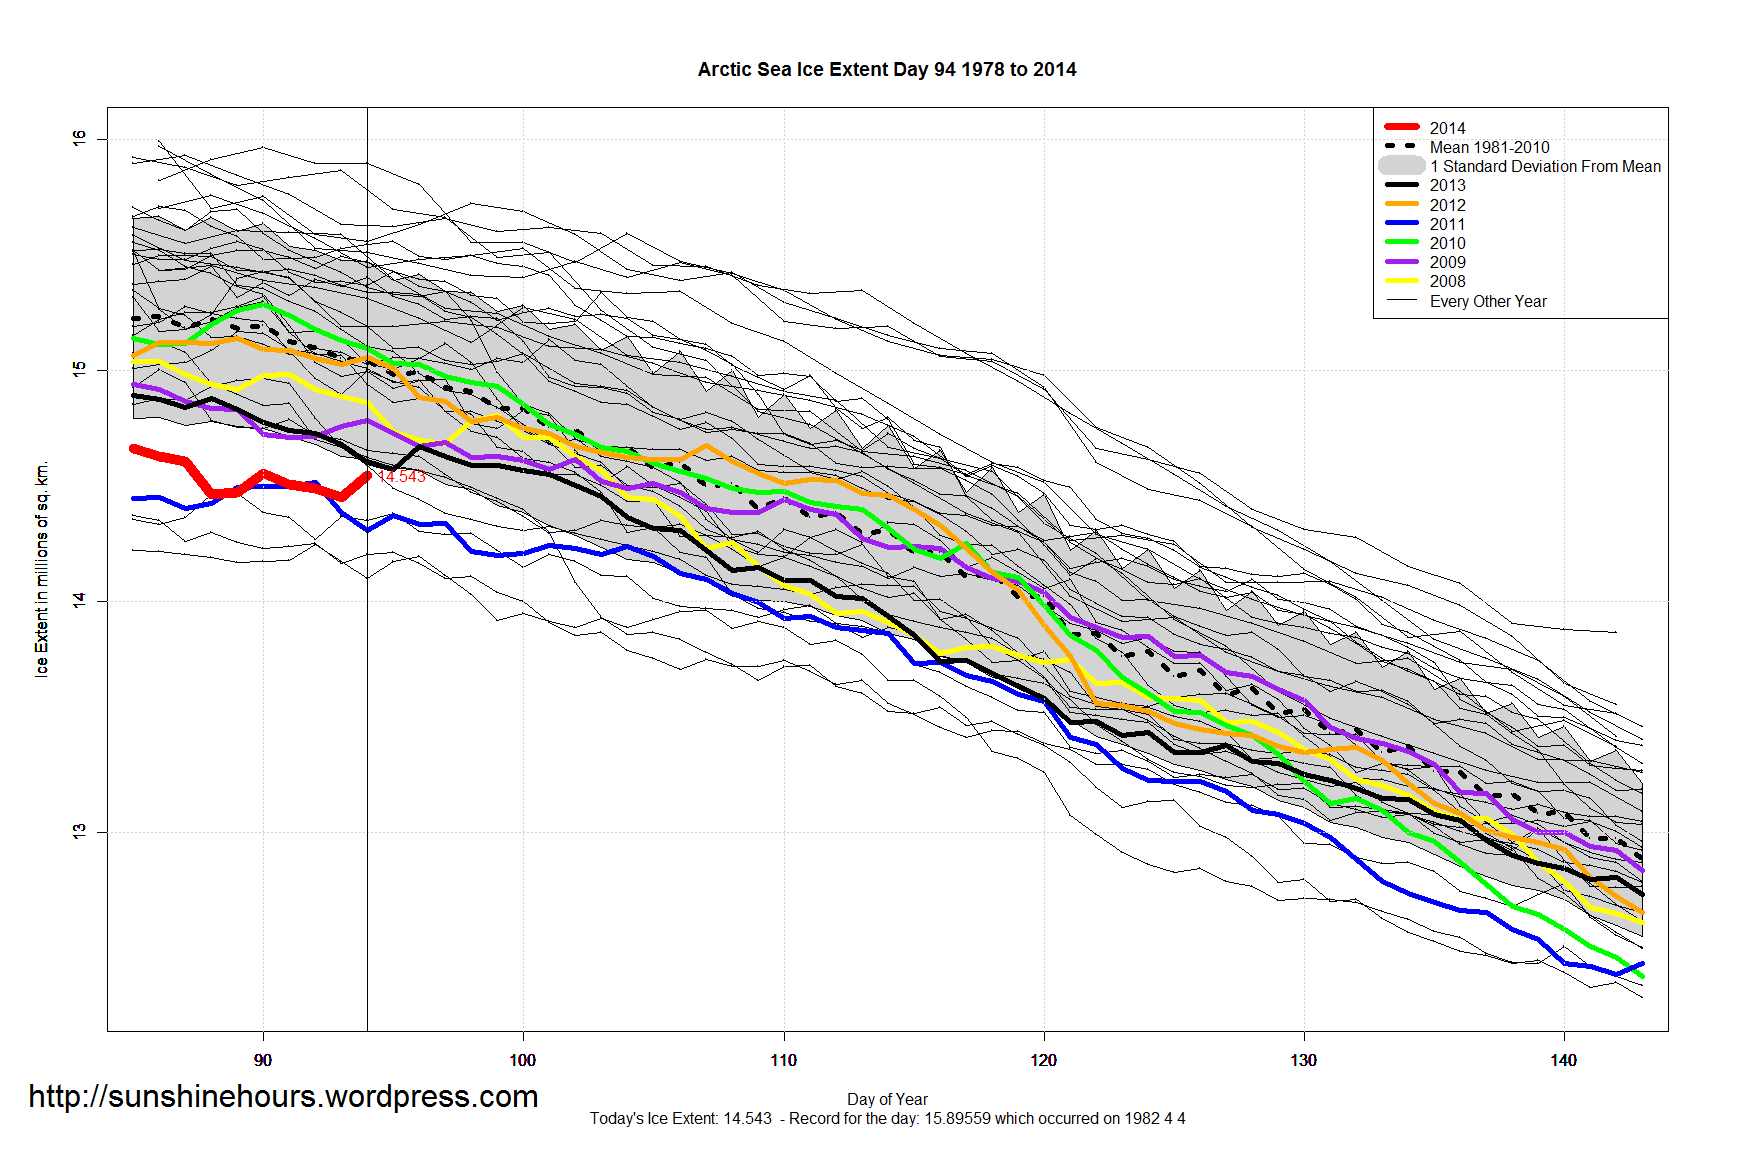
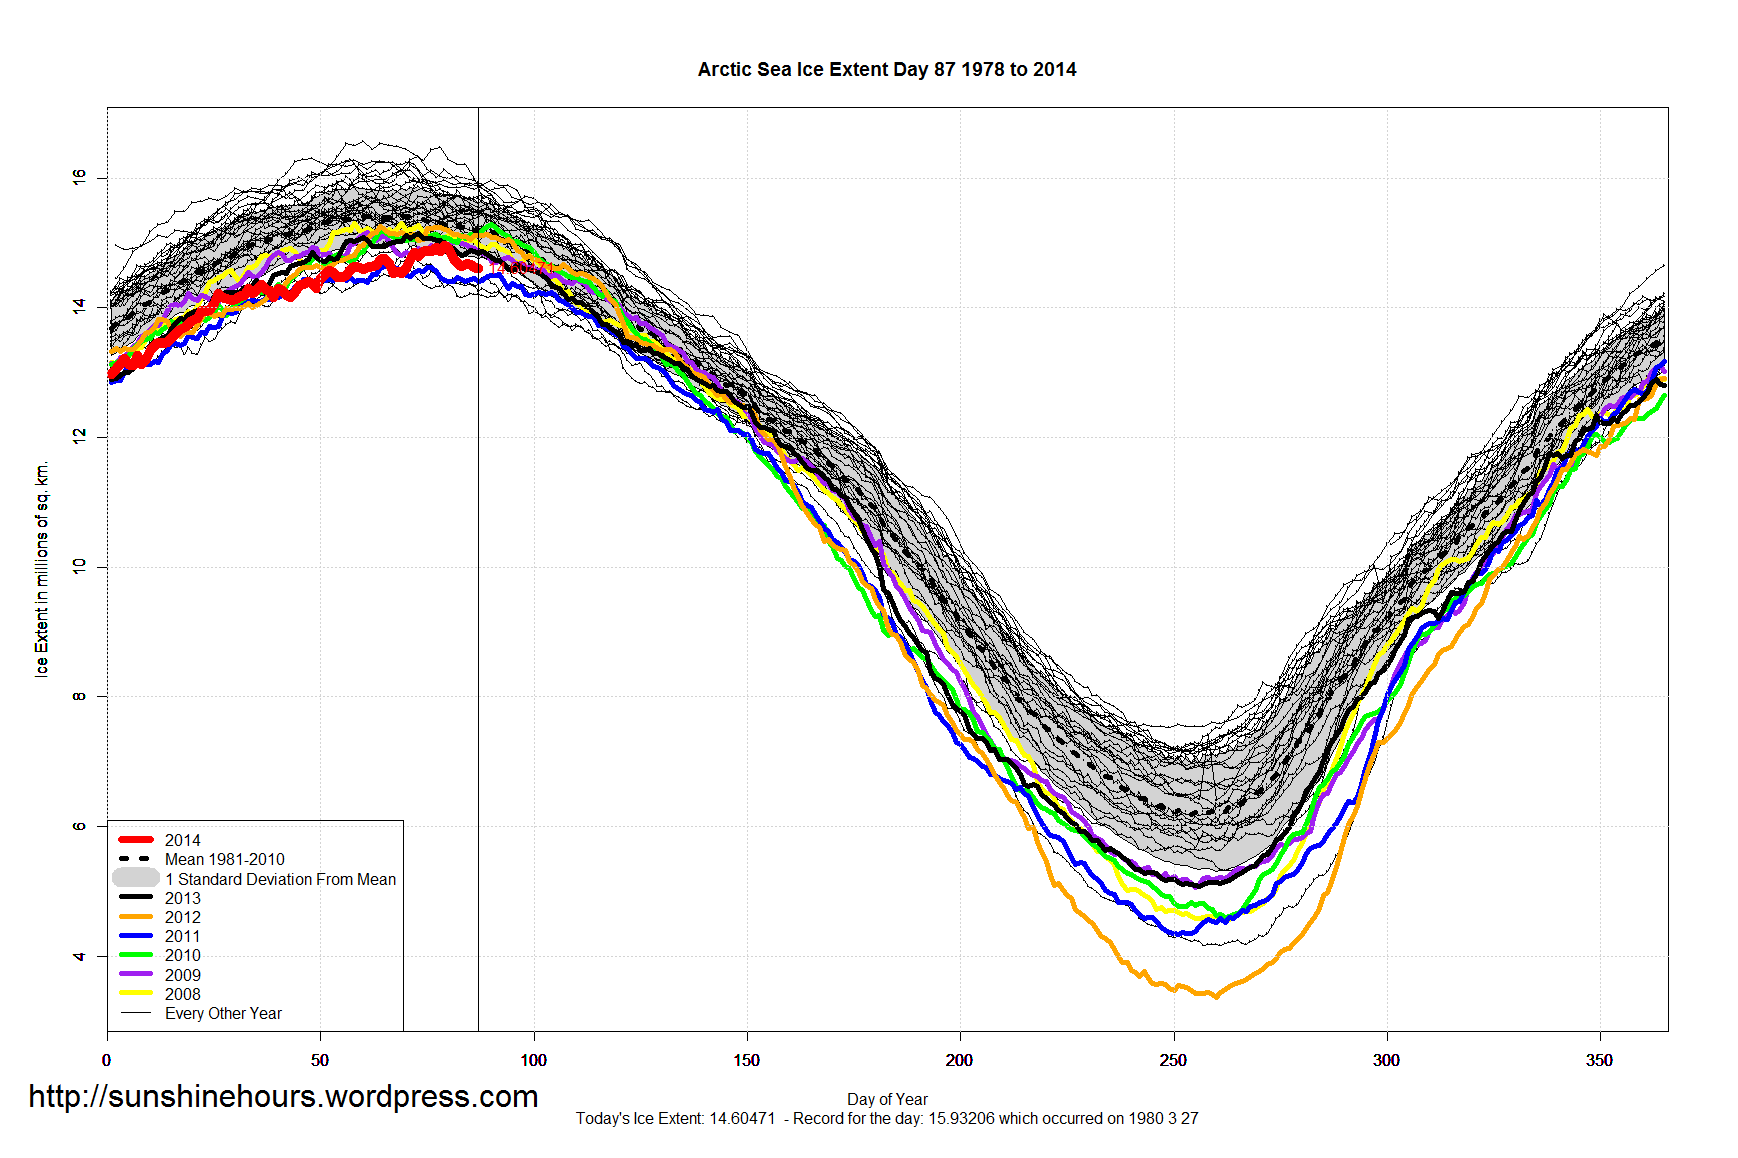
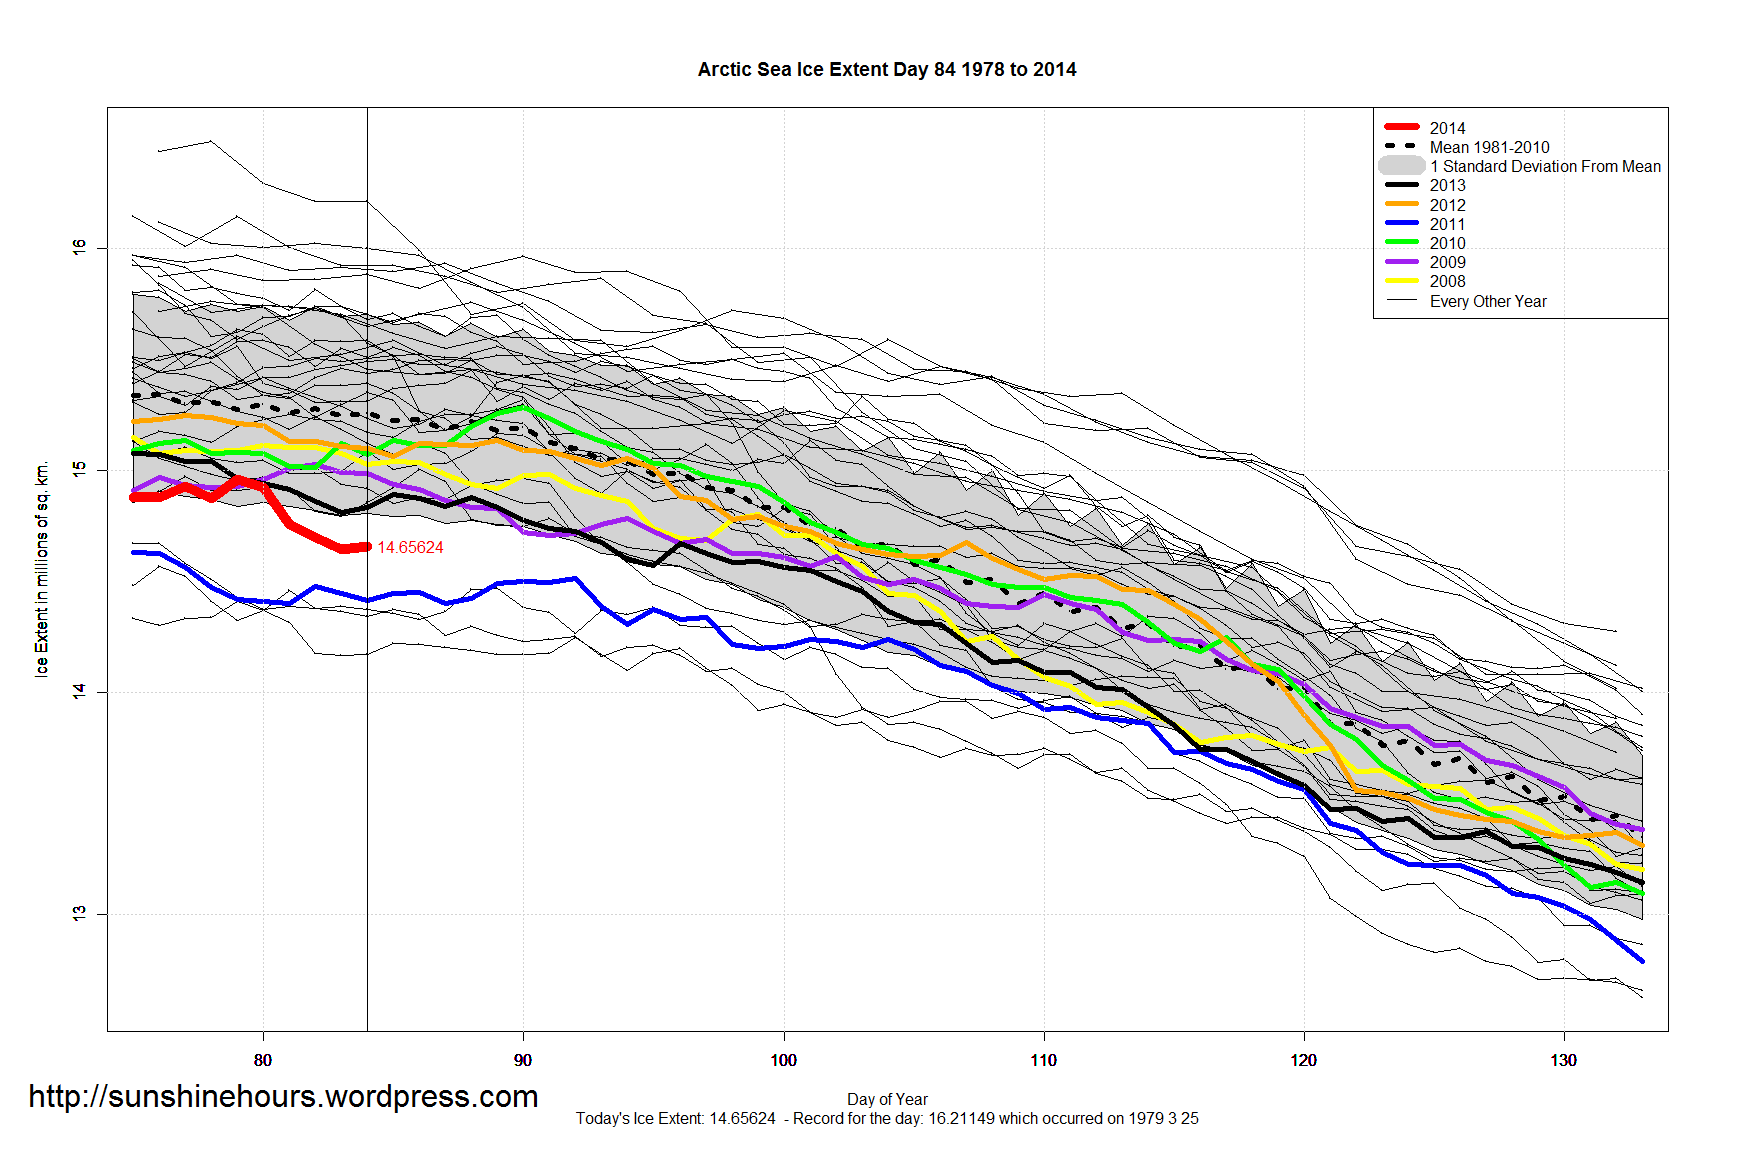
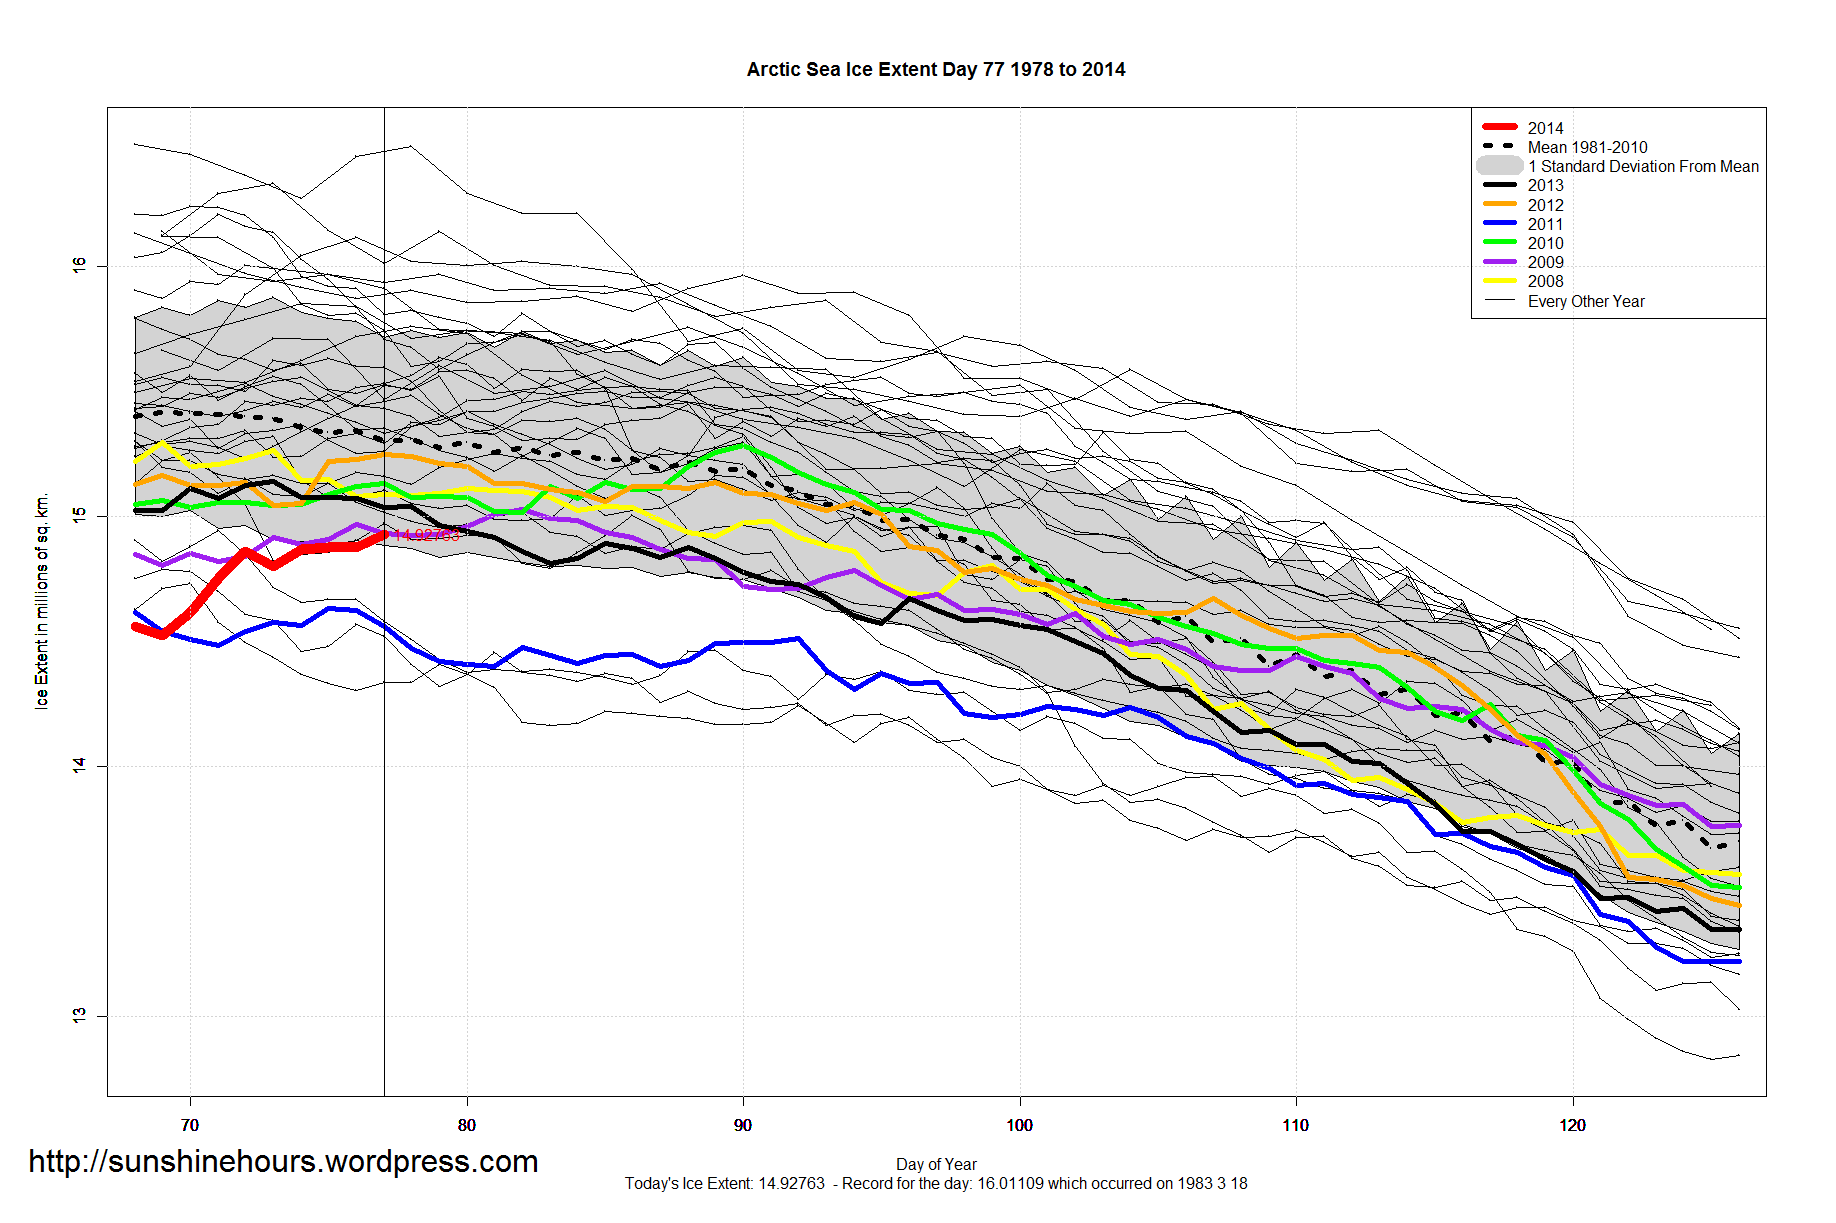
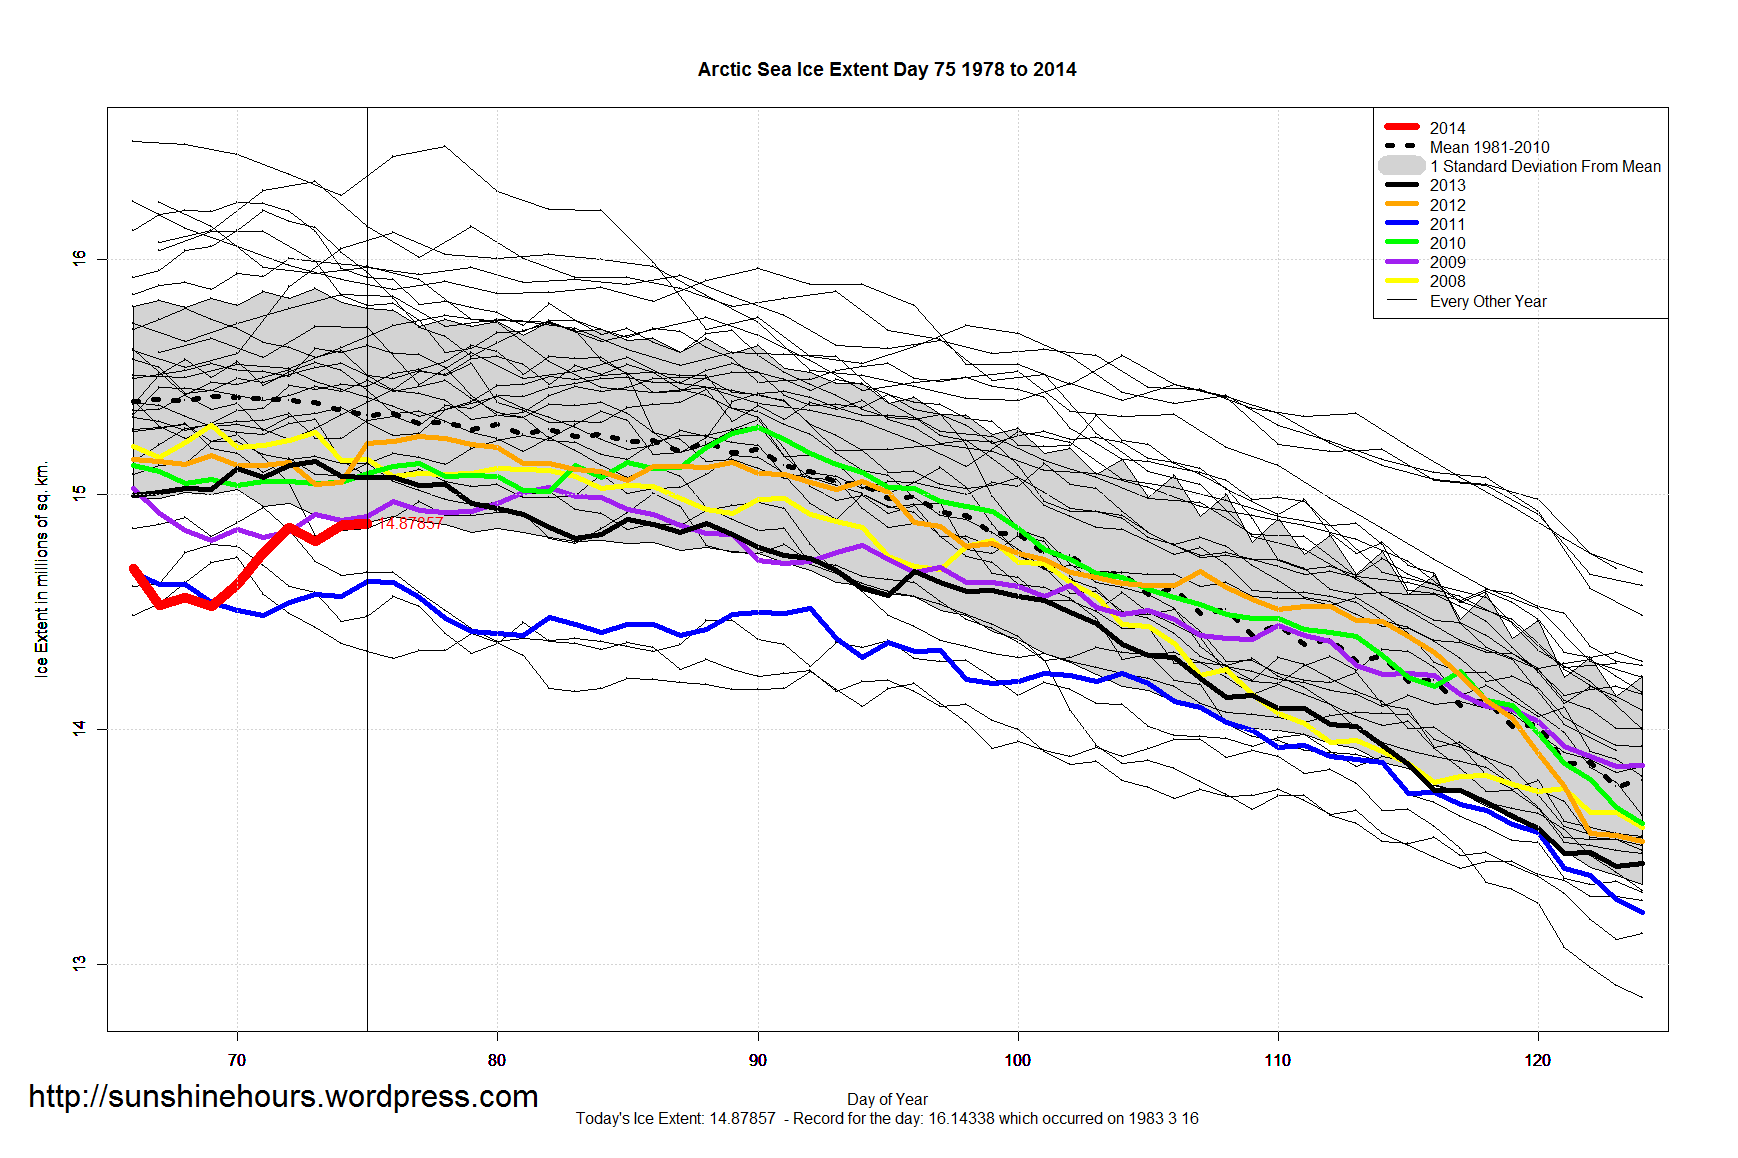
  • Arctic Sea Ice Extent is -444,000 below the 1981-2010 mean. That is -2.97% below ‘normal’.

Data here. Graphs below. Click for bigger.

Global_Sea_Ice_Extent_Zoomed_2014_Day_97_1981-2010 Antarctic_Sea_Ice_Extent_Zoomed_2014_Day_97_1981-2010 Arctic_Sea_Ice_Extent_Zoomed_2014_Day_97_1981-2010


Antarctic Sea Ice Extent Oscillation Pattern

I don’t know what it means, but I’ve been aware of an oscillation pattern in Antarctic Sea Ice Extent for some time. A week or two ago I made a slight change in one of my graphs to annotate the peaks and valleys with the year and now the pattern jumps out at you even more.

This graph is for day 95, but the pattern is similar in other parts of the year.

There has been since 1988 a  4 or 5 year oscillation where the ice extent goes to a valley in between peaks.  And the magnitude of the oscillation is growing.

These are not small oscillations. Sea Ice Extent as of today is 7,000,000 sq km.  The 2011 valley is 4,700,000 sq km. That is a 50% jump in sea ice on day 95 from 2011 to 2014.

I know the AMO has peaked and is poised to start down (it may take a few more years). But to repeat myself, I’m not sure what it means.

Click for larger.


Antarctic Sea Ice Extent for Day 95 From 1980 - Oscilation

Sea Ice Update April 5 2014 – Global Sea Ice 3rd Highest For The Day

A quick update for sea ice extent:

  • Global Sea Ice is 797,000 sq km above the 1981-2010 mean. That is the 3rd highest for the day! And above one standard deviation.
  • Antarctic Sea Ice is  1,298,000 sq km above the 1981-2010 mean.Highest for this day.
  • Arctic Sea Ice is 500,000 sq km below the 1981-2010 mean.  That is only 70,000 sq km outside the one standard deviation mark.

Data here. Graphs below. Click for bigger.


Global_Sea_Ice_Extent_Zoomed_2014_Day_94_1981-2010 Antarctic_Sea_Ice_Extent_Zoomed_2014_Day_94_1981-2010 Arctic_Sea_Ice_Extent_Zoomed_2014_Day_94_1981-2010

Sea Ice Update April 2 2014 – Antarctica Sets Another Record and Global Sea Ice Is 616,000 sq km Above Normal

A quick update for sea ice extent:

  • Global Sea Ice is 616,000 sq km above the 1981-2010 mean. That is 5th highest for the day.
  • Antarctic Sea Ice is  1,240,000 sq km above the 1981-2010 mean. That is highest for this day. 25th daily record for 2014.
  • Arctic Sea Ice is 620,000 sq km below the 1981-2010 mean.

Data here. Graphs below. Click for bigger.


Global_Sea_Ice_Extent_Zoomed_2014_Day_91_1981-2010 Antarctic_Sea_Ice_Extent_Zoomed_2014_Day_91_1981-2010 Arctic_Sea_Ice_Extent_Zoomed_2014_Day_91_1981-2010

Sea Ice Update March 29 2014 – Global Sea Ice Is 582,000 sq km Above Normal

A quick update for sea ice extent:

  • Global Sea Ice is 582,000 sq km above the 1981-2010 mean.
  • Antarctic Sea Ice is  1,162,000 sq km above the 1981-2010 mean. 2nd highest for this day and only 35,000 sq km short of the daily record. And still climbing fast enough to break the daily record in 1 or 2 days.
  • Arctic Sea Ice is 581,000 sq km below the 1981-2010 mean.

Data here. Graphs below. Click for bigger.

Global_Sea_Ice_Extent_2014_Day_87_1981-2010 Antarctic_Sea_Ice_Extent_2014_Day_87_1981-2010 Arctic_Sea_Ice_Extent_2014_Day_87_1981-2010

Comparing Sea Ice Extent Day of Minimum/Maximum From 1979-2013

I have made 3 graphs for Antarctic/Global/Arctic Sea Ice Extent comparing the Day when the maximum ice occurred to the day the minimum ice occurred.

I am using anomalies from the 1979-2013 mean. 2014 is left out because it hasn’t finished yet.

Red is day of maximum and blue is day of minimum.

The items that stood out for me are:

Arctic 1999 and 2010 day of maximum which are 21 and 22 days above the mean. That is 10 more days later the other latest maximums.

Antarctic Day of Minimum has barely changed since 1999. Only a slight fluctuation up and down by 2 days or so.

Comparing Antarctic Day of Min Max Comparing Global Day of Min Max Comparing Arctic Day of Min Max


Sea Ice Update March 26 2014 – Antarctic Sea Ice Is 930,000 sq km Above Normal

A quick update for sea ice extent:

  • Global Sea Ice is 330,000 sq km above the 1981-2010 mean.
  • Antarctic Sea Ice is  931,000 sq km above the 1981-2010 mean. For two days in a row Antarctic Sea Ice has been 2nd highest for the that day.
  • Arctic Sea Ice is only 600,000 sq km below the 1981-2010 mean.  And Arctic Sea Ice Extent probably reached its maximum for 2014 on March 20. That would be the 5th lowest in the satellite era.

Data here. Graphs below. Click for bigger.


Global_Sea_Ice_Extent_Zoomed_2014_Day_84_1981-2010

Antarctic_Sea_Ice_Extent_Zoomed_2014_Day_84_1981-2010

Arctic_Sea_Ice_Extent_Zoomed_2014_Day_84_1981-2010


Sea Ice Update March 21 2014 – Global Sea Ice Is 430,000 sq km Above Normal

A quick update for sea ice extent:

  • Global Sea Ice is 430,000 sq km above the 1981-2010 mean.
  • Antarctic Sea Ice is  800,000 sq km above the 1981-2010 mean. 3rd highest for this day.
  • Arctic Sea Ice is only 317,000 sq km below the 1981-2010 mean.  That is 130,000 sq km inside the one standard deviation mark.

Data here. Graphs below. Click for bigger.

Global_Sea_Ice_Extent_Zoomed_2014_Day_79_1981-2010

Antarctic_Sea_Ice_Extent_Zoomed_2014_Day_79_1981-2010

Arctic_Sea_Ice_Extent_Zoomed_2014_Day_79_1981-2010

Sea Ice Update March 19 2014 – Arctic Sea Ice Within One Standard Deviation of the Mean

A quick update for sea ice extent:

  • Global Sea Ice is 357,000 sq km above the 1981-2010 mean.
  • Antarctic Sea Ice is  730,000 sq km above the 1981-2010 mean. For 2014, that is 77 days out of 77 in the Top 5. Day 77 was 3rd highest for that day.
  • Arctic Sea Ice is only 373,000 sq km below the 1981-2010 mean.  That is 43,000 sq km inside the one standard deviation mark.

Data here. Graphs below. Click for bigger.

Global_Sea_Ice_Extent_Zoomed_2014_Day_77_1981-2010 Antarctic_Sea_Ice_Extent_Zoomed_2014_Day_77_1981-2010 Arctic_Sea_Ice_Extent_Zoomed_2014_Day_77_1981-2010

Sea Ice Update March 17 2014 – Global Sea Ice Is 280,000 sq km Above the Mean

After two days with no data from NSIDC , a quick update for sea ice extent:

  • Global Sea Ice is 280,000 sq km above the 1981-2010 mean.
  • Antarctic Sea Ice is  730,000 sq km above the 1981-2010 mean.
  • Arctic Sea Ice is only 460,000 sq km below the 1981-2010 mean.  That is the smallest anomaly of 2014. It is also only 4800 sq km below the one standard deviation mark.

Data here. Graphs below. Click for bigger.

Global_Sea_Ice_Extent_Zoomed_2014_Day_75_1981-2010 Antarctic_Sea_Ice_Extent_Zoomed_2014_Day_75_1981-2010 Arctic_Sea_Ice_Extent_Zoomed_2014_Day_75_1981-2010