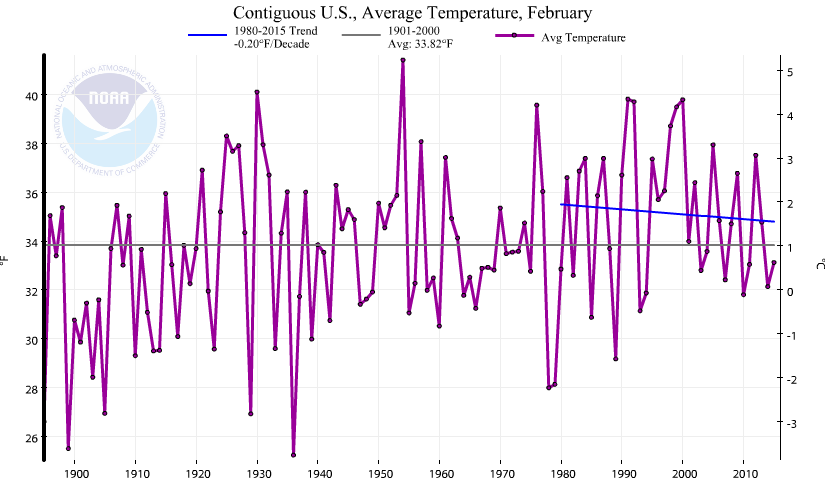
February’s in the USA have been cooling for over 30 years.
February 2015 was ranked 53 out of 121 (121 being warmest).
February’s in the USA have been cooling for over 30 years.
February 2015 was ranked 53 out of 121 (121 being warmest).
Oooops: I initially used C/Decade. It is F/Decade.And I have to check the Trend.
Update: The trend is correct once I corrected the units.
Update: Here is a link to NOAA for California. Ohio is doing the opposite since 1998.
January 2015 Tmax Ordered By State Rank
Only 6 States in the top 10. Only 9 in the top 20. 27 out of 48 have a rank of less than 61 (the middle of 121).
And note that 15 states January’s are cooling since 1895 .
And 38 states January’s are cooling since 1998.
| State | Rank (1 = Hottest) | Trend Since 1895 in F/Decade | Trend Since 1998 in F/Decade |
| Oregon | 1 | 0.45 | 1.86 |
| California | 3 | 0.36 | 2.66 |
| Nevada | 4 | 0.29 | 0.79 |
| Utah | 8 | 0.31 | -1.6 |
| Wyoming | 8 | 0.38 | -0.15 |
| Idaho | 9 | 0.26 | 0.33 |
| Washington | 11 | 0.38 | 0.28 |
| Arizona | 19 | 0.34 | -0.63 |
| Colorado | 19 | 0.23 | -0.96 |
| Montana | 22 | 0.44 | 0.83 |
| North Dakota | 23 | 0.45 | 0.85 |
| South Dakota | 25 | 0.3 | -0.61 |
| Minnesota | 27 | 0.24 | -1.38 |
| Kansas | 28 | 0.2 | 0.06 |
| Nebraska | 29 | 0.2 | -1.02 |
| Iowa | 31 | 0.01 | -1.3 |
| Missouri | 44 | -0.03 | -0.62 |
| Oklahoma | 49 | 0.11 | 0.05 |
| Florida | 51 | 0.05 | -0.54 |
| New Mexico | 56 | 0.23 | -1.67 |
| Wisconsin | 60 | 0.12 | -2.32 |
| Arkansas | 68 | -0.11 | -1.43 |
| Illinois | 68 | -0.06 | -1.8 |
| North Carolina | 68 | -0.06 | -1.75 |
| Georgia | 71 | -0.01 | -1.63 |
| South Carolina | 71 | -0.04 | -1.48 |
| Virginia | 71 | -0.02 | -2.29 |
| Alabama | 73 | -0.17 | -1.65 |
| Mississippi | 73 | -0.19 | -1.64 |
| Delaware | 75 | 0.07 | -2.16 |
| Indiana | 78 | -0.13 | -2.57 |
| Kentucky | 78 | -0.15 | -2.67 |
| Maine | 78 | 0.13 | 0.3 |
| Maryland | 79 | 0.06 | -2.46 |
| New Jersey | 79 | 0.17 | -2.12 |
| Tennessee | 79 | -0.18 | -2.24 |
| Louisiana | 80 | -0.12 | -2.02 |
| Michigan | 81 | 0.13 | -1.92 |
| West Virginia | 82 | -0.16 | -2.84 |
| New Hampshire | 85 | 0.08 | -0.63 |
| New York | 85 | 0.06 | -1.18 |
| Vermont | 86 | 0.04 | -0.66 |
| Connecticut | 87 | 0.1 | -1.24 |
| Ohio | 88 | -0.09 | -2.85 |
| Massachusetts | 89 | 0.11 | -1 |
| Pennsylvania | 89 | 0.04 | -2.6 |
| Texas | 90 | 0.05 | -2.3 |
| Rhode Island | 92 | 0.13 | -1.14 |
A rank of 121 in Oregon indicates the warmest (since NOAA records started in 1895). This data is Maximum temperature average for the month..
On the other hand, a rank of 30 indicates 91 January’s were warmer.
es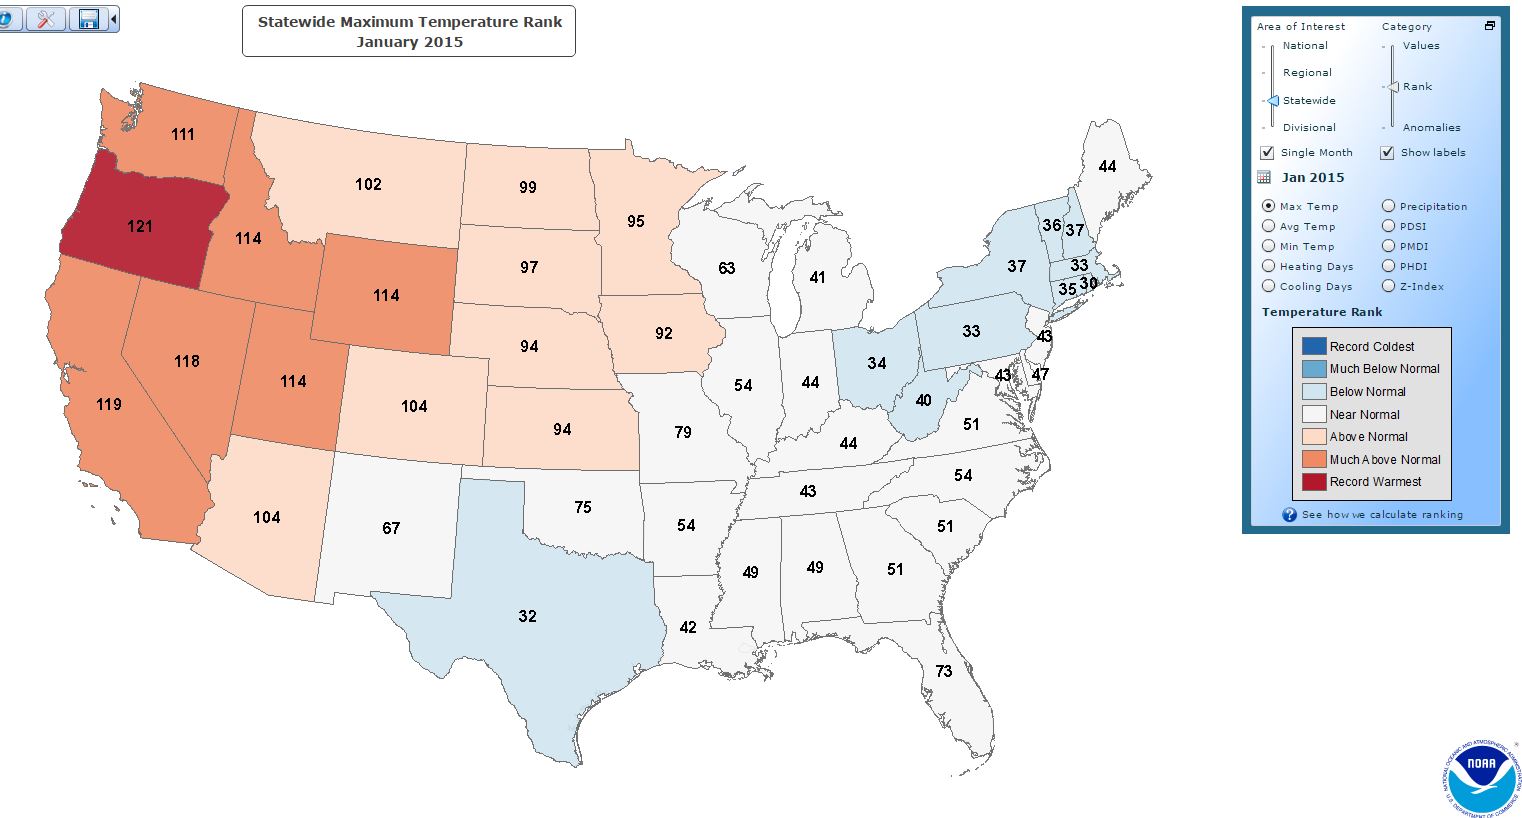
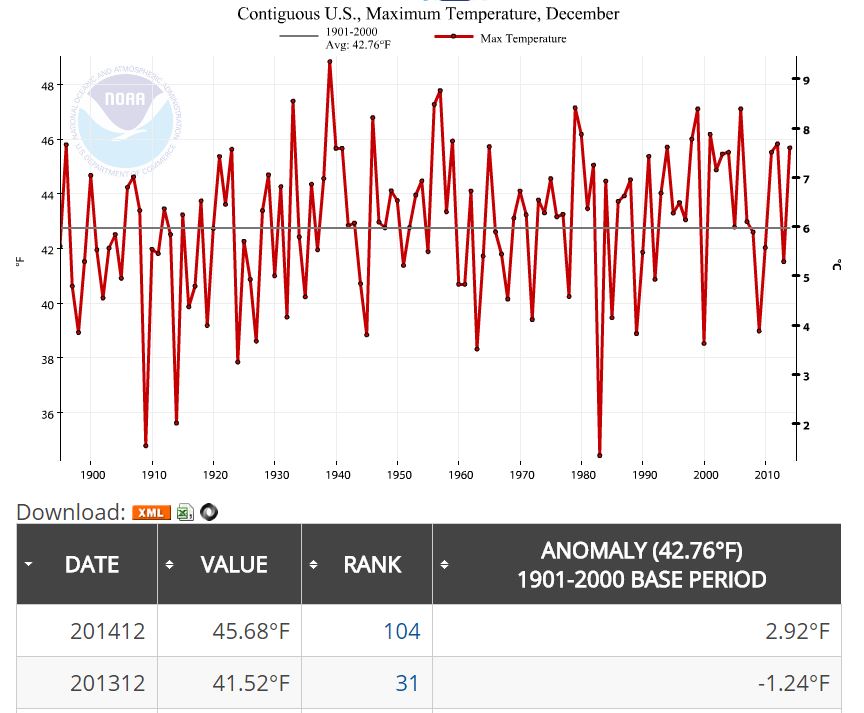
Using Tmax, 2014 was 2.41F Colder Than December 1934 and 3.34F colder than December 2012.

Using Tmax, December 2014 was 3.15F Colder Than December 1939.
Even December 1896 was warmer than December 2014. Warm Decembers are pretty spread out over the last 120 years.
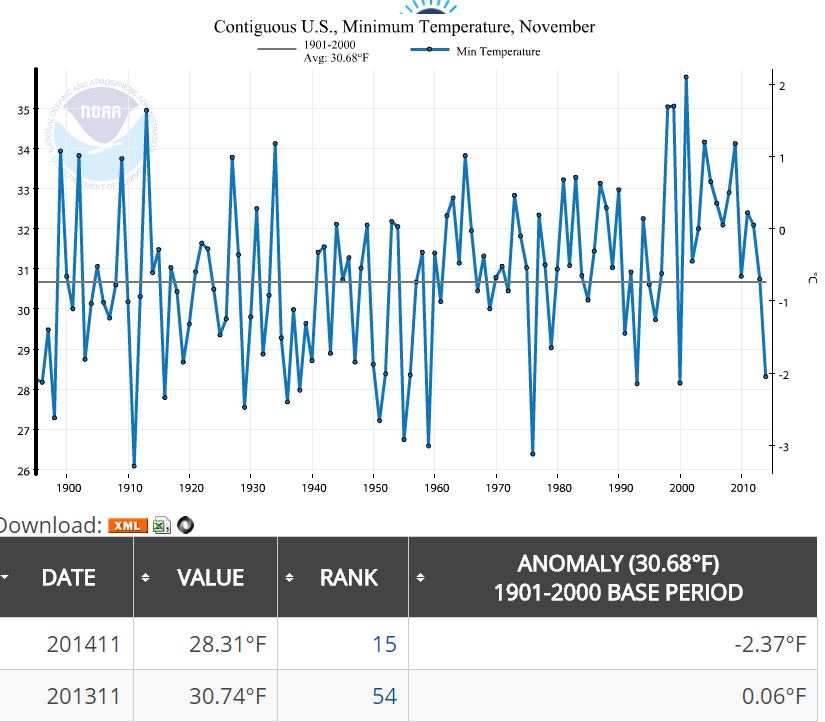
How cold was the USA in November? The map below look at the Average Temperature rank out of 120. 120 would be warmest.
1 would be coldest. There are a lot of 2’s and 3’s in the blue section.
Imagine the sh*tstorm of publicity if the rank’s had been 118 and 119?
![]()
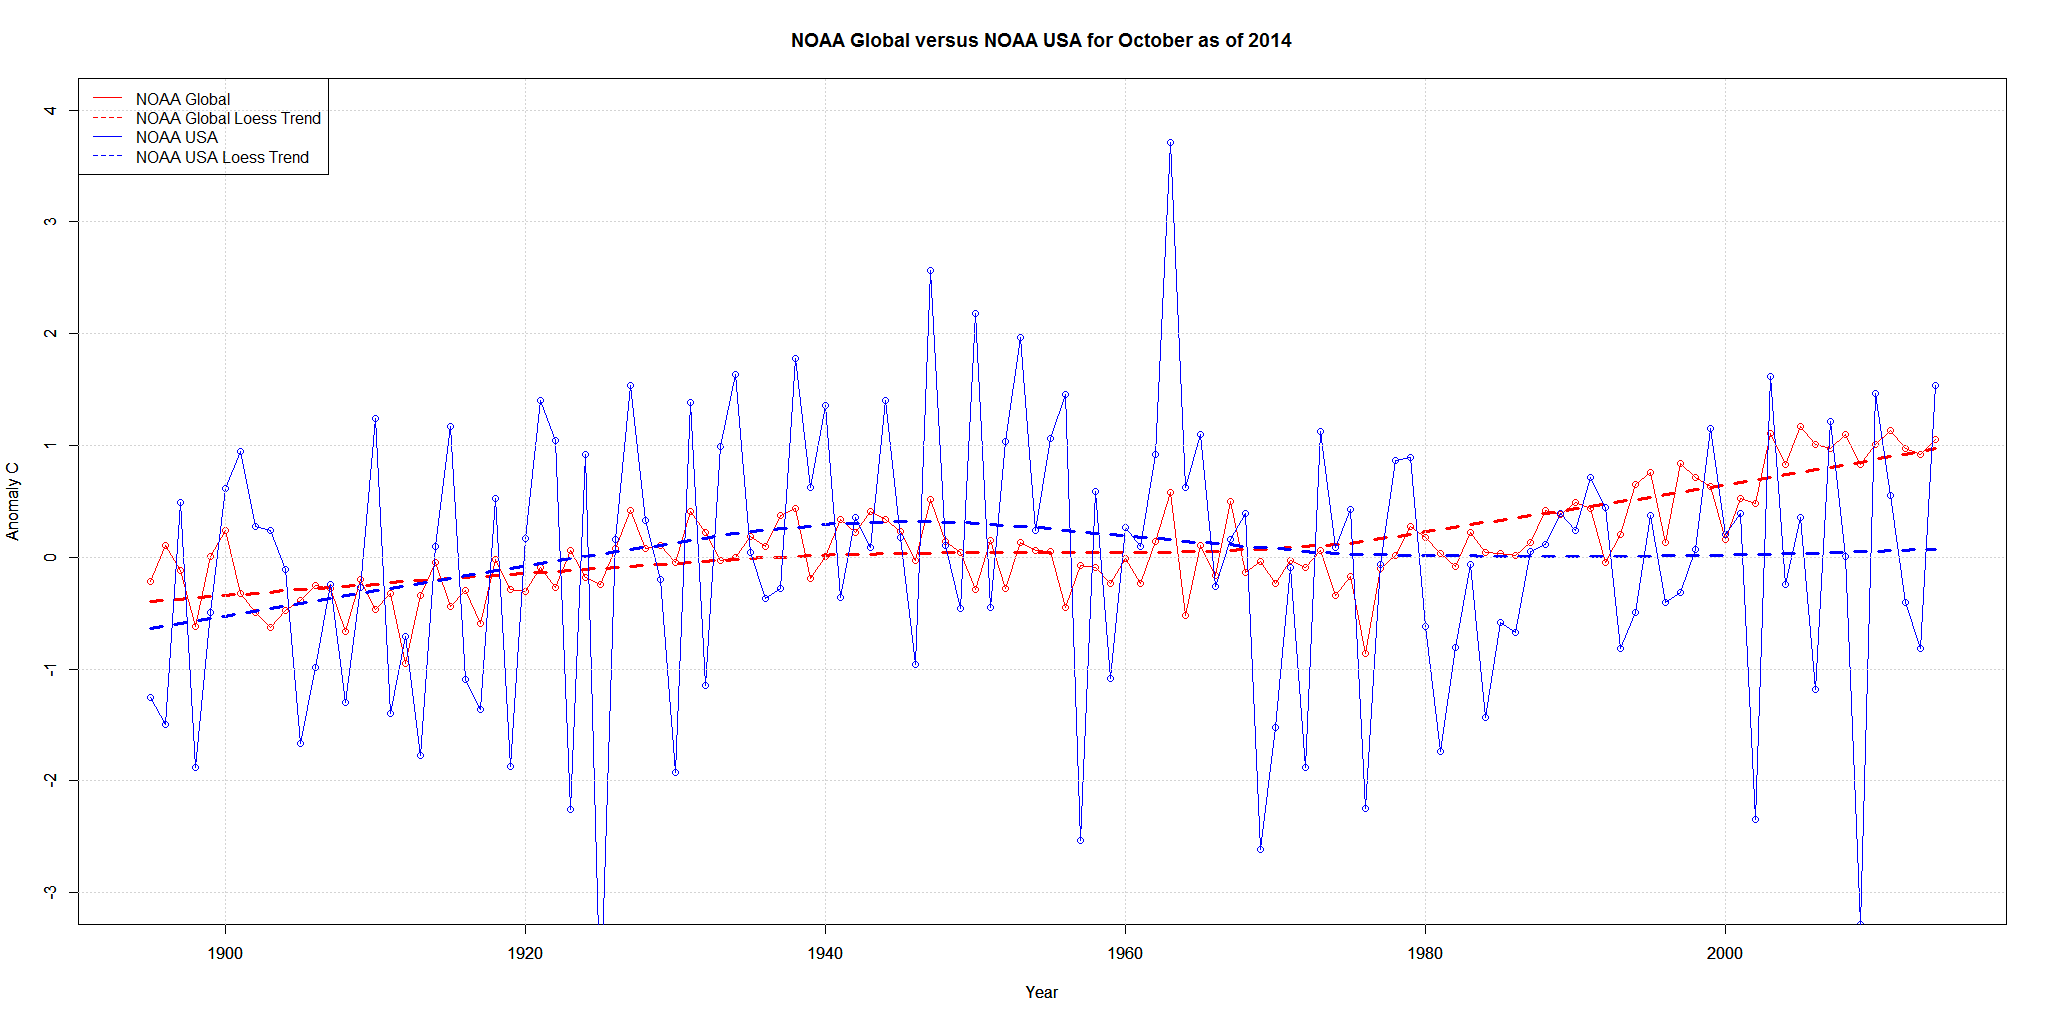
Update: Global is LAND temperatures, not LAND and OCEAN combined because of course the USA is not an ocean.
Wow.This is NOAA Global versus NOAA USA Tmax for October only.
What an amazing divergence over the last 30 years.
When the AGW cult says the USA is only 2% of the globe, remind them that USA and Global temperatures used to track pretty closely.
According to the NOAA Year To Date (January to October 2014) was 80th Hottest Max Temperature out of 120.
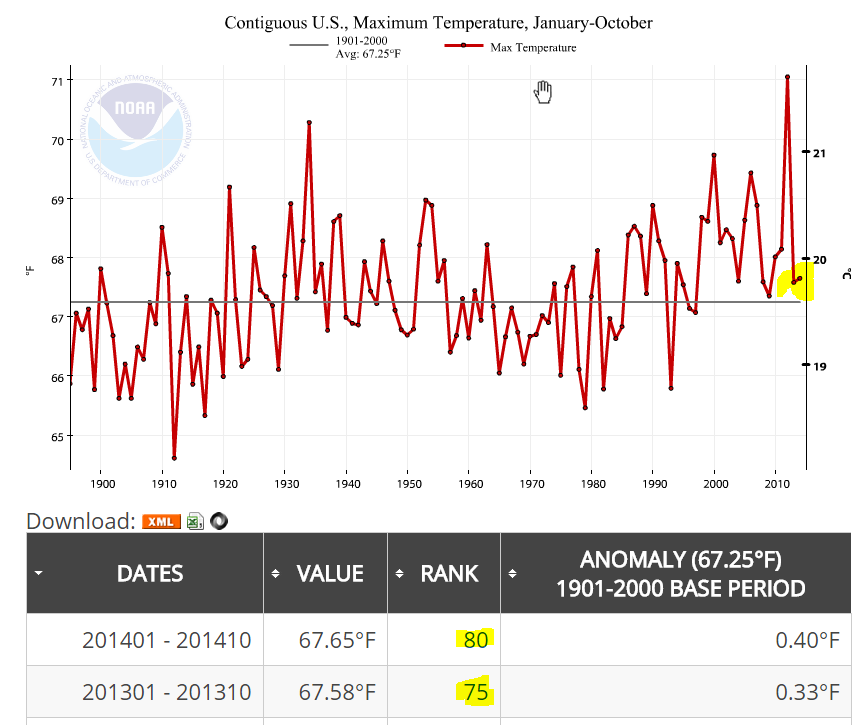
How hot was October 1963 in the USA?
In 1963 October was 3.9F hotter than October 2014.
20 states had the hottest max temperature ever for October. (Those marked 120)
10 states had the 2nd hottest max temperature ever for October. (Those marked 119)
3 states had the 3rd hottest max temperature ever for October. (Those marked 118)
etc
So much for CO2 …

