Antarctic Sea Ice Extent – 6th daily record for 2013

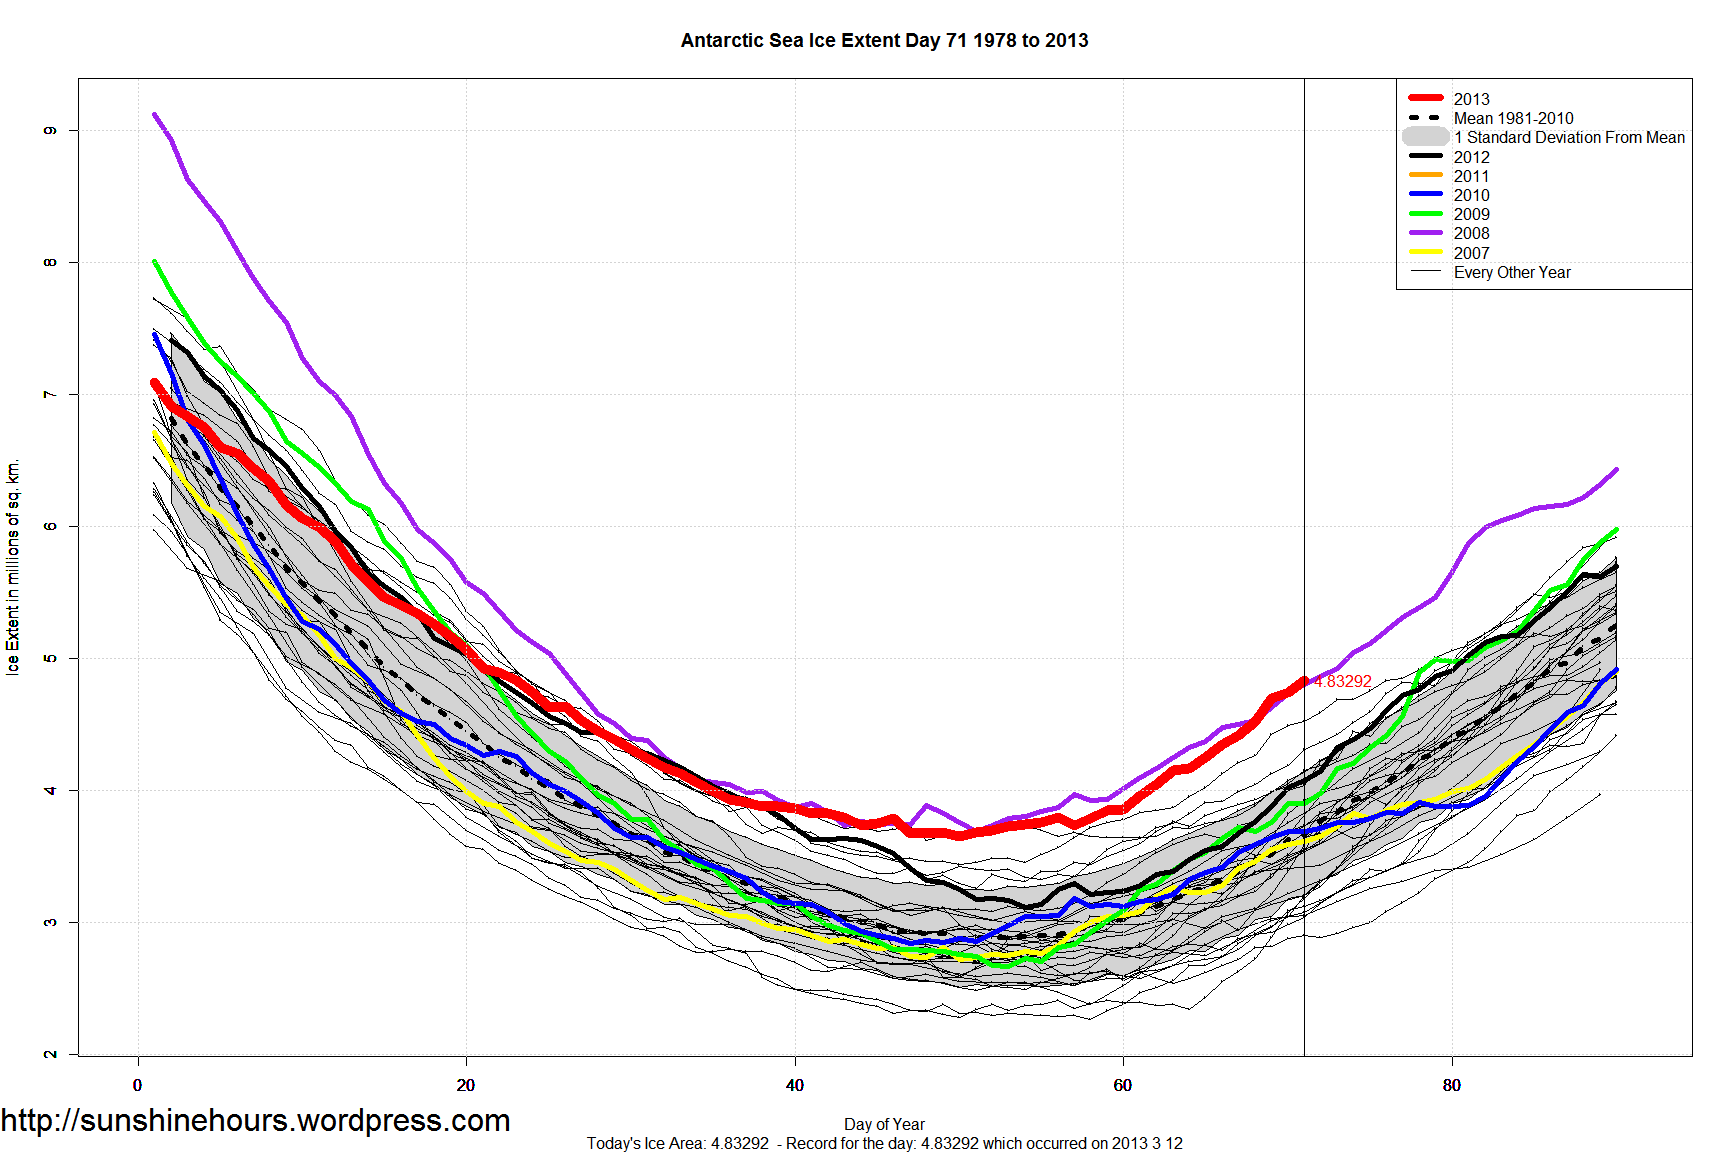
Day 71 in the Antarctic was another daily record for Sea Ice Extent (most ice on this day). That makes 6 for 2013 (corrected from 2003 typo).  And the 3rd day in a row.

There are only 7 days where a daily record exists from before 2000. 345 records are from 2006 to 2013.

NSIDC has a dedicated page to Arctic Sea Ice.  And one for Greenland. But no page dedicated to the Antarctic. That makes them propagandists, not scientists.

Year No of Daily Records
2010 129
2008 128
2006 29
2012 24
2007 21
2009 8
2000 6
2013 6
2004 5
1998 4
2005 3
1979 2
1980 1

Day 71

Antarctic_Sea_Ice_Extent_Zoomed_2013_Day_71_1981-2010

USA NOAA Feb 2013 – Colder Than 1896 and 1898 and 1907 and 45 Other February’s

According to the NOAA February 2013 was tied with 1944 as the 70th “warmest” February out of 119.

Which means 48 have been warmer. Not much sign of warming this February. The following list are the February’s warmer than 2013:

1896 1898 1907 1909 1915 1921 1924 1925 1926 1927 1930 1931 1932 1935 1938 1943 1945 1946 1950 1952 1953 1954 1957 1961 1962 1970 1974 1976 1977 1981 1983 1984 1986 1987 1990 1991 1992 1995 1996 1997 1998 1999 2000 2002 2005 2006 2009 2012

The term “global warming” doesn’t quite fit a February colder than 1896 and 1898 and 1907 ….

Year Feb Feb Rank Out of 119
2013 34.78 70 (Tie)
2012 37.74 105
2011 33.04 49
2010 31.78 30
2009 36.76 97
2008 34.51 67
2007 32.37 38
2006 34.88 72
2005 37.89 107
2004 33.53 53
2003 32.96 46
2002 36.34 93
2001 33.89 62
2000 39.84 117
1999 39.73 115
1998 39.08 112
1997 36.21 91
1996 35.58 82
1995 37.31 101
1994 31.87 31
1993 31.02 22
1992 39.75 116
1991 39.72 114
1990 36.74 95
1989 29.04 9
1988 33.58 55
1987 37.54 103
1986 35.9 86
1985 30.88 20
1984 37.51 102
1983 37.03 99
1982 32.61 42
1981 36.75 96
1980 32.87 44
1979 28.09 7
1978 28.02 6
1977 36.13 88
1976 39.62 113
1975 32.81 43
1974 34.88 73
1973 33.75 59
1972 33.59 56
1971 33.57 54
1970 35.46 81
1969 32.91 45
1968 33.03 48
1967 33.02 47
1966 31.37 25
1965 32.57 40
1964 31.97 33
1963 34.21 65
1962 35.03 74
1961 37.57 104
1960 30.75 19
1959 32.61 41
1958 32.09 35
1957 38.11 109
1956 32.35 37
1955 31.26 23
1954 41.5 119
1953 36.1 87
1952 35.7 85
1951 34.66 69
1950 35.69 84
1949 32.06 34
1948 31.74 29
1947 31.54 26
1946 35.05 75
1945 35.45 80
1944 34.78 70
1943 36.45 94
1942 30.97 21
1941 33.69 57
1940 34.05 64
1939 30.18 16
1938 36.17 89
1937 31.9 32
1936 25.33 1
1935 36.18 90
1934 34.43 66
1933 29.87 14
1932 36.85 98
1931 38.14 110
1930 40.28 118
1929 27.17 5
1928 34.53 68
1927 37.98 108
1926 37.85 106
1925 38.47 111
1924 35.31 77
1923 29.76 12
1922 32.12 36
1921 37.08 100
1920 33.72 58
1919 32.42 39
1918 34.05 63
1917 30.26 17
1916 33.13 50
1915 36.22 92
1914 29.81 13
1913 29.74 11
1912 31.33 24
1911 33.82 60
1910 29.48 10
1909 35.12 76
1908 33.17 51
1907 35.63 83
1906 33.83 61
1905 27.1 4
1904 31.64 27
1903 28.75 8
1902 31.66 28
1901 29.93 15
1900 30.71 18
1899 25.61 2
1898 35.43 79
1897 33.5 52
1896 35.31 78
1895 26.9 3

Canada Feb 2013

According to the Environment Canada “Normals”, Canada was warmer than the 1971-2000 average in Feb 2013.

The warmth was concentrated in the far west and the far east.

The middle was slightly warmer or slightly cooler. And the Arctic was mostly cooler than normal.

The anomaly map for Feb 2013 and an animated gif of Jan 2012 to Feb 2013. Click to make them bigger.

EC Normals 0x0 2013-02


EC_0x0_Map_Jan2012-Feb2013

Vancouver and Victoria Airports in BC Colder Thans 1940s/1960s

The next two graphs are anomaly data from Environment Canada up to Feb 2013. The data in the boxes is the 5 year average. Red for warmer than 1971-2000, blue for colder.

For Victoria, the last 5 years have been only .06C warmer than the 1971-2000 average. More importantly, it is the coldest 5 year period in the last 25 years. And colder than the period around 1960.  And it would probably be colder than the 1940s if the data went back that far,

For Vancouver, the last 5 years have been only .18C warmer than the 1971-2000 average. More importantly, it is the coldest 5 year period in the last 25 years. And colder than the period around 1960.  And colder than the 5 year period around 1940 .

Click to enlarge.

All Data - VICTORIA INTL A - Environment Canada as of  February 2013

All Data - VANCOUVER INTL A - Environment Canada as of  February 2013