Global Sea Ice Extent Sep 19 2014 – 348,000 sq km above the 1981-2010 mean. Data for Day 261. Data here.
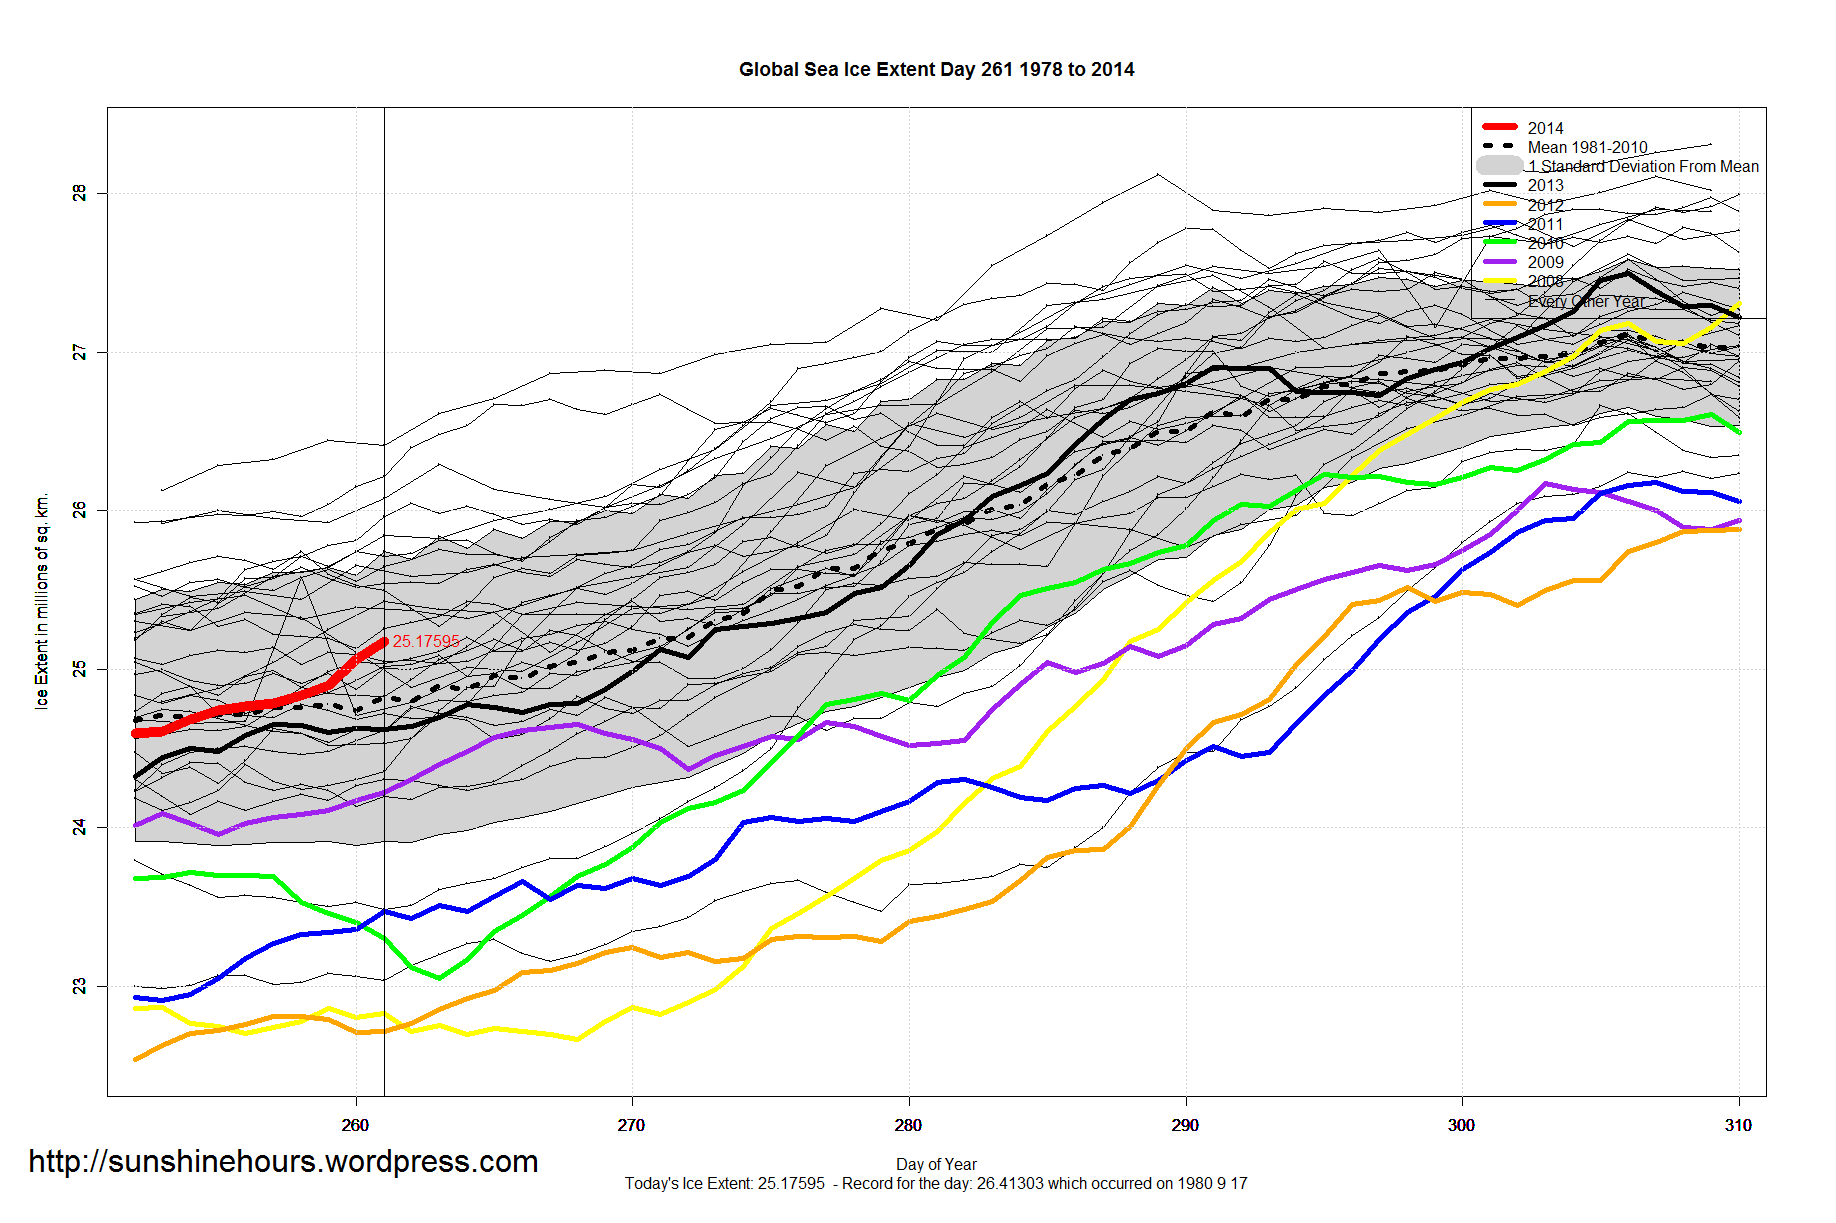

Global Sea Ice Extent Sep 19 2014 – 348,000 sq km above the 1981-2010 mean. Data for Day 261. Data here.
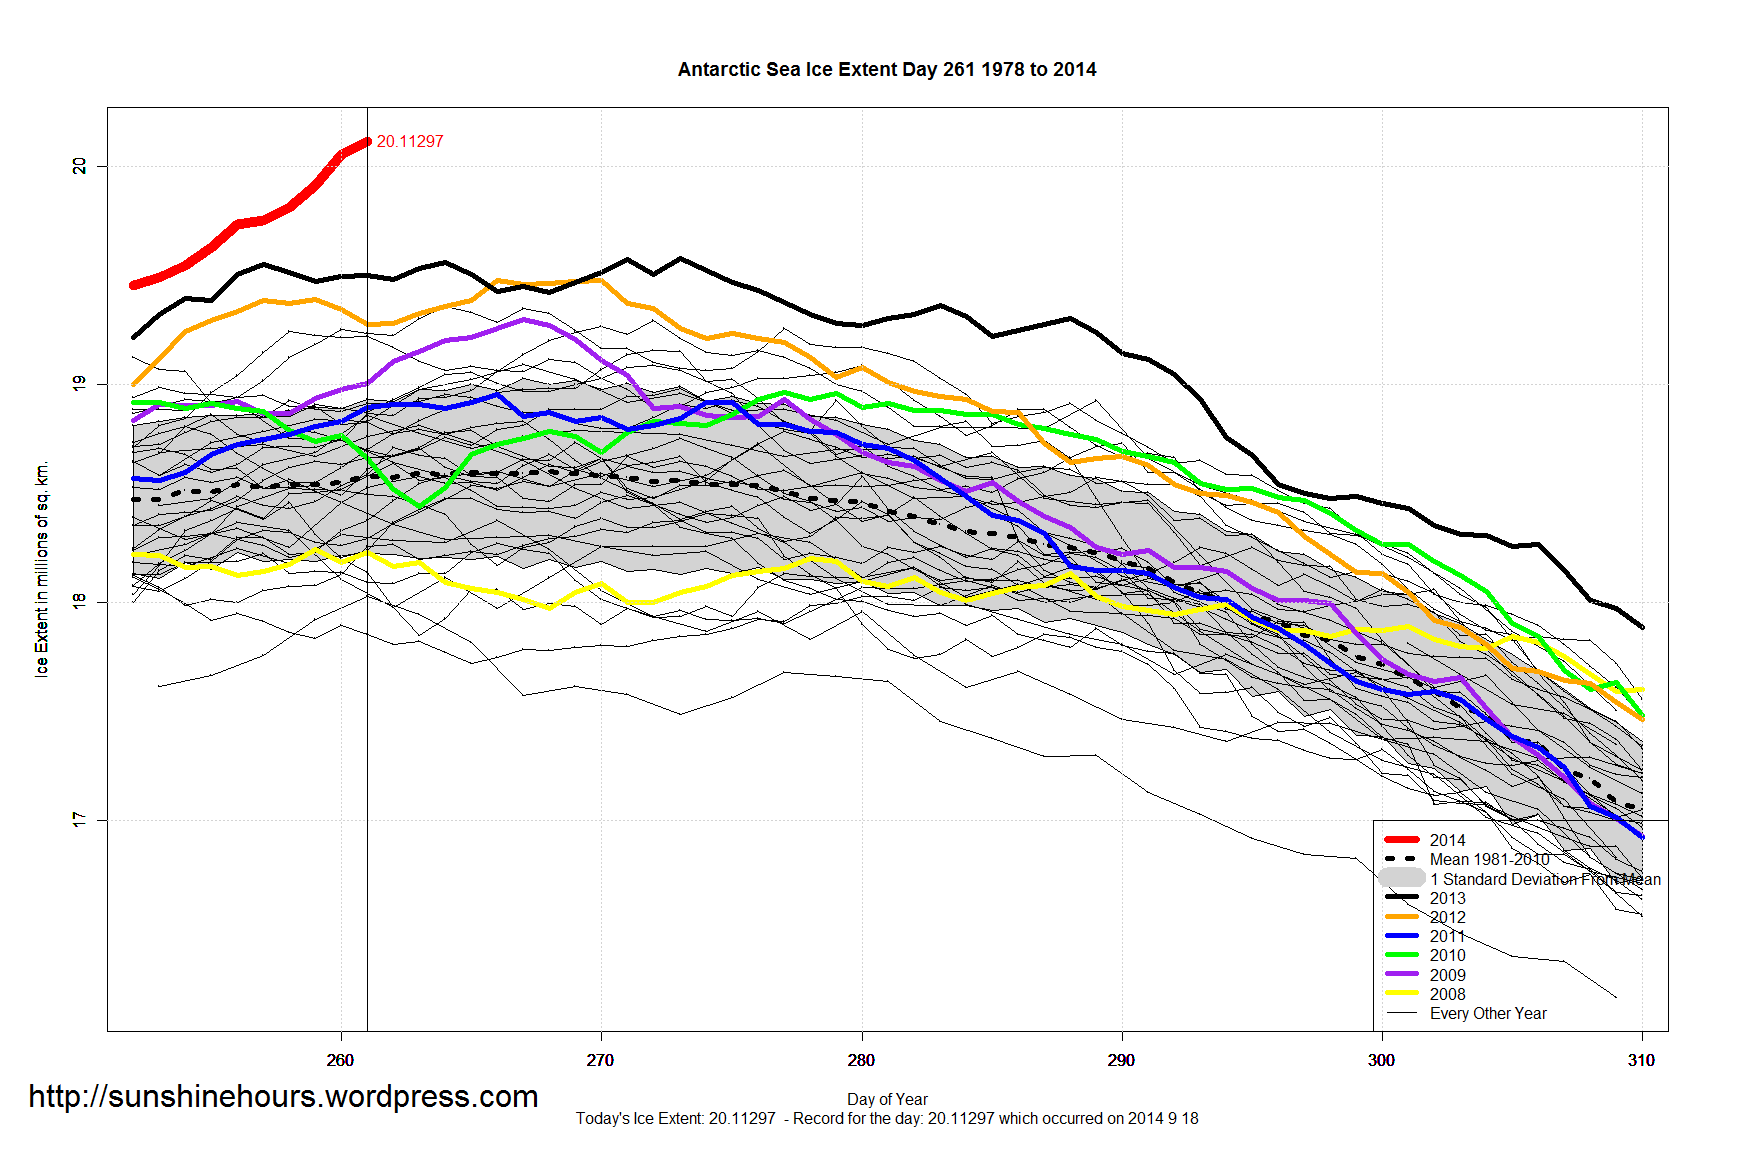
Antarctic Sea Ice Extent Sep 19 2014 – 1,535,000 sq km above the 1981-2010 mean. Data for Day 261. Data here.
Another 58,000 sq km. 7th All-Time Record in 7 Days.
610,000 sq km higher than the previous daily record.

Arctic Sea Ice Extent Sept 19 2014 – -1,187,000 sq km below the 1981-2010 mean. Data for Day 261. Data here.
Looking even better for Day 259 to have been the minimum since it is now 80,000 lower than today (261).


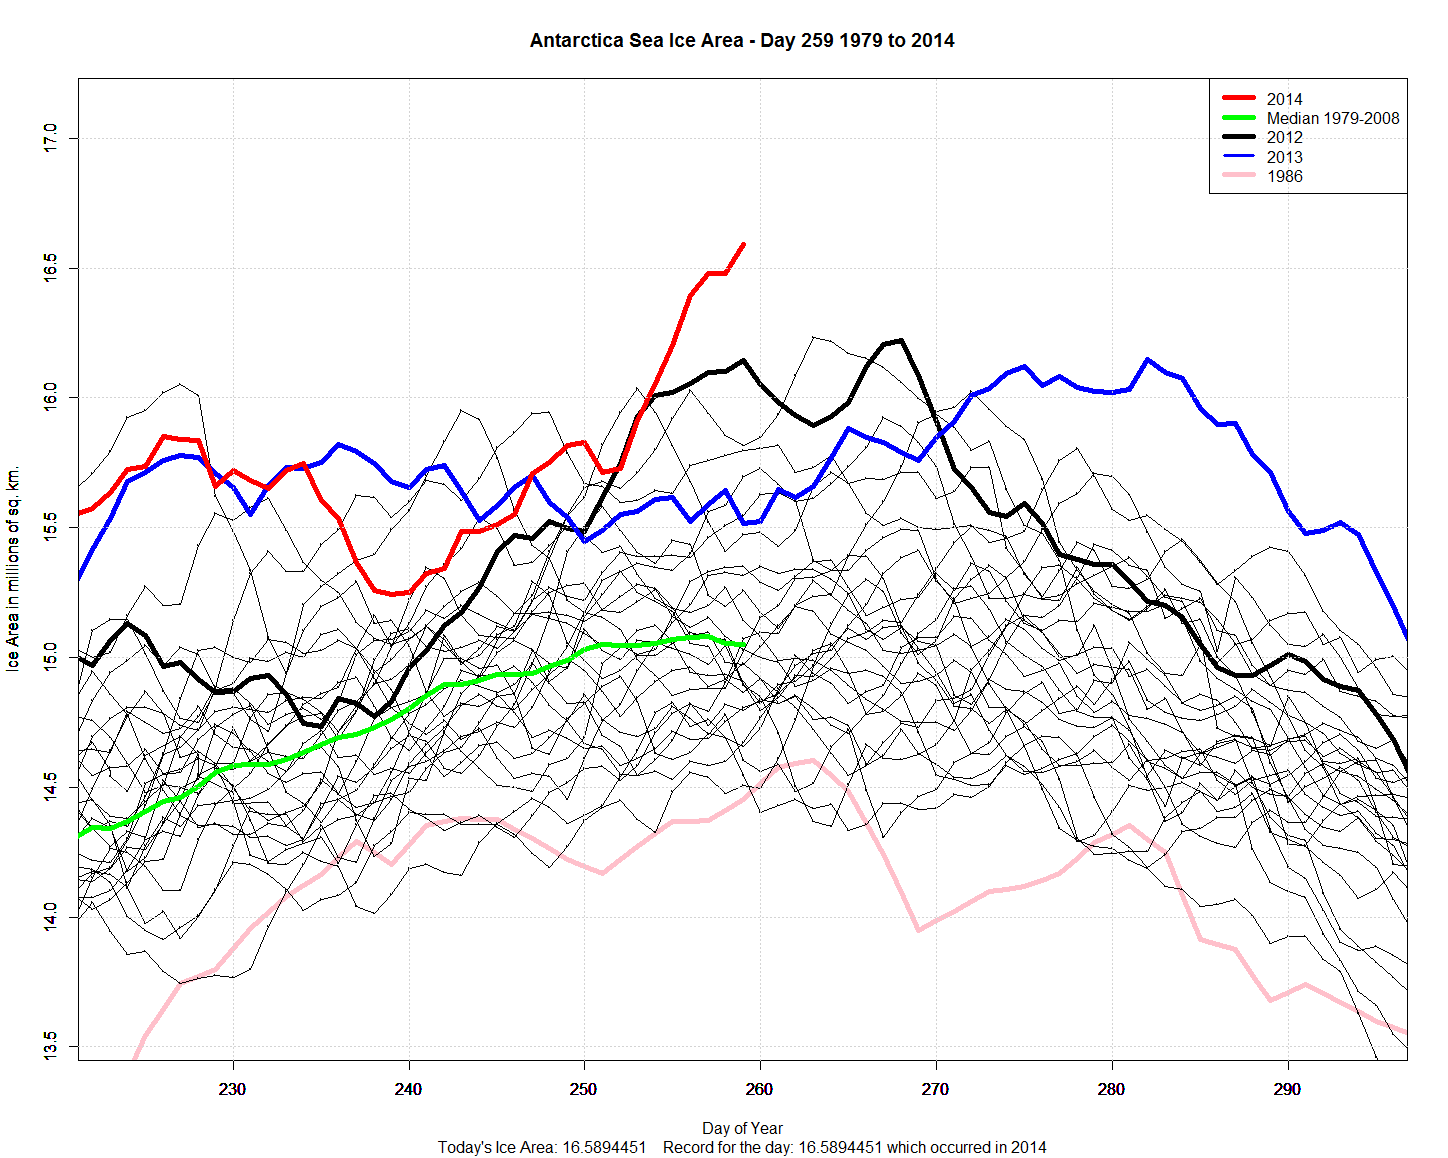
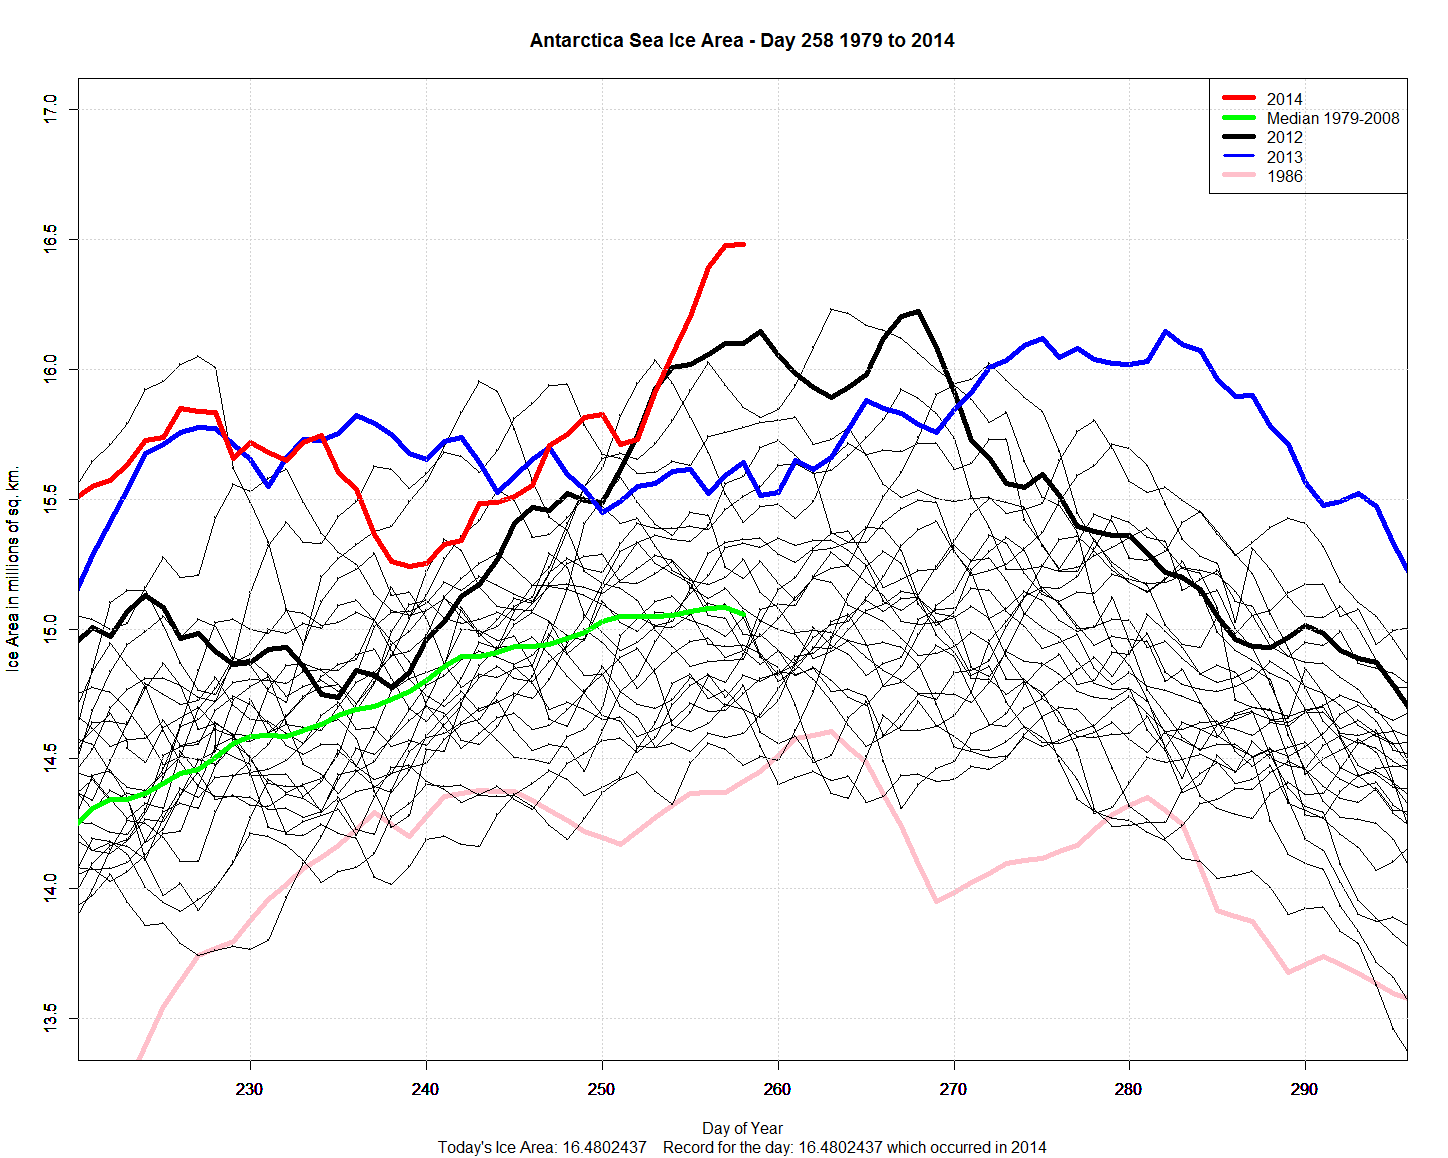
Antarctic Sea Ice Area has now resumed the skyrocketing climb after a short pause (difference between Area/Extent here)
Another day another 100,000 sq km. Mind boggling.
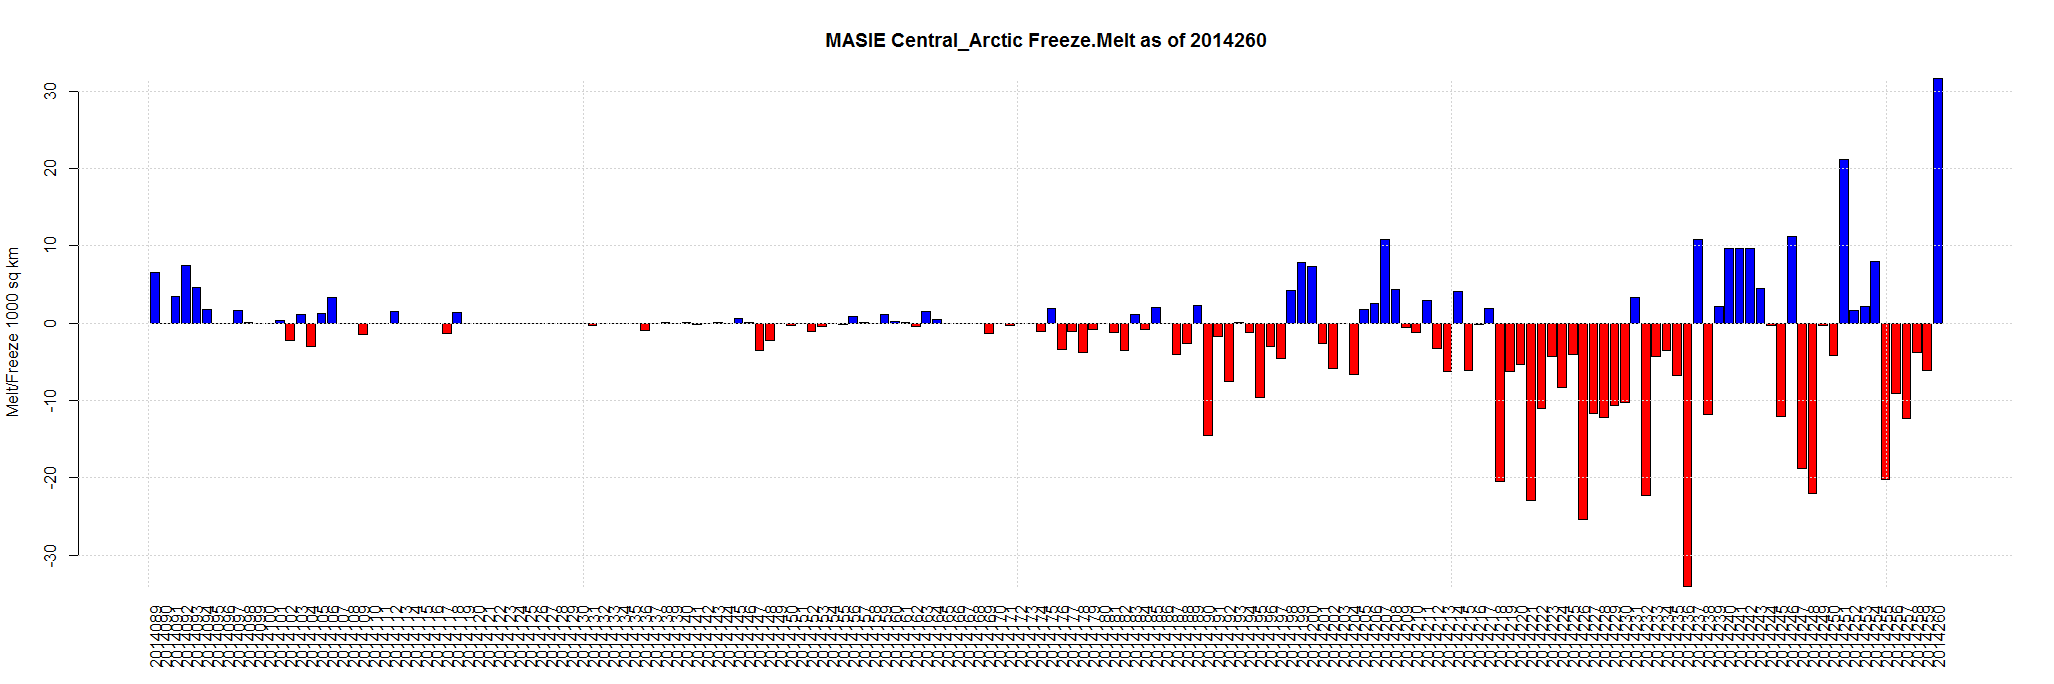
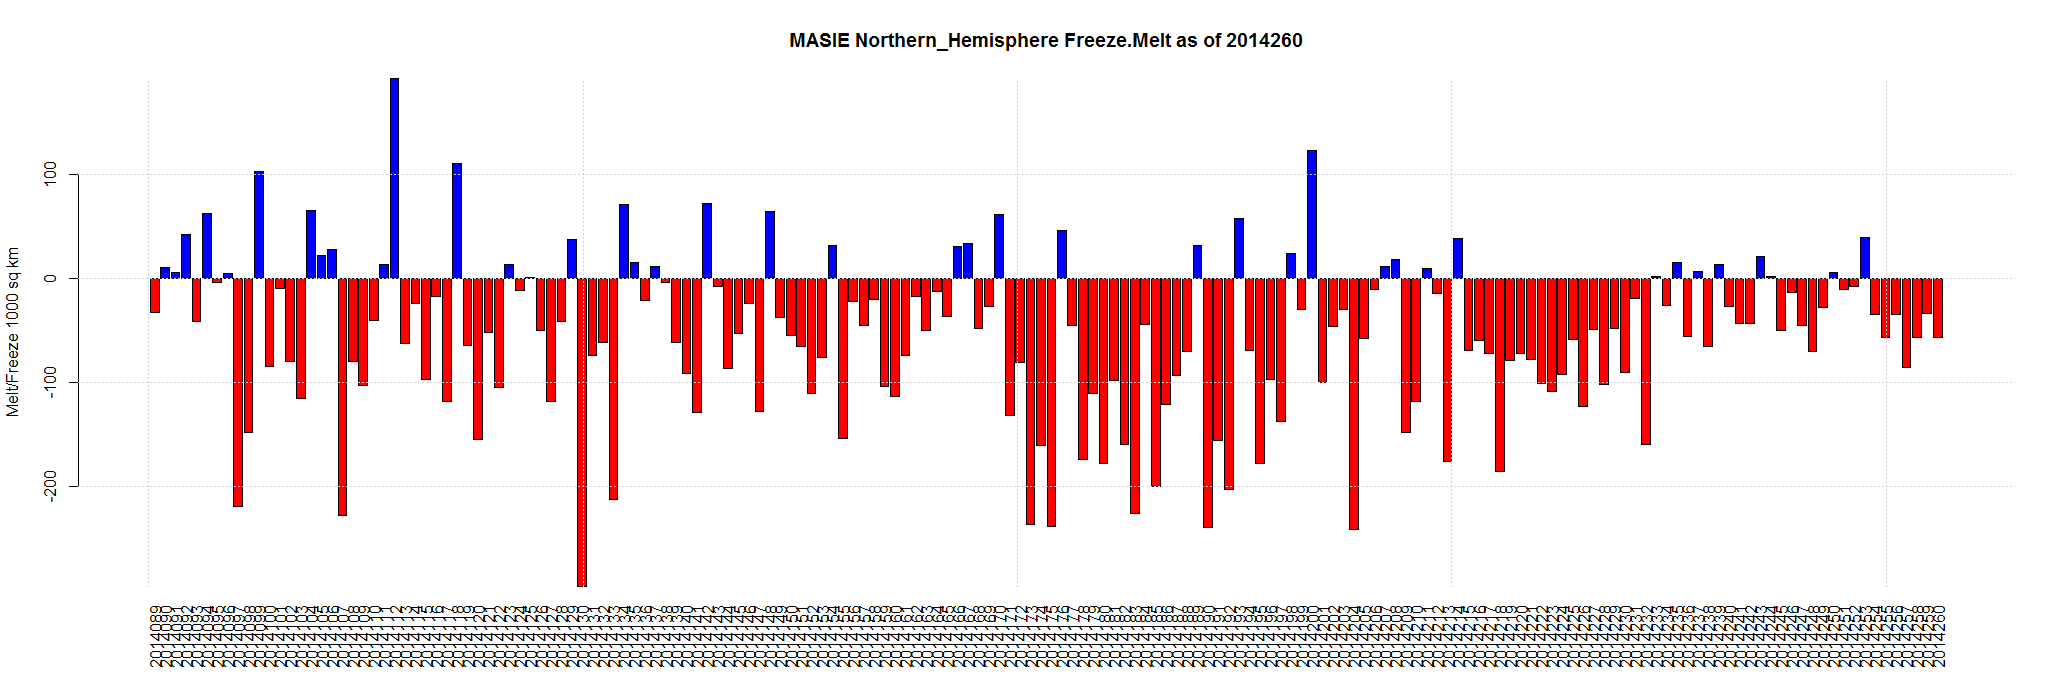
Sept 18 2014 MASIE Update – Medium Melt and Big Central Arctic Gain
Data here. Click for bigger.
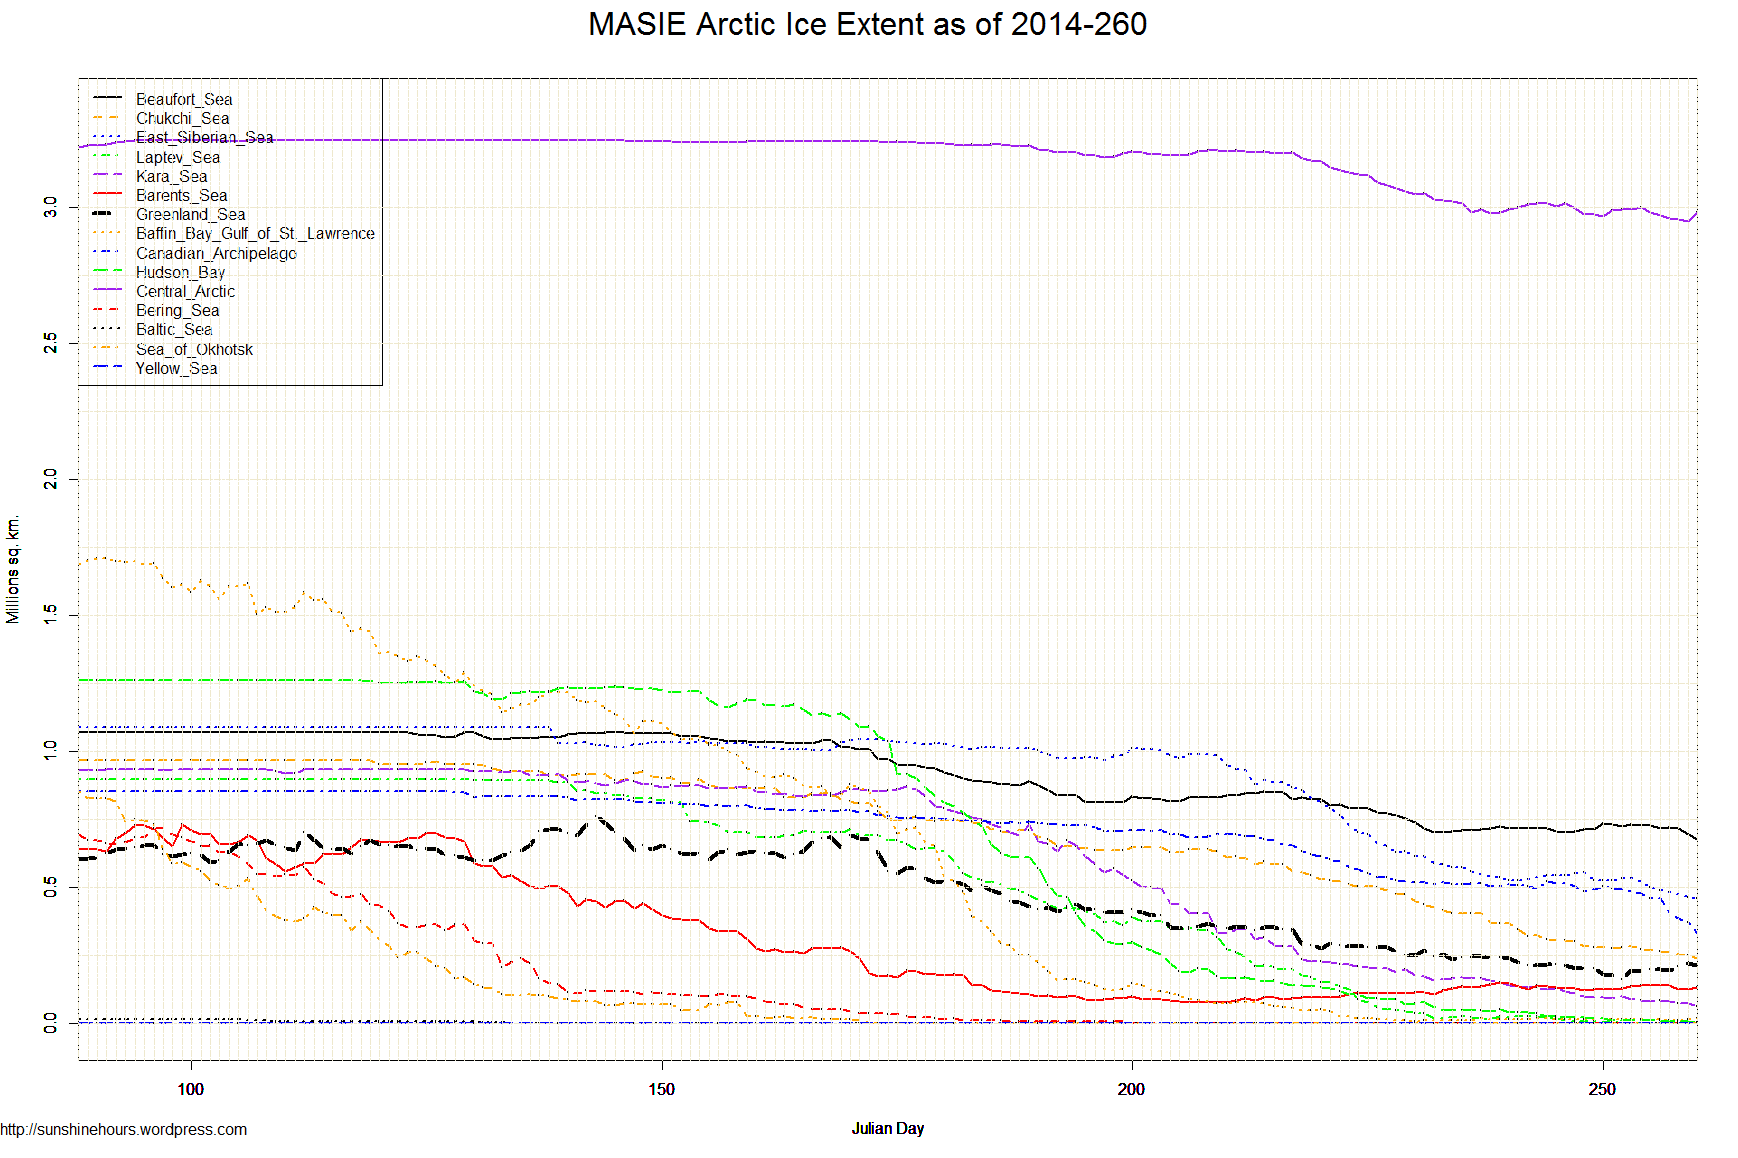
| Region | 173 days ago | End | Last 172 | Last 28 | Last 14 | Last 7 | Last 3 | Last 1 |
| Canadian Archipelago | 853,214 | 331,660 | -521,554 | -179,370 | -183,777 | -155,477 | -78,494 | -41,581 |
| Beaufort Sea | 1,070,445 | 678,465 | -391,980 | -25,262 | -26,216 | -54,770 | -43,926 | -16,862 |
| Kara Sea | 933,859 | 61,733 | -872,126 | -95,826 | -58,235 | -27,112 | -19,357 | -14,050 |
| Chukchi Sea | 966,006 | 241,117 | -724,889 | -184,543 | -63,637 | -41,078 | -19,801 | -11,512 |
| Greenland Sea | 603,416 | 213,914 | -389,502 | -34,885 | -1,827 | 17,409 | 19,740 | -6,533 |
| Hudson Bay | 1,260,903 | 4,135 | -1,256,769 | -55,008 | -18,466 | -8,650 | -2,902 | -3,229 |
| East Siberian Sea | 1,087,137 | 461,992 | -625,145 | -126,523 | -83,345 | -73,217 | -21,801 | -3,169 |
| Laptev Sea | 897,845 | 887 | -896,958 | -18,177 | -11,402 | -908 | -1,145 | -36 |
| Bering Sea | 697,324 | 0 | -697,324 | 0 | 0 | 0 | 0 | 0 |
| Baltic Sea | 15,337 | 0 | -15,337 | 0 | 0 | 0 | 0 | 0 |
| Sea of Okhotsk | 853,240 | 0 | -853,240 | 0 | 0 | 0 | 0 | 0 |
| Yellow Sea | 0 | 0 | 0 | 0 | 0 | 0 | 0 | 0 |
| Baffin Bay Gulf of St. Lawrence | 1,688,530 | 18,284 | -1,670,247 | 8,127 | 3,313 | 3,848 | 7,130 | 3,659 |
| Barents Sea | 645,917 | 131,777 | -514,140 | 22,516 | 1,391 | -6,385 | -7,790 | 5,423 |
| Central Arctic | 3,221,921 | 2,981,795 | -240,126 | -47,345 | -32,338 | -11,856 | 21,781 | 31,627 |
| Northern Hemisphere (Total) | 14,805,115 | 5,126,902 | -9,678,213 | -736,295 | -474,541 | -357,926 | -146,566 | -56,264 |
| NH (Average Loss per Day) | -55,943 | -26,296 | -33,896 | -51,132 | -48,855 | -56,264 |
Arctic Sea Ice Extent Sep 18 2014 – -1,179,000 sq km below the 1981-2010 mean. Data for Day 260. Data here.
A Rise of 27,000 sq km, Day 259 with 4.98339 million sq km is now the potential minimum (but I make no predictions since it has been a surprising year).


For those who say Antarctic Sea Ice Extent increases are small and have nothing in common with Arctic losses:
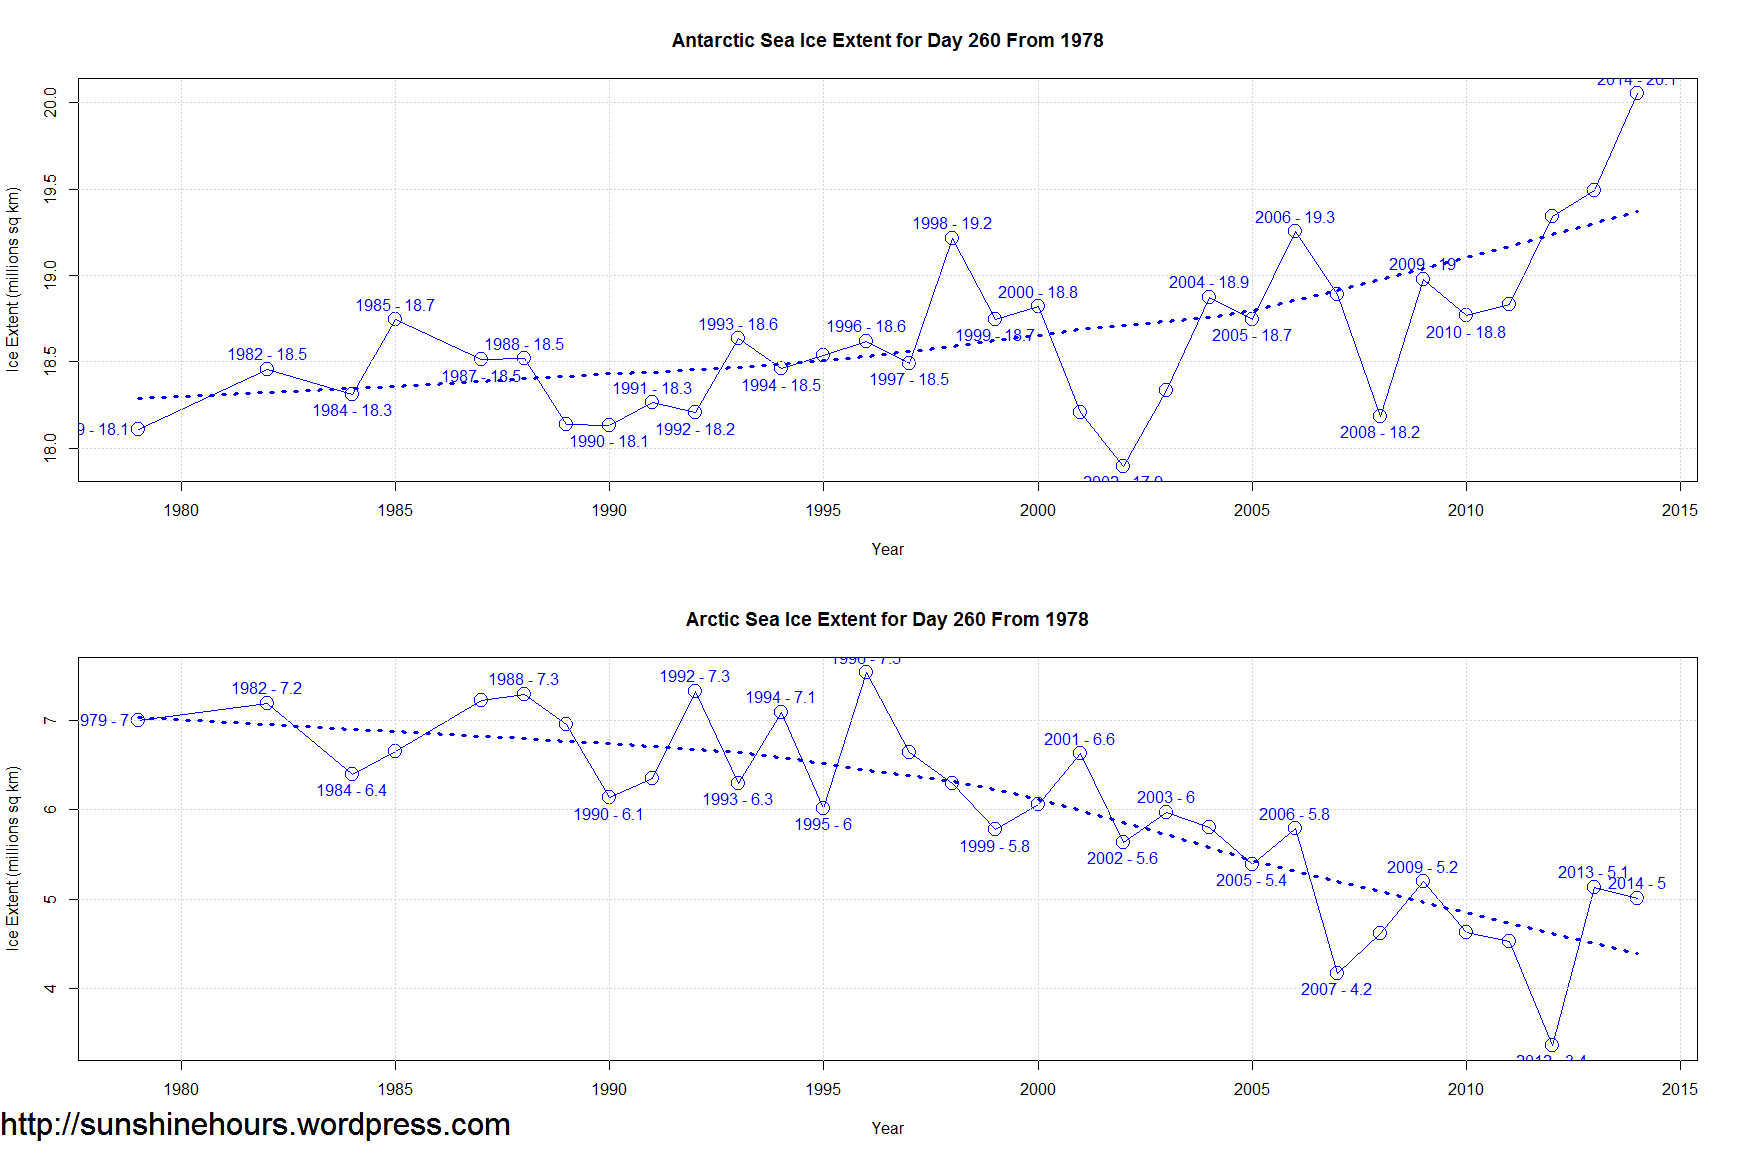
Antarctic Sea Ice Extent Sept 18 2014 – 1,500,000 sq km above the 1981-2010 mean. Data for Day 260. Data here.
500,000 sq km higher than 2013’s record.
Amazing.
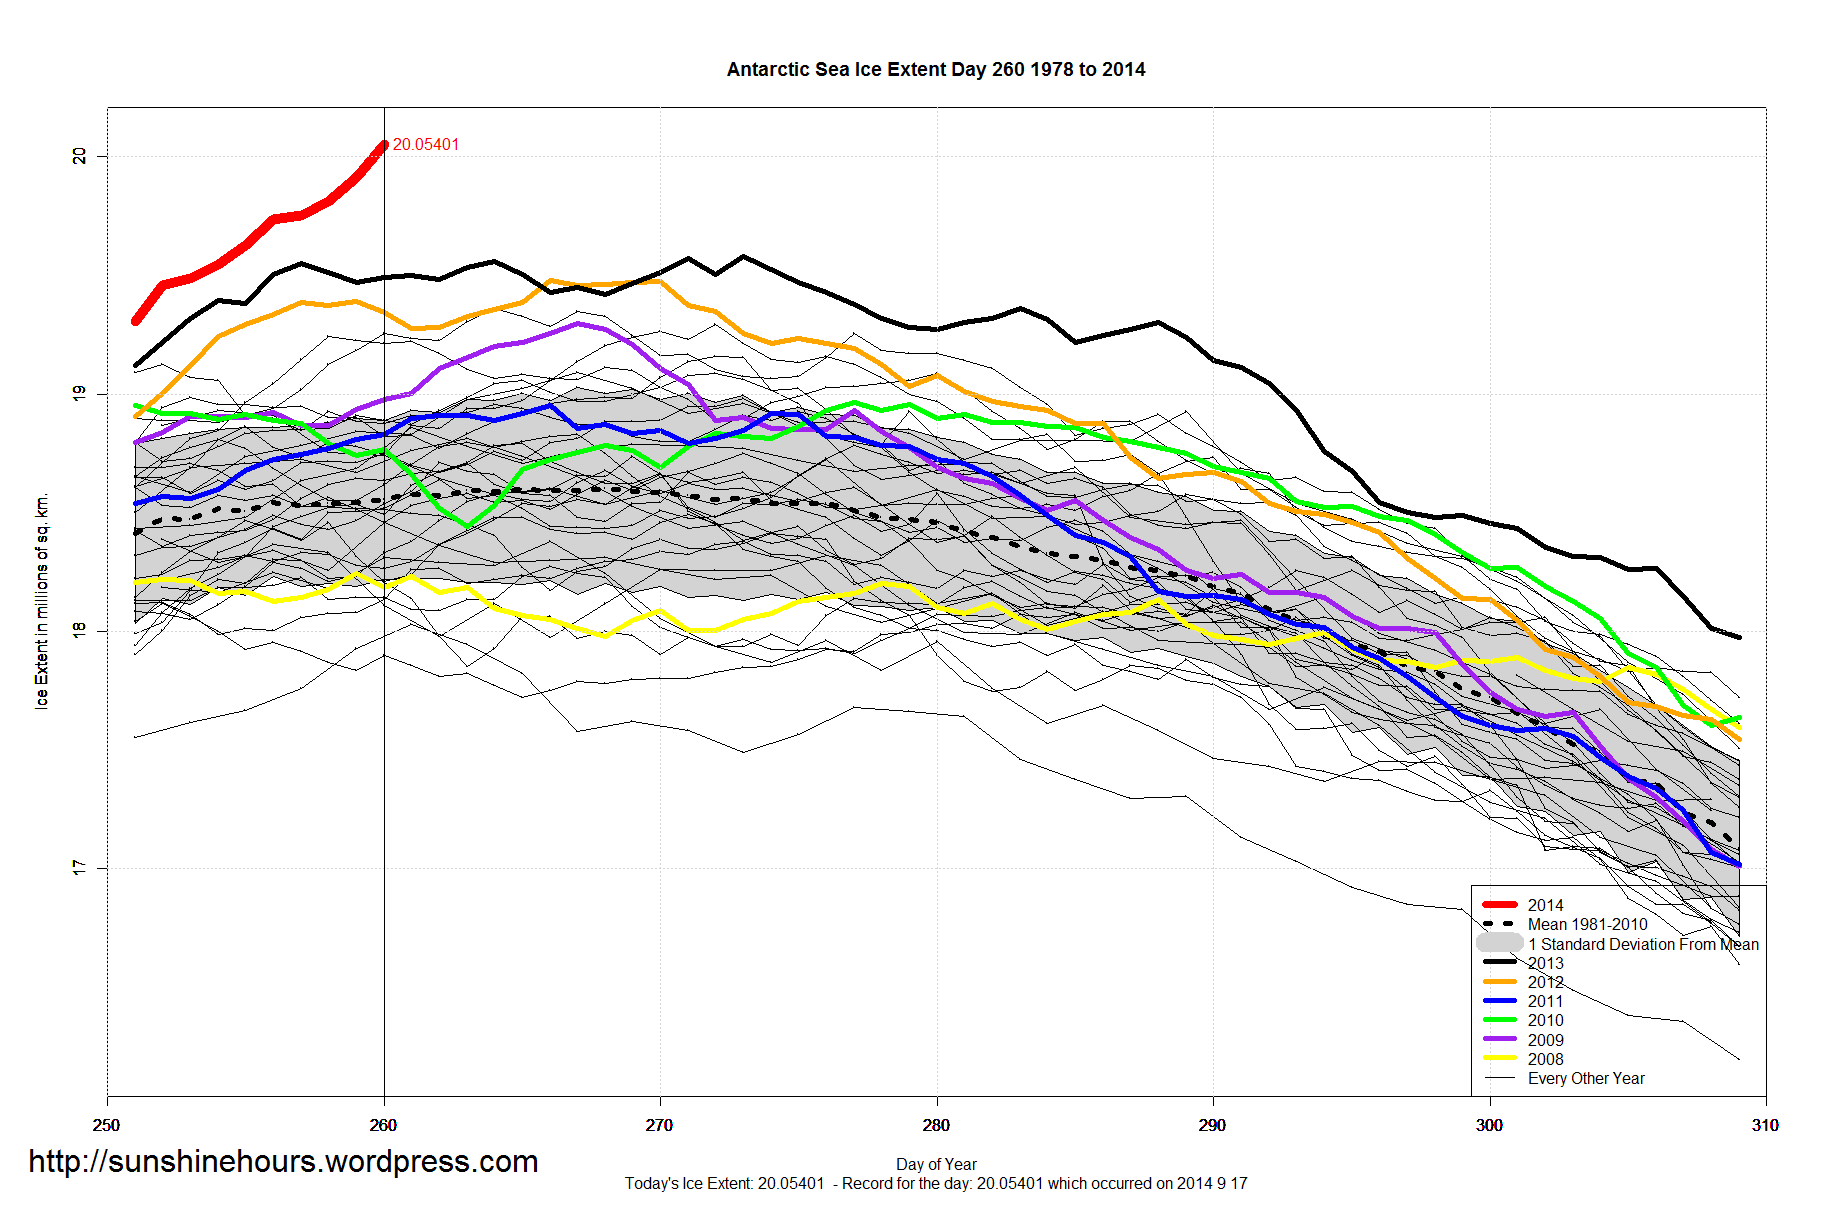

Antarctic Sea Ice Area has now set a 3rd all-time record on 3 days. (difference between Area/Extent here)
The new record for area is 16.47964 million sq km which is 85,000 sq km higher than the previous days record and 240,000 sq km higher than the old 2007 record.
Arctic Sea Ice Extent Sep 17 2014 – -1,254,000 sq km below the 1981-2010 mean. Data for Day 259. Data here.


