Global Sea Ice Extent Sep 17 2014 – 119,000 sq km above the 1981-2010 mean. Data for Day 259. Data here.


Global Sea Ice Extent Sep 17 2014 – 119,000 sq km above the 1981-2010 mean. Data for Day 259. Data here.
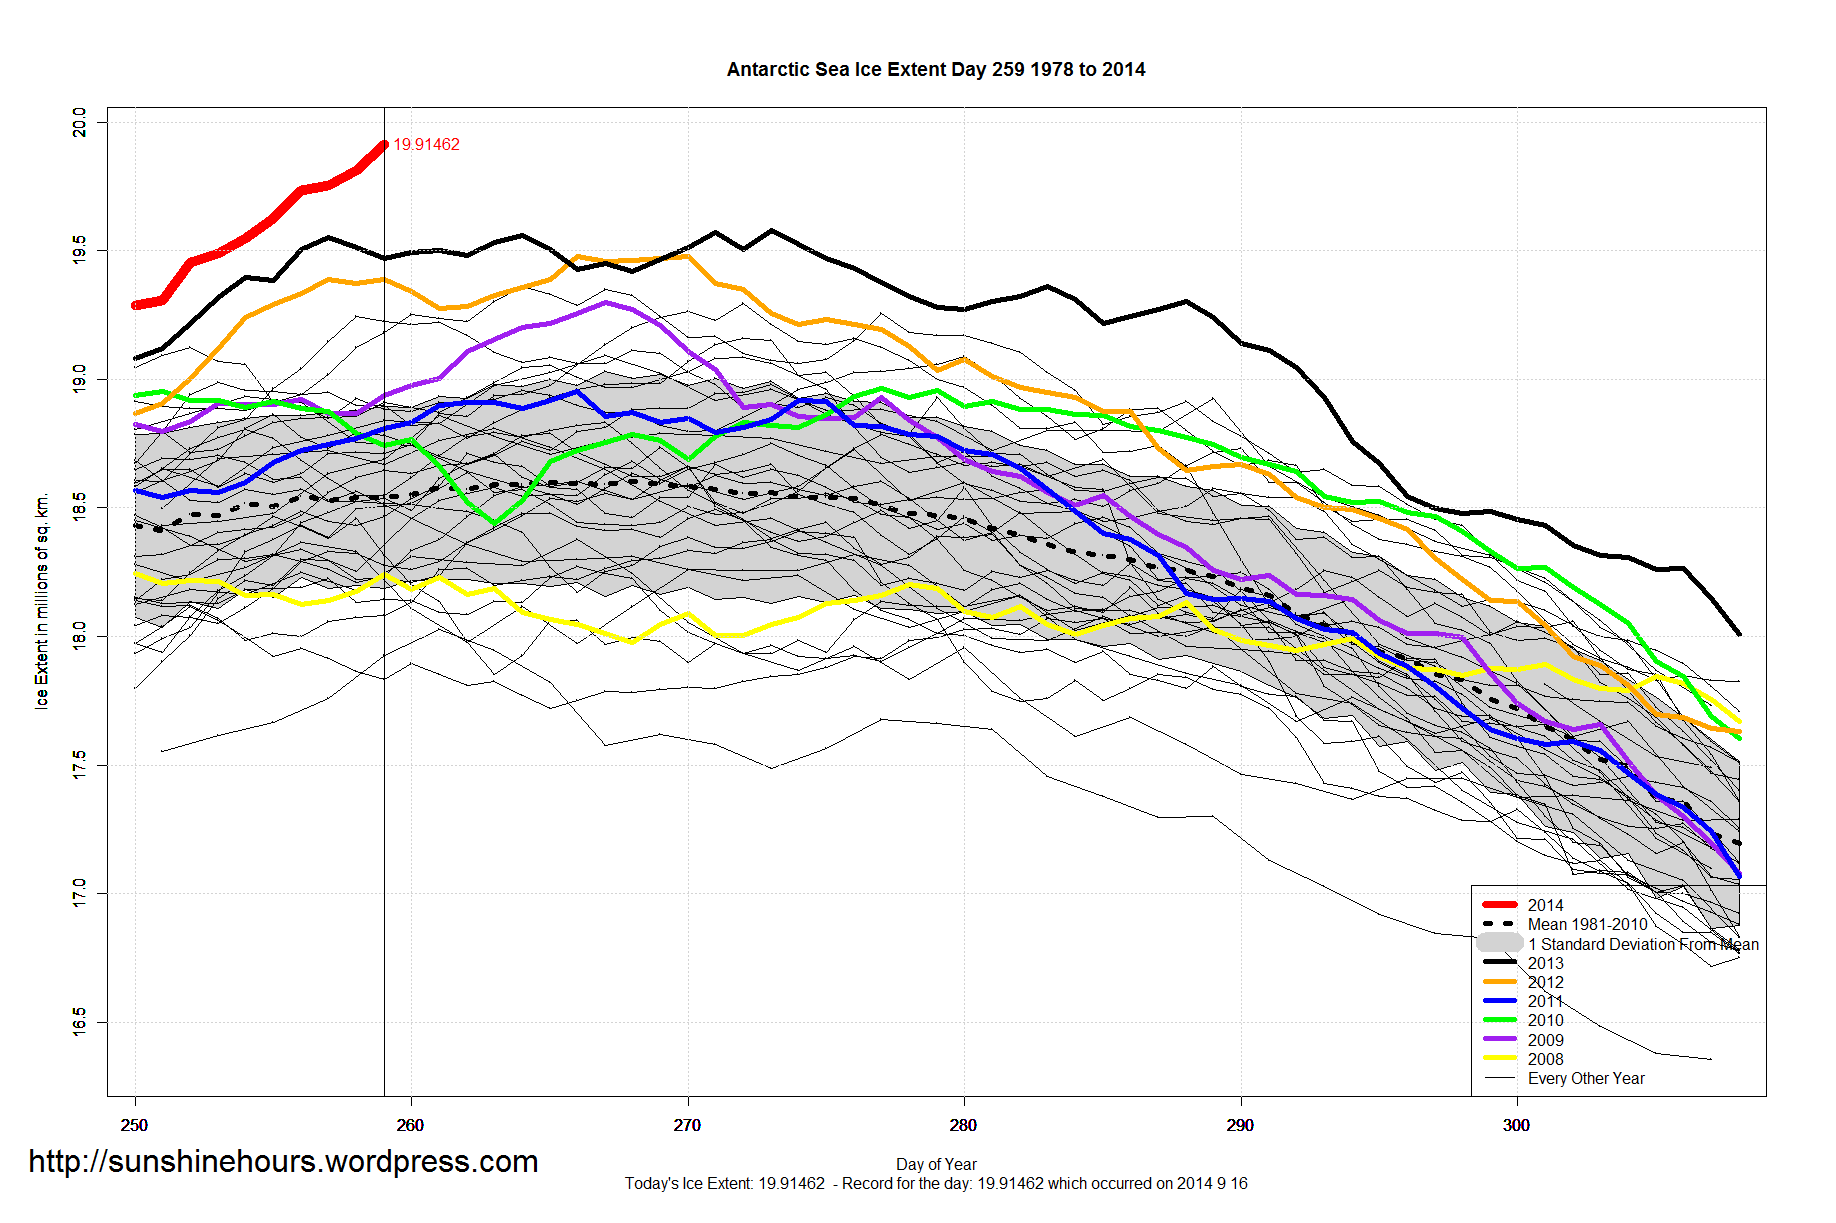
Antarctic Sea Ice Extent Sep 17 2014 – 1,372,000 sq km above the 1981-2010 mean. Data for Day 259. Data here.
5th All-Time Record in 5 days. Skyrocketing toward 20,000,000.
Wow.

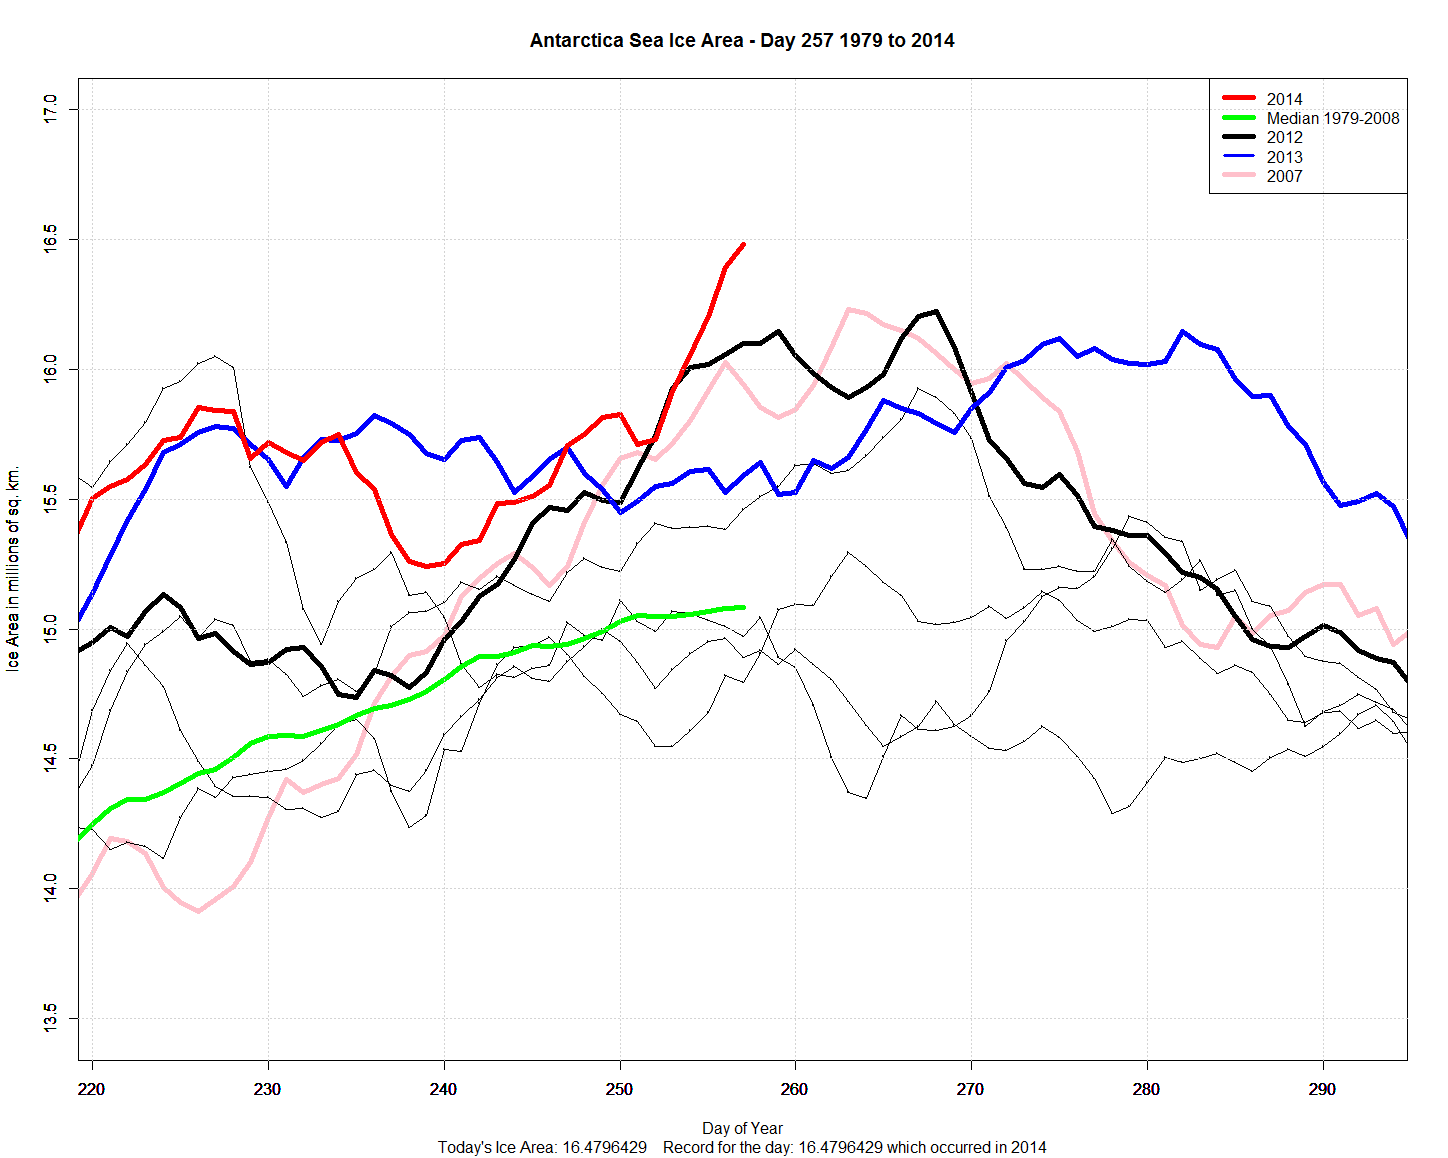
Antarctic Sea Ice Area has now set another all-time record too. (difference between Area/Extent here)
The new record for area is 16.47964 million sq km which is 85,000 sq km higher than the previous days record and 240,000 sq km higher than the old 2007 record.
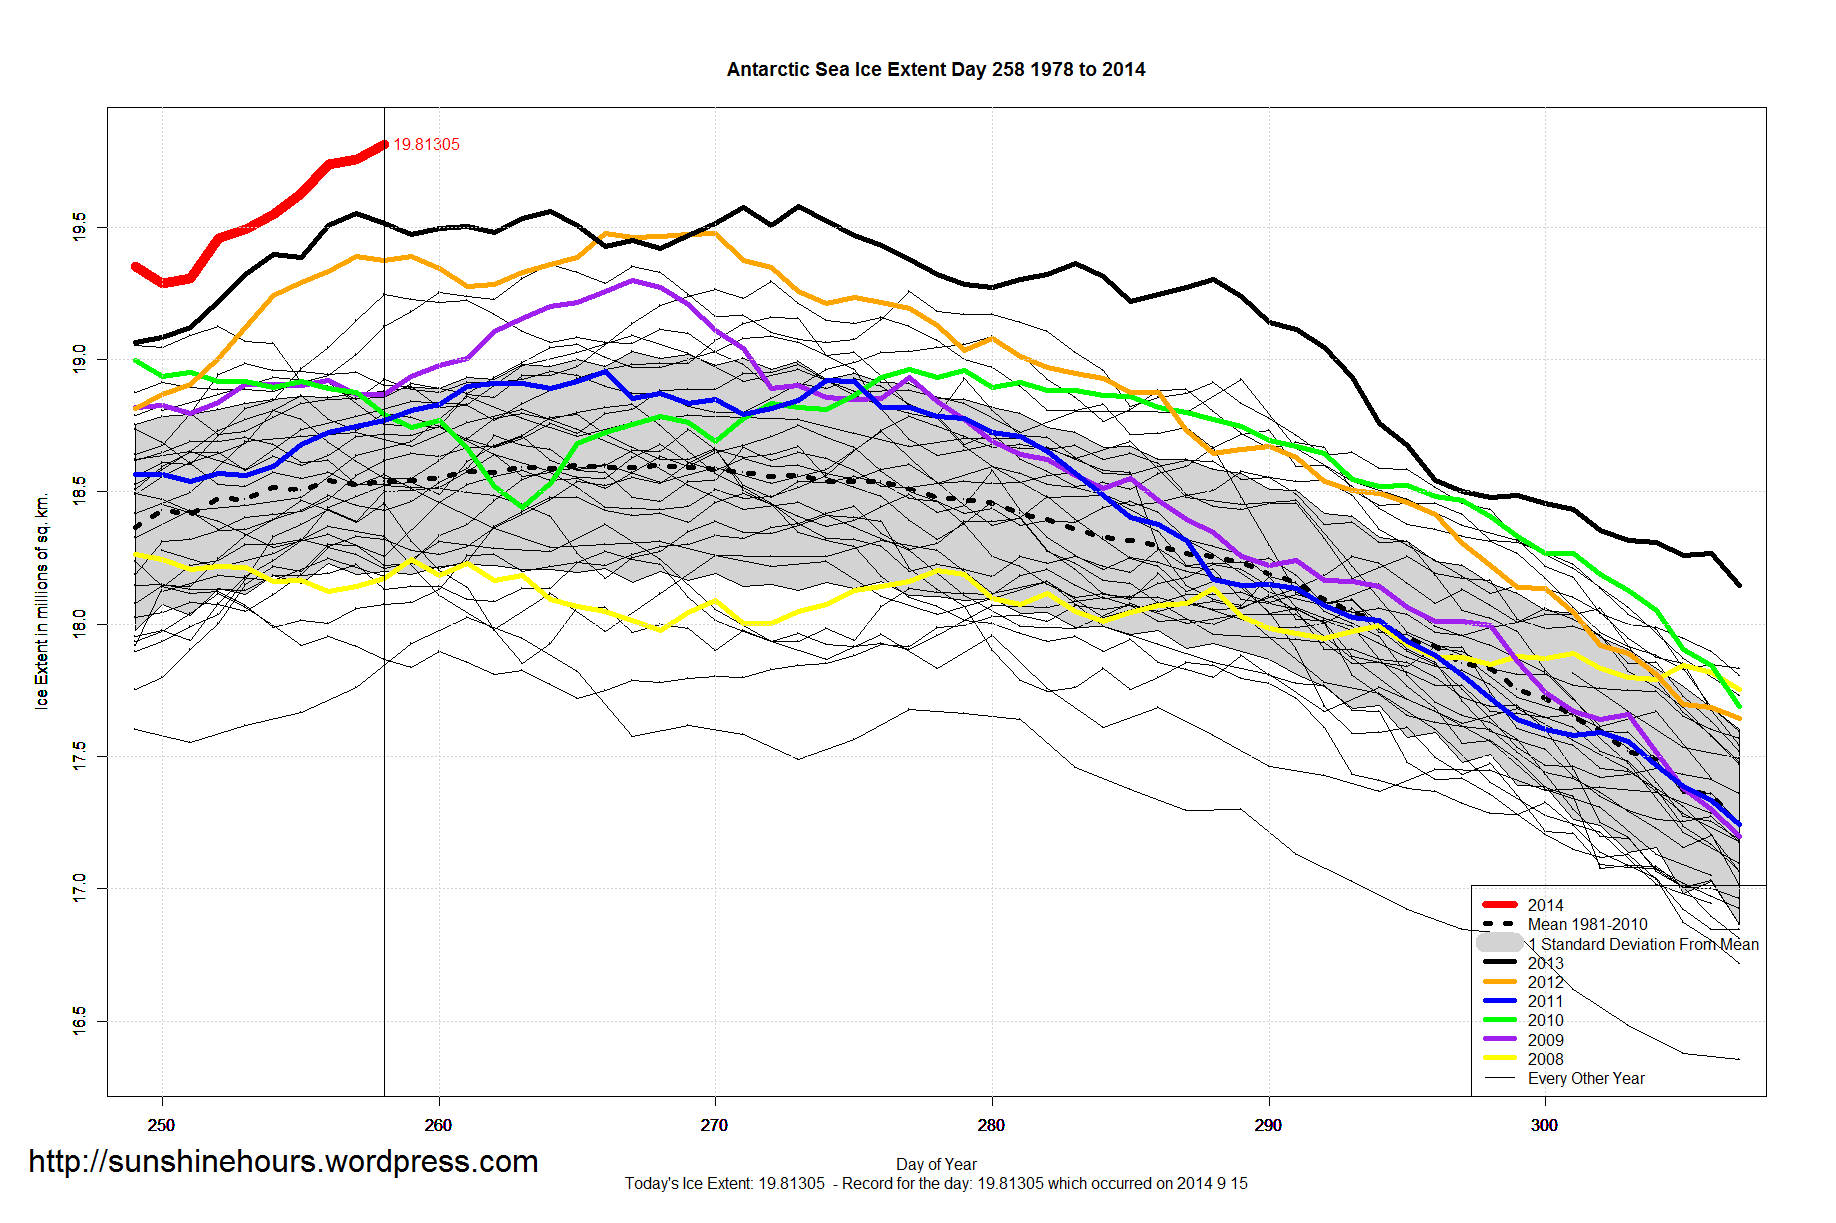
Antarctic Sea Ice Extent Sept 16 2014 – 1,273,000 sq km above the 1981-2010 mean. Data for Day 258. Data here.
4th All-Time Record in a row. 240,000 sq km higher than 2013’s record.
Holy Crap … there is a chance of hitting 20,000,000 sq km.

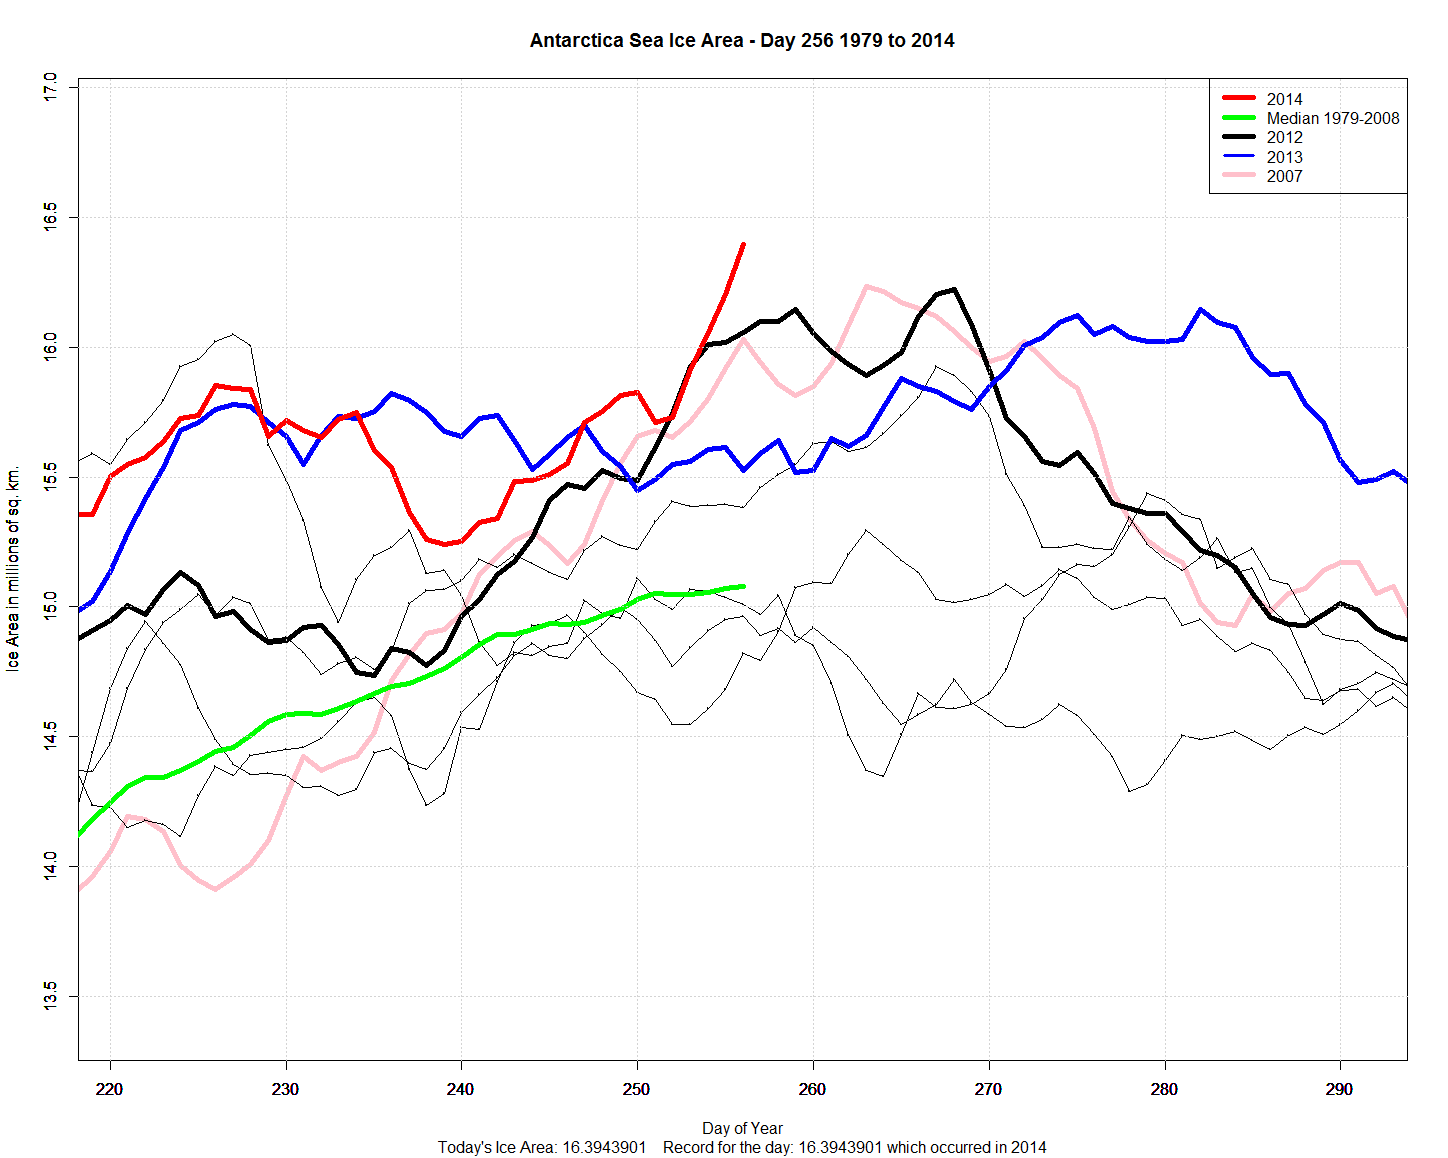
The new record for area is 16.39439 million sq km which is 162,000 sq km higher than the old 2007 record.
I usually graph Sea Ice Extent. Every once in a while I graph Sea Ice Area. (Like yesterday)
“A simplified way to think of extent versus area is to imagine a slice of swiss cheese. Extent would be a measure of the edges of the slice of cheese and all of the space inside it. Area would be the measure of where there is cheese only, not including the holes. That is why if you compare extent and area in the same time period, extent is always bigger.”
http://nsidc.org/arcticseaicenews/faq/#area_extent
Sept 15 2014 MASIE Update – Big Melting (Unlike the NSIDC which showed a small gain)
Data here. Click for bigger.
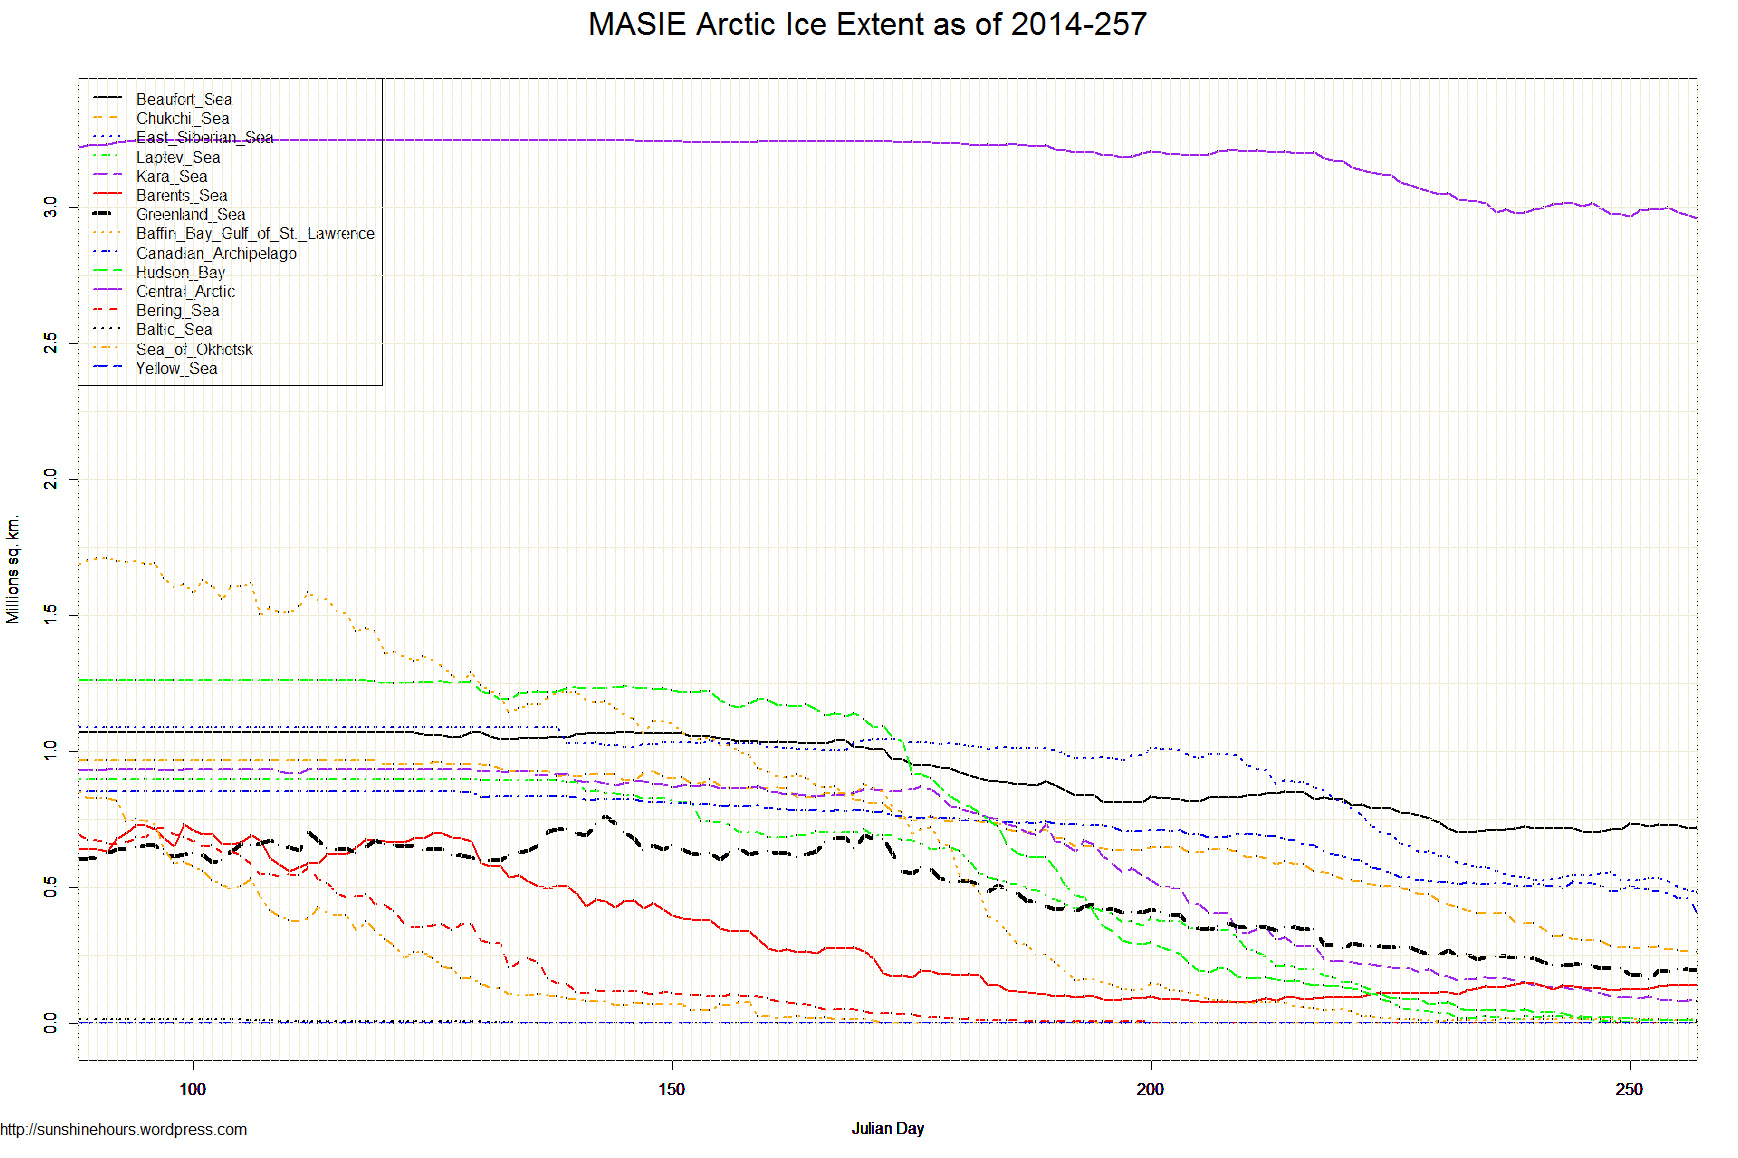
| Region | 170 days ago | End | Last 169 | Last 28 | Last 14 | Last 7 | Last 3 | Last 1 |
| Canadian Archipelago | 853,214 | 410,154 | -443,060 | -113,390 | -85,264 | -93,621 | -69,749 | -49,456 |
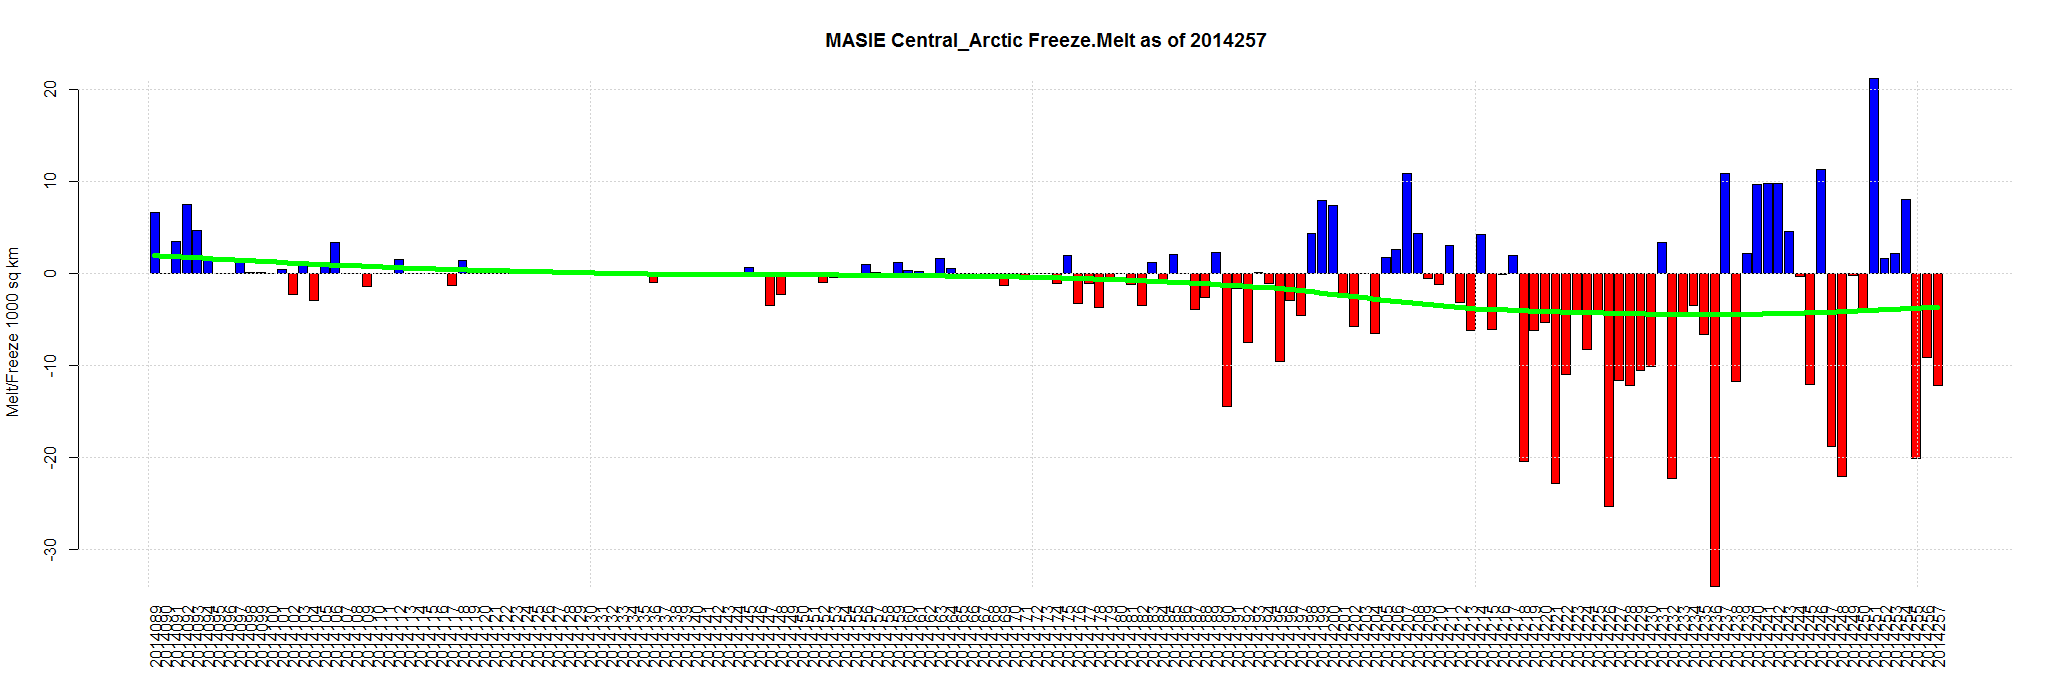
| Central Arctic | 3,221,921 | 2,960,014 | -261,907 | -98,238 | -55,263 | -8,786 | -41,586 | -12,261 |
| Greenland Sea | 603,416 | 194,174 | -409,241 | -58,400 | -20,178 | 13,124 | 3,858 | -6,766 |
| Kara Sea | 933,859 | 81,091 | -852,769 | -119,512 | -50,315 | -15,125 | -3,266 | -5,227 |
| East Siberian Sea | 1,087,137 | 483,793 | -603,344 | -149,103 | -55,548 | -43,748 | -38,896 | -5,178 |
| Chukchi Sea | 966,006 | 260,919 | -705,087 | -215,310 | -63,991 | -20,612 | -13,466 | -4,485 |
| Hudson Bay | 1,260,903 | 7,037 | -1,253,867 | -62,229 | -31,724 | -13,313 | -5,748 | -3,373 |
| Baffin Bay Gulf of St. Lawrence | 1,688,530 | 11,153 | -1,677,377 | -654 | -6,326 | -6,857 | -3,283 | -2,753 |
| Barents Sea | 645,917 | 139,567 | -506,350 | 29,622 | 212 | 14,868 | -95 | -1,974 |
| Laptev Sea | 897,845 | 2,032 | -895,813 | -41,098 | -25,041 | -4,053 | -17 | -217 |
| Bering Sea | 697,324 | 0 | -697,324 | 0 | 0 | 0 | 0 | 0 |
| Baltic Sea | 15,337 | 0 | -15,337 | 0 | 0 | 0 | 0 | 0 |
| Sea of Okhotsk | 853,240 | 0 | -853,240 | 0 | 0 | 0 | 0 | 0 |
| Yellow Sea | 0 | 0 | 0 | 0 | 0 | 0 | 0 | 0 |
| Beaufort Sea | 1,070,445 | 722,391 | -348,054 | -30,543 | 4,457 | -11,800 | -5,098 | 5,997 |
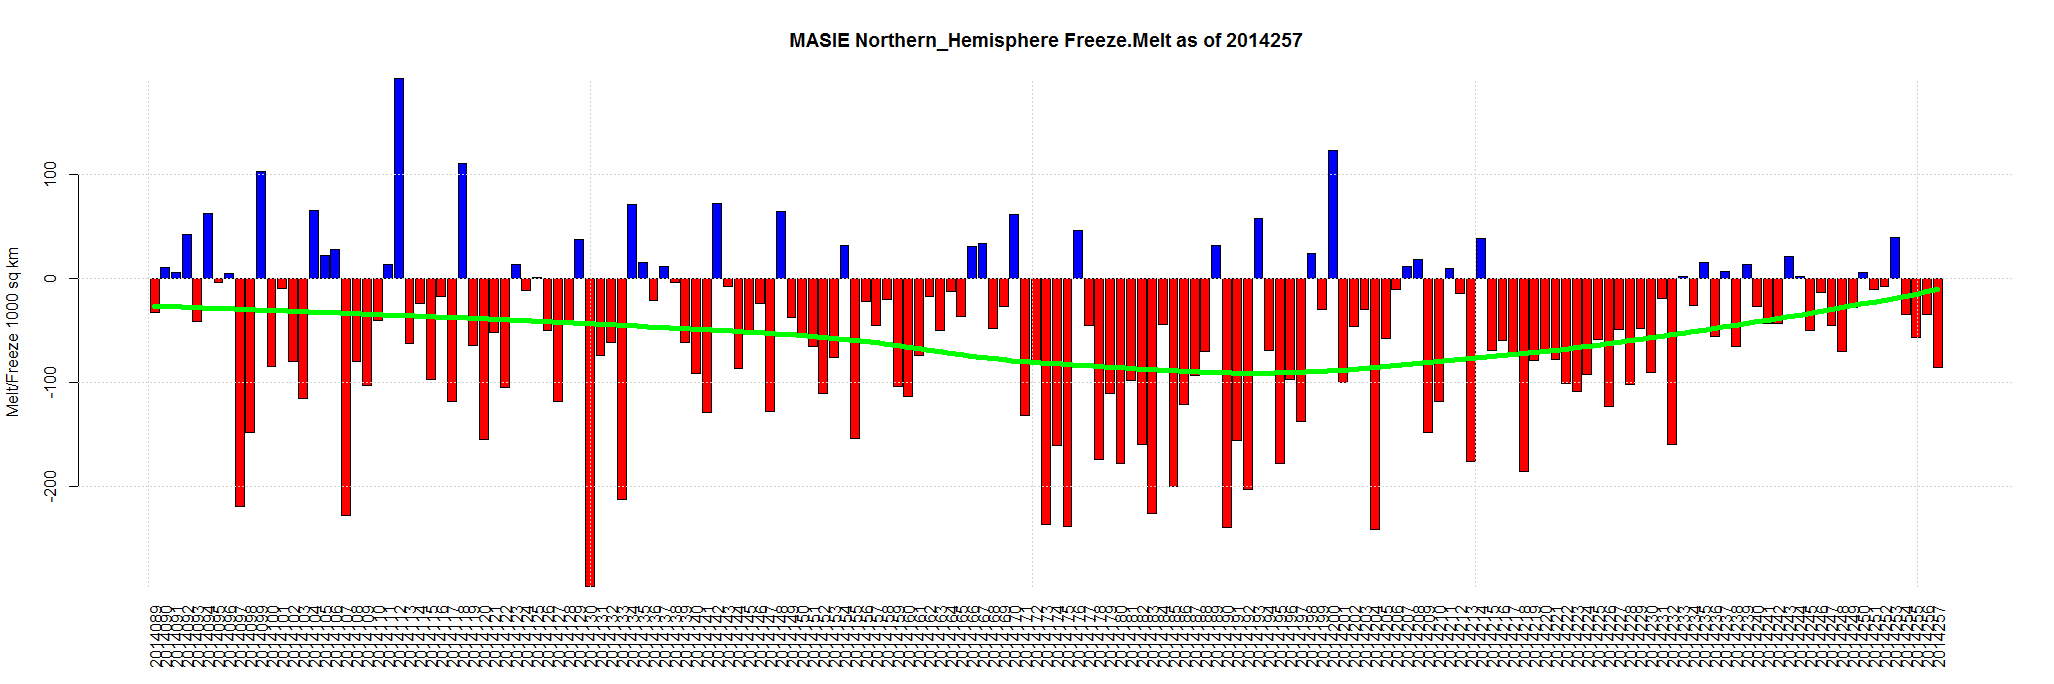
| Northern Hemisphere (Total) | 14,805,115 | 5,273,467 | -9,531,647 | -858,854 | -388,980 | -189,920 | -177,074 | -85,694 |
| NH (Average Loss per Day) | -56,069 | -30,673 | -27,784 | -27,131 | -59,025 | -85,694 |
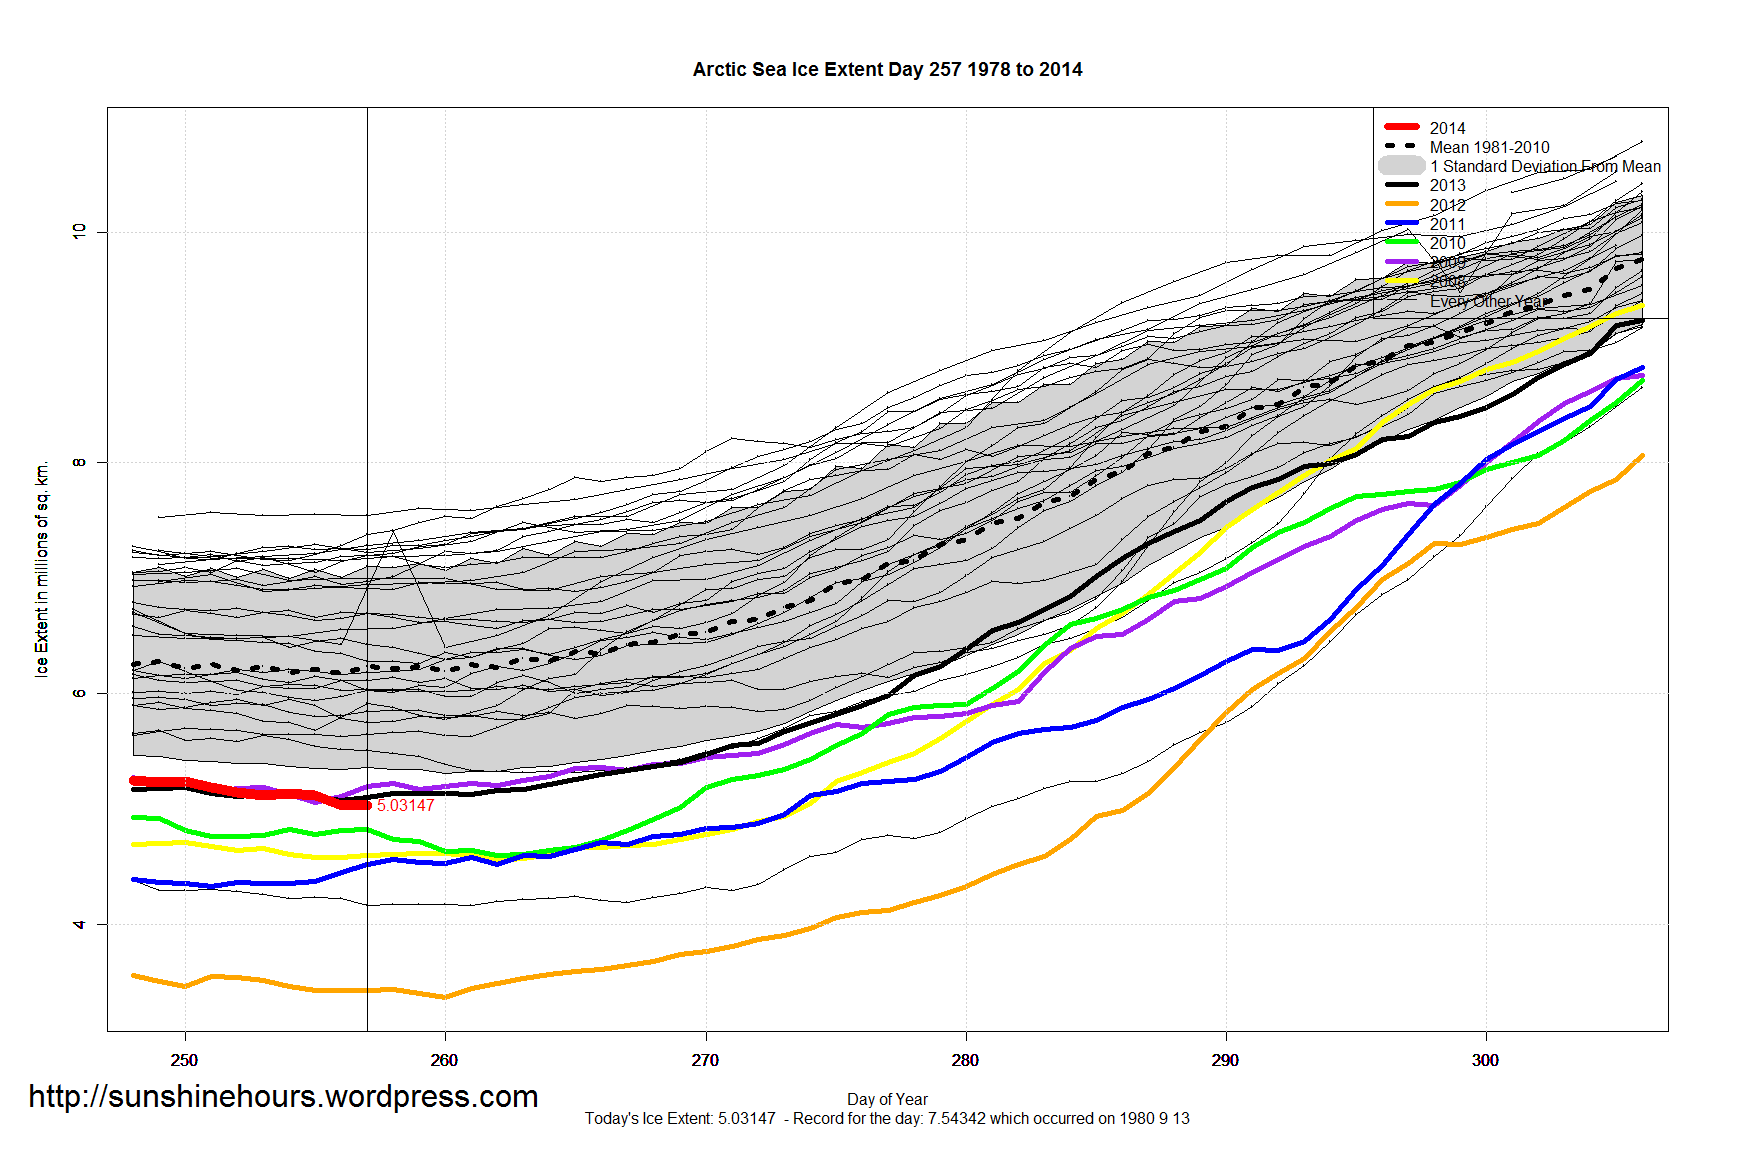
Arctic Sea Ice Extent Sep 15 2014 – -1,202,000 sq km below the 1981-2010 mean. Data for Day 257. Data here.
A 1,610 sq km Rise.

Update: An all-time record was set the next day
I usually graph Sea Ice Extent. Every once in a while I graph Sea Ice Area.
“A simplified way to think of extent versus area is to imagine a slice of swiss cheese. Extent would be a measure of the edges of the slice of cheese and all of the space inside it. Area would be the measure of where there is cheese only, not including the holes. That is why if you compare extent and area in the same time period, extent is always bigger.”
http://nsidc.org/arcticseaicenews/faq/#area_extent
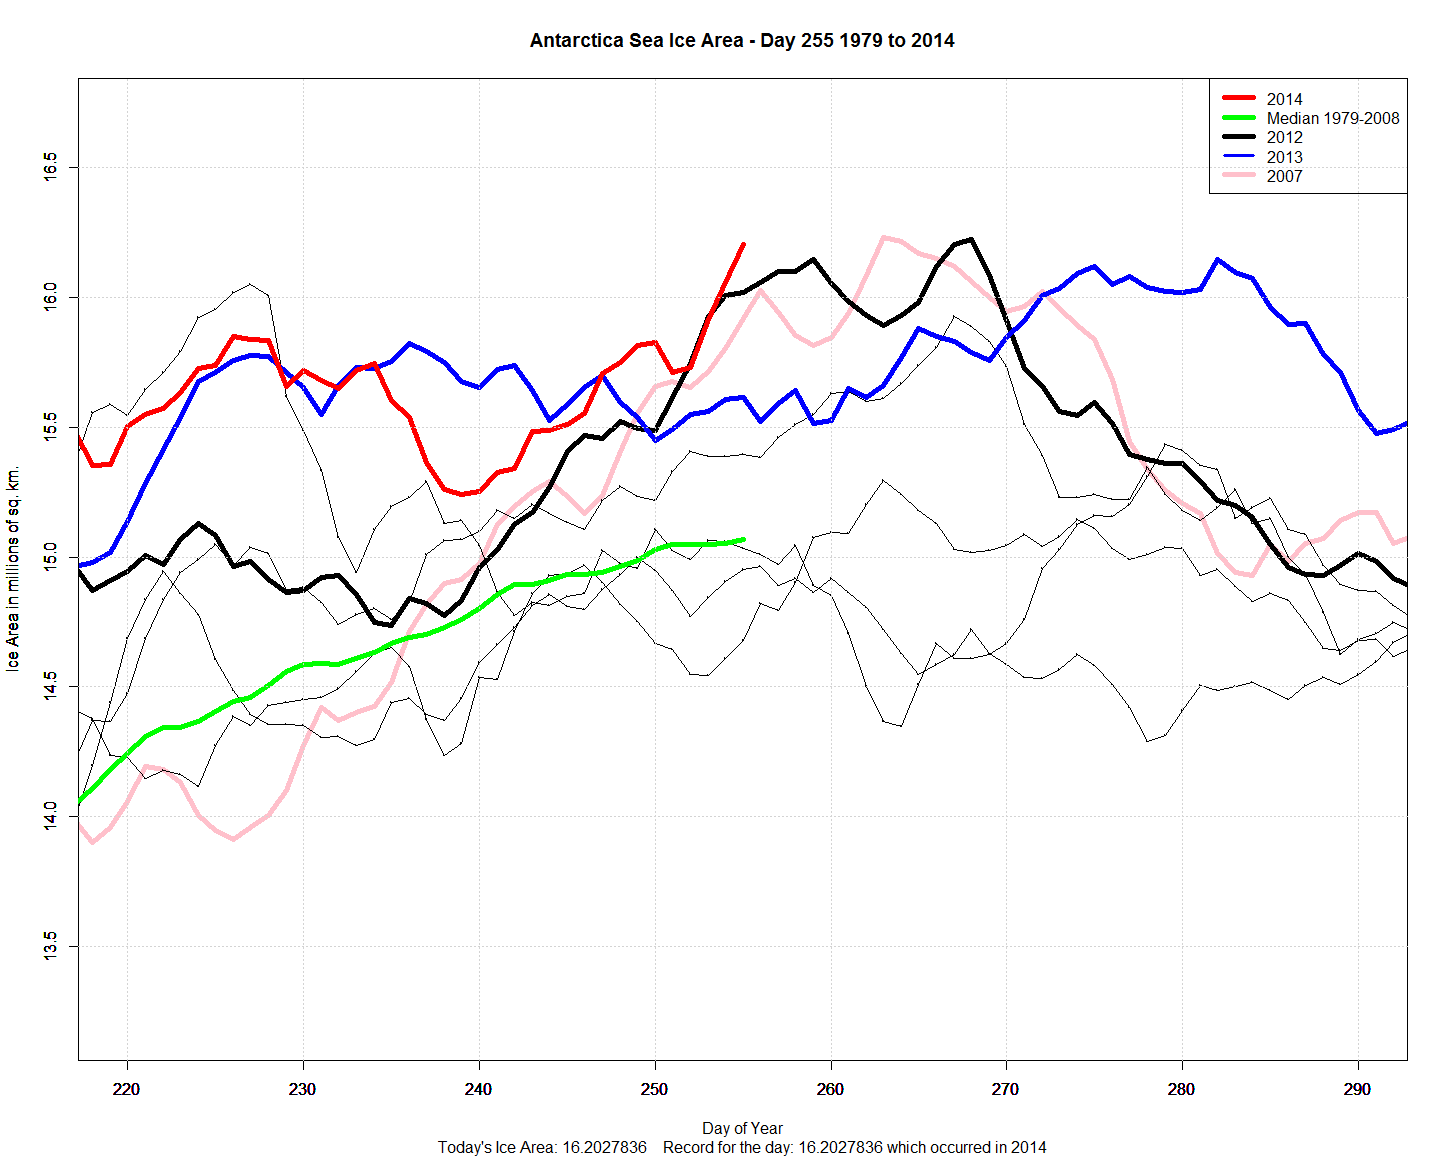
Antarctic Sea Ice Area is within 29,600 sq km of an all time record (which occurred in 2007 at 16.23238 million sq km).
Day 255 is 5th behind 2 days in 2007 and 2 days in 2012.
Chris Beal reminded me.
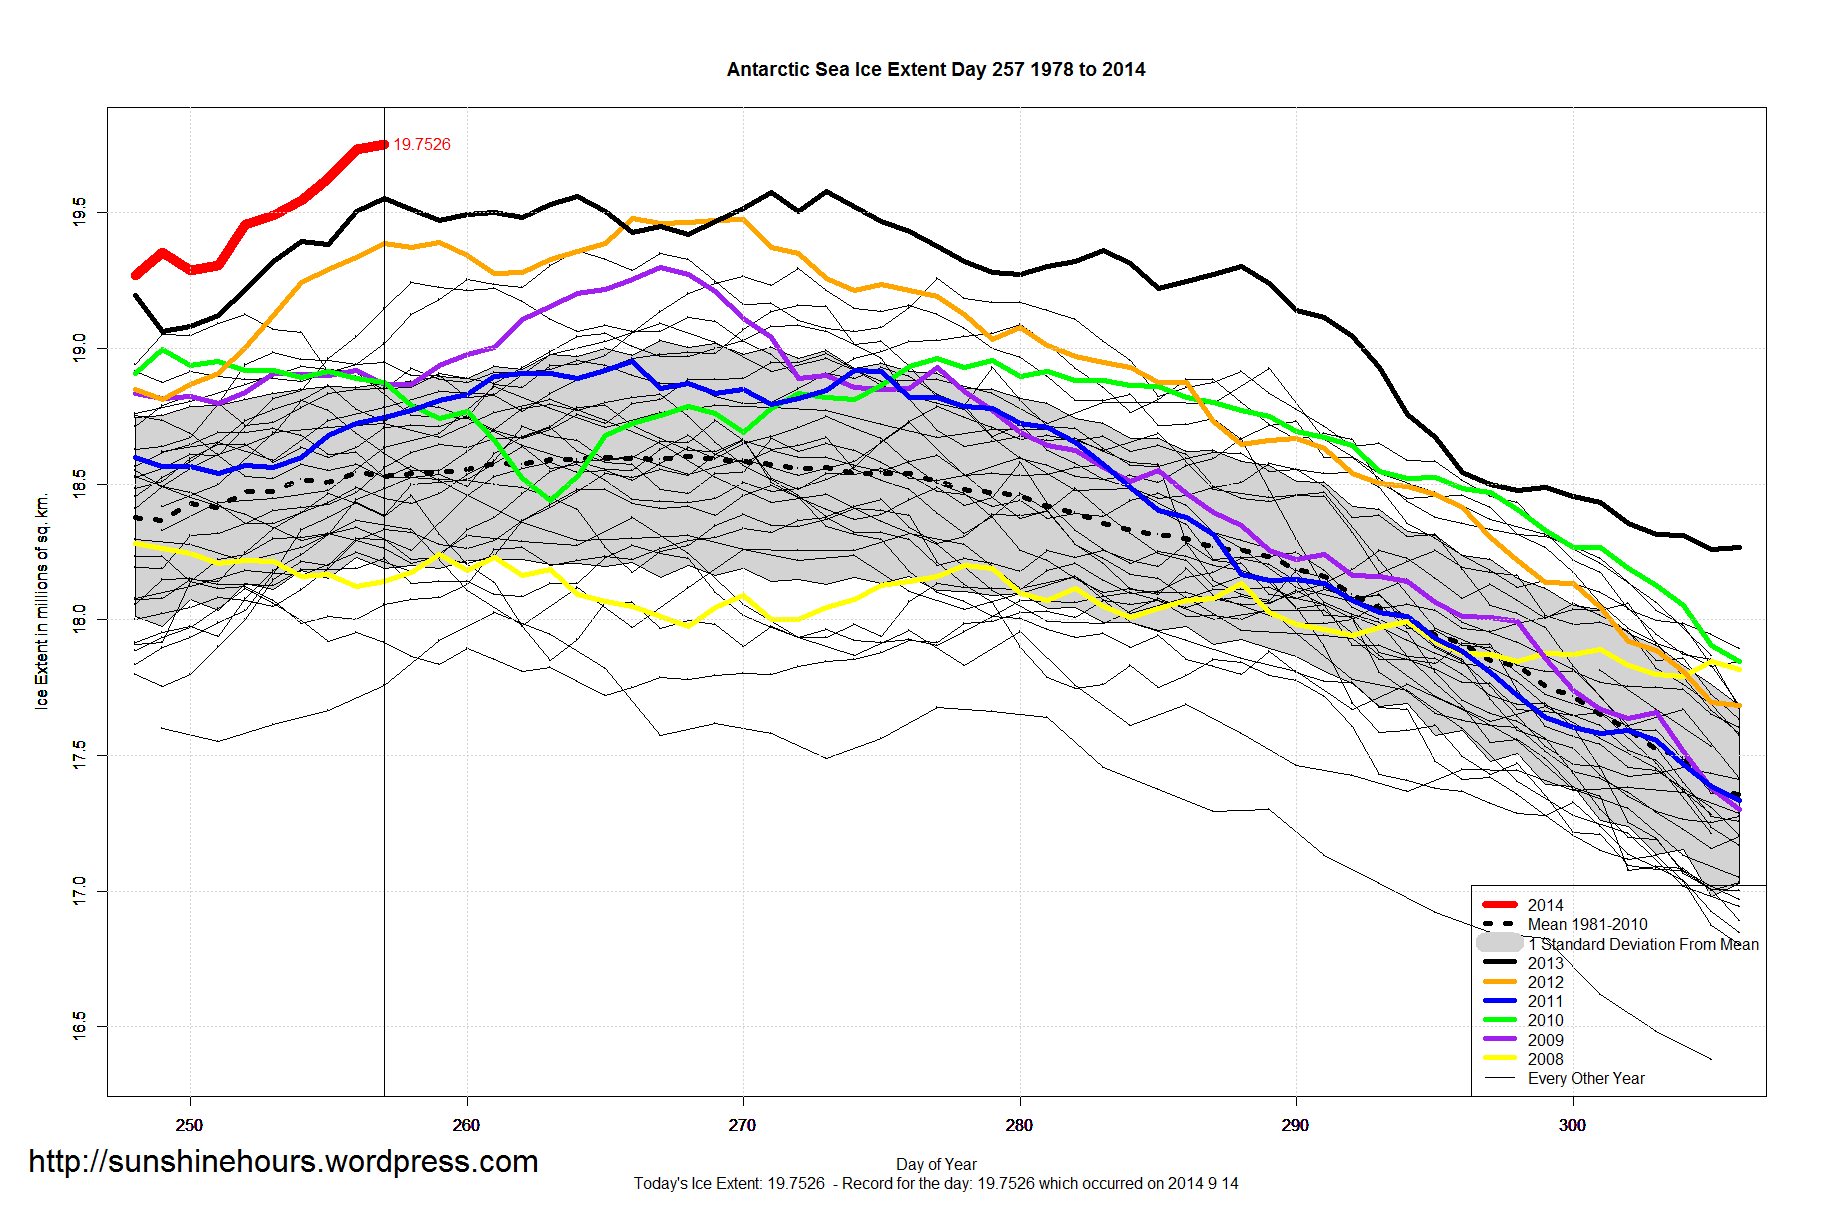
Antarctic Sea Ice Extent Sept 15 2014 – 1,224,000 sq km above the 1981-2010 mean. Data for Day 257. Data here.
18,000 sq km higher than yesterdays record. And 170,000 sq km higher than 2013’s all-time record.

Arctic Sea Ice Extent Sept 14 2014 – -1,144,000 sq km below the 1981-2010 mean. Data for Day 256. Data here.


