According to the UK Met Office 2015 was the 9th highest (since 1929) for sunshine.
Approximate 100 hours higher than the 1981-2010 average.
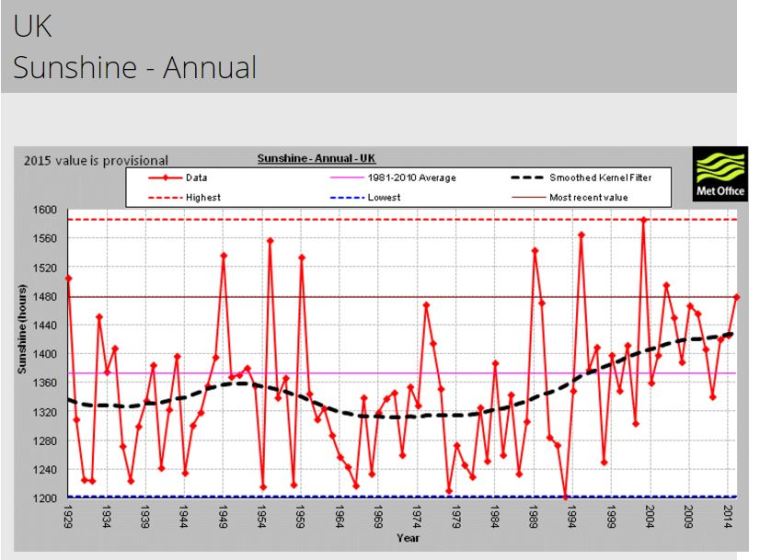
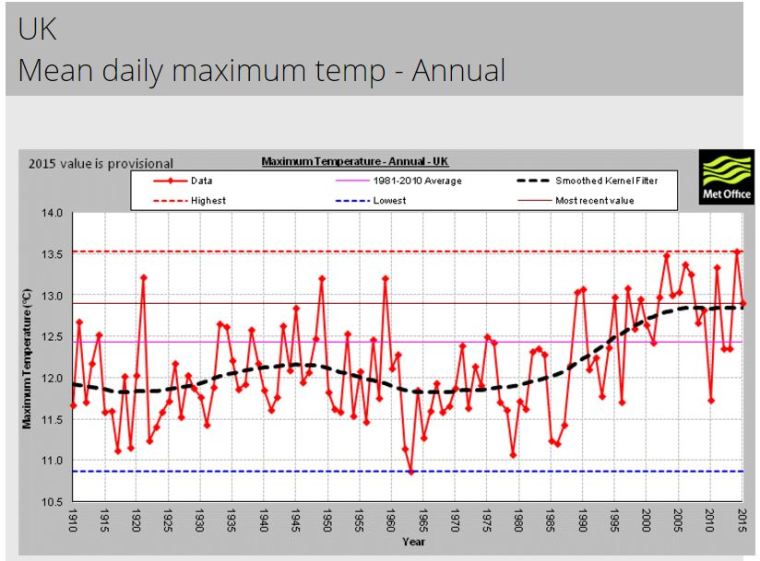
UK Max temperature graph looks similar to the sunshine graph.
According to the UK Met Office 2015 was the 9th highest (since 1929) for sunshine.
Approximate 100 hours higher than the 1981-2010 average.
UK Max temperature graph looks similar to the sunshine graph.
