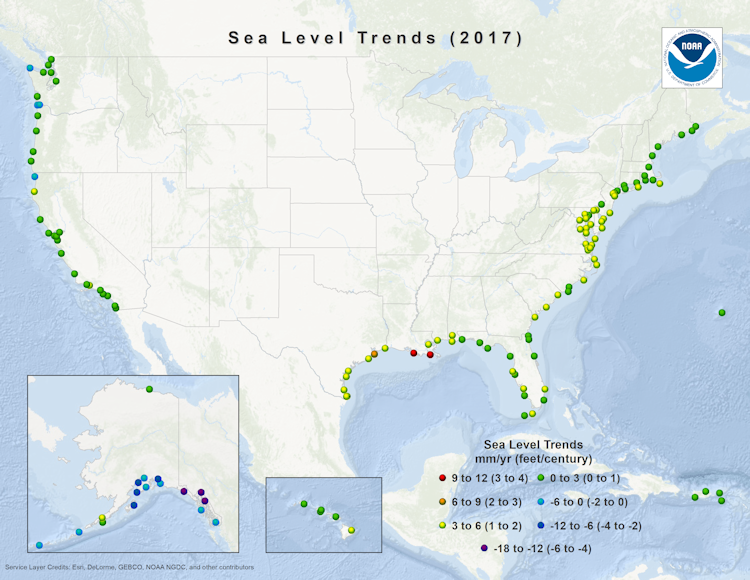
The NOAA has updated its tide gauge data for 2018 and says theaverage global sea level rise rate is 1.7-1.8 mm/yr.
Thats a measly 5.6 inches by 2100.
The map of relative sea level trends provides an overview of variations in the rates of local sea level change at long-term tide stations (based on a minimum of 30 years of data in order to account for long-term sea level variations and reduce errors in computing sea level trends based on monthly mean sea level).
The variations in sea level trends seen here primarily reflect differences in rates and sources of vertical land motion.
Areas experiencing little-to-no change in relative sea level are illustrated in green, including stations consistent with average global sea level rise rate of 1.7-1.8 mm/yr. These are stations not experiencing significant vertical land motion.
Stations illustrated with positive sea level trends (yellow-to-red) are experiencing both global sea level rise, and lowering or sinking of the local land, causing an apparently exaggerated rate of relative sea level rise.
Stations illustrated with negative trends (blue-to-purple) are experiencing global sea level rise and a greater vertical rise in the local land, causing an apparent decrease in relative sea level. These rates of relative sea level rise reflect actual observations and must be accounted for in any coastal planning or engineering applications.


Quick! Someone tell Obama that his vaunted NOAA experts just slammed his latest uninformed fear – mongering in Canada about sea level rising to inundate coastal cities. Doubt he’ll change his tune, though.