NOAA: average global sea level rise rate of 1.7-1.8 mm/yr

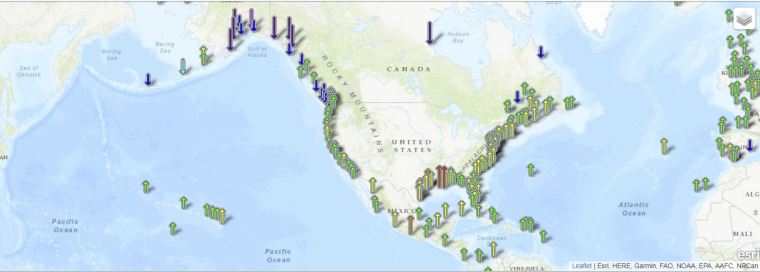
The NOAA has updated its tide gauge data for 2018 and says theaverage global sea level rise rate is 1.7-1.8 mm/yr.

Thats a measly 5.6 inches by 2100. 

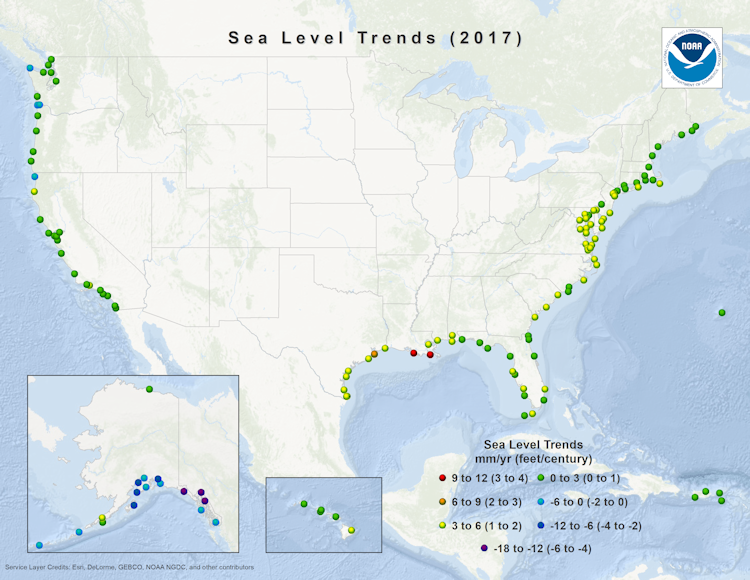
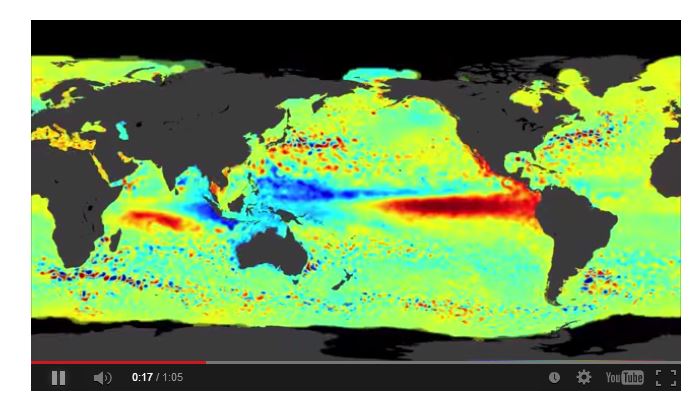
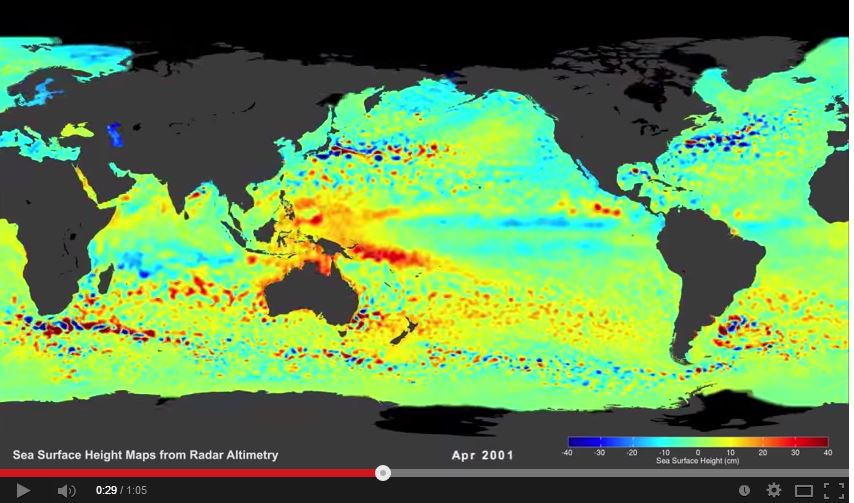
The map of relative sea level trends provides an overview of variations in the rates of local sea level change at long-term tide stations (based on a minimum of 30 years of data in order to account for long-term sea level variations and reduce errors in computing sea level trends based on monthly mean sea level).

The variations in sea level trends seen here primarily reflect differences in rates and sources of vertical land motion.

Areas experiencing little-to-no change in relative sea level are illustrated in green, including stations consistent with average global sea level rise rate of 1.7-1.8 mm/yr. These are stations not experiencing significant vertical land motion.

Stations illustrated with positive sea level trends (yellow-to-red) are experiencing both global sea level rise, and lowering or sinking of the local land, causing an apparently exaggerated rate of relative sea level rise.

Stations illustrated with negative trends (blue-to-purple) are experiencing global sea level rise and a greater vertical rise in the local land, causing an apparent decrease in relative sea level. These rates of relative sea level rise reflect actual observations and must be accounted for in any coastal planning or engineering applications.

Static U.S. Sea Level Trends Map


150 Years of Sea Level Rise in Germany

Facts are stubborn things.

The Wismar, Germany, record is one of the longest and most complete records of sea level rise in the world. It not only shows a long-term trend of 1.4 mm/year, but it shows no change in that trend (no acceleration over the past 50 years) since carbon dioxide levels have gone from 325 to 400 parts per million.

wismar

Sea Level Bulge May Just Be Vortices Bumping Into Indonesia

Have you ever wondered about the big bulge in sea level trend to the north of Australia and east of Indonesia.

Sea Level is barely rising elsewhere.

colorado_sea_level_Jun_30_2014


Well … it may be that the big bulge is just newly discovered giant vortices bumping into Indonesia.

Story here. Video here.

“Enormous vortices of water, measuring 60 miles across, spin their way across the sea at a deliberate pace—3 miles per day. Oceanographers have dubbed them mesoscale eddies for their middle size, larger than a wake formed by an aircraft carrier and smaller than a gyre. Each one is like an upside down mountain of water, held together by its own rotation and extending about 3,000 feet beneath the surface. In the video above, eddies show up as red and blue dots dancing around. (Red ones spin clockwise, blue ones counterclockwise.) Just how much water gets carried around by all these eddies? The total is staggering: more than 30 times the amount dumped by all the world’s rivers into the ocean, “

sea_level_vortice_2