Arctic Sea Ice Extent Sept 14 2014 – -1,144,000 sq km below the 1981-2010 mean. Data for Day 256. Data here.


Arctic Sea Ice Extent Sept 14 2014 – -1,144,000 sq km below the 1981-2010 mean. Data for Day 256. Data here.
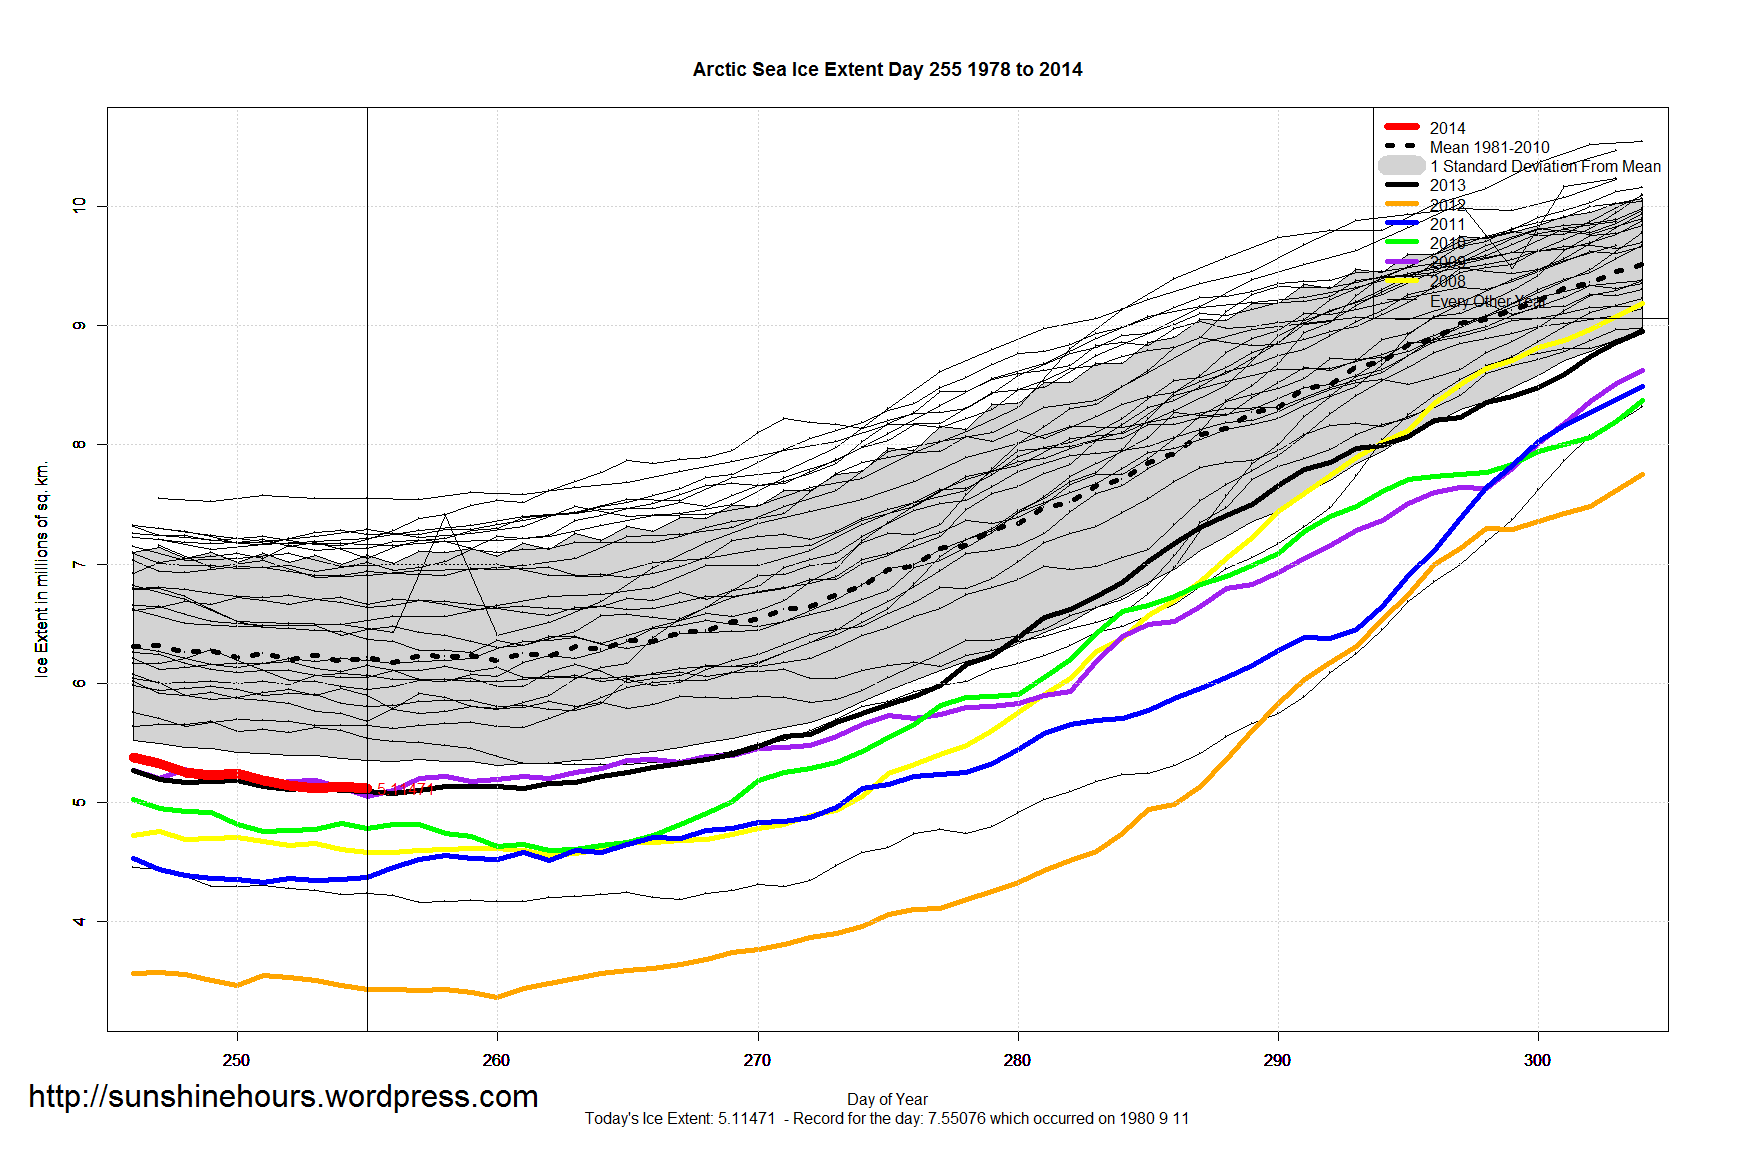
Arctic Sea Ice Extent Sep 13 2014 – -1,098,000 sq km below the 1981-2010 mean. Data for Day 255. Data here.
Day 255 is a new minimum at 5.11471 million sq km – 4800 sq km lower than day 253. (Day 254 was 20,000 sq km higher than day 253)

Arctic Sea Ice Extent Sep 12 2014 – -1,048,000 sq km below the 1981-2010 mean. Data for Day 254. Data here.
Day 253 is potentially the minimum for 2014.


Arctic Sea Ice Extent Sep 11 2014 – -1,117,000 sq km below the 1981-2010 mean. Data for Day 253. Data here.


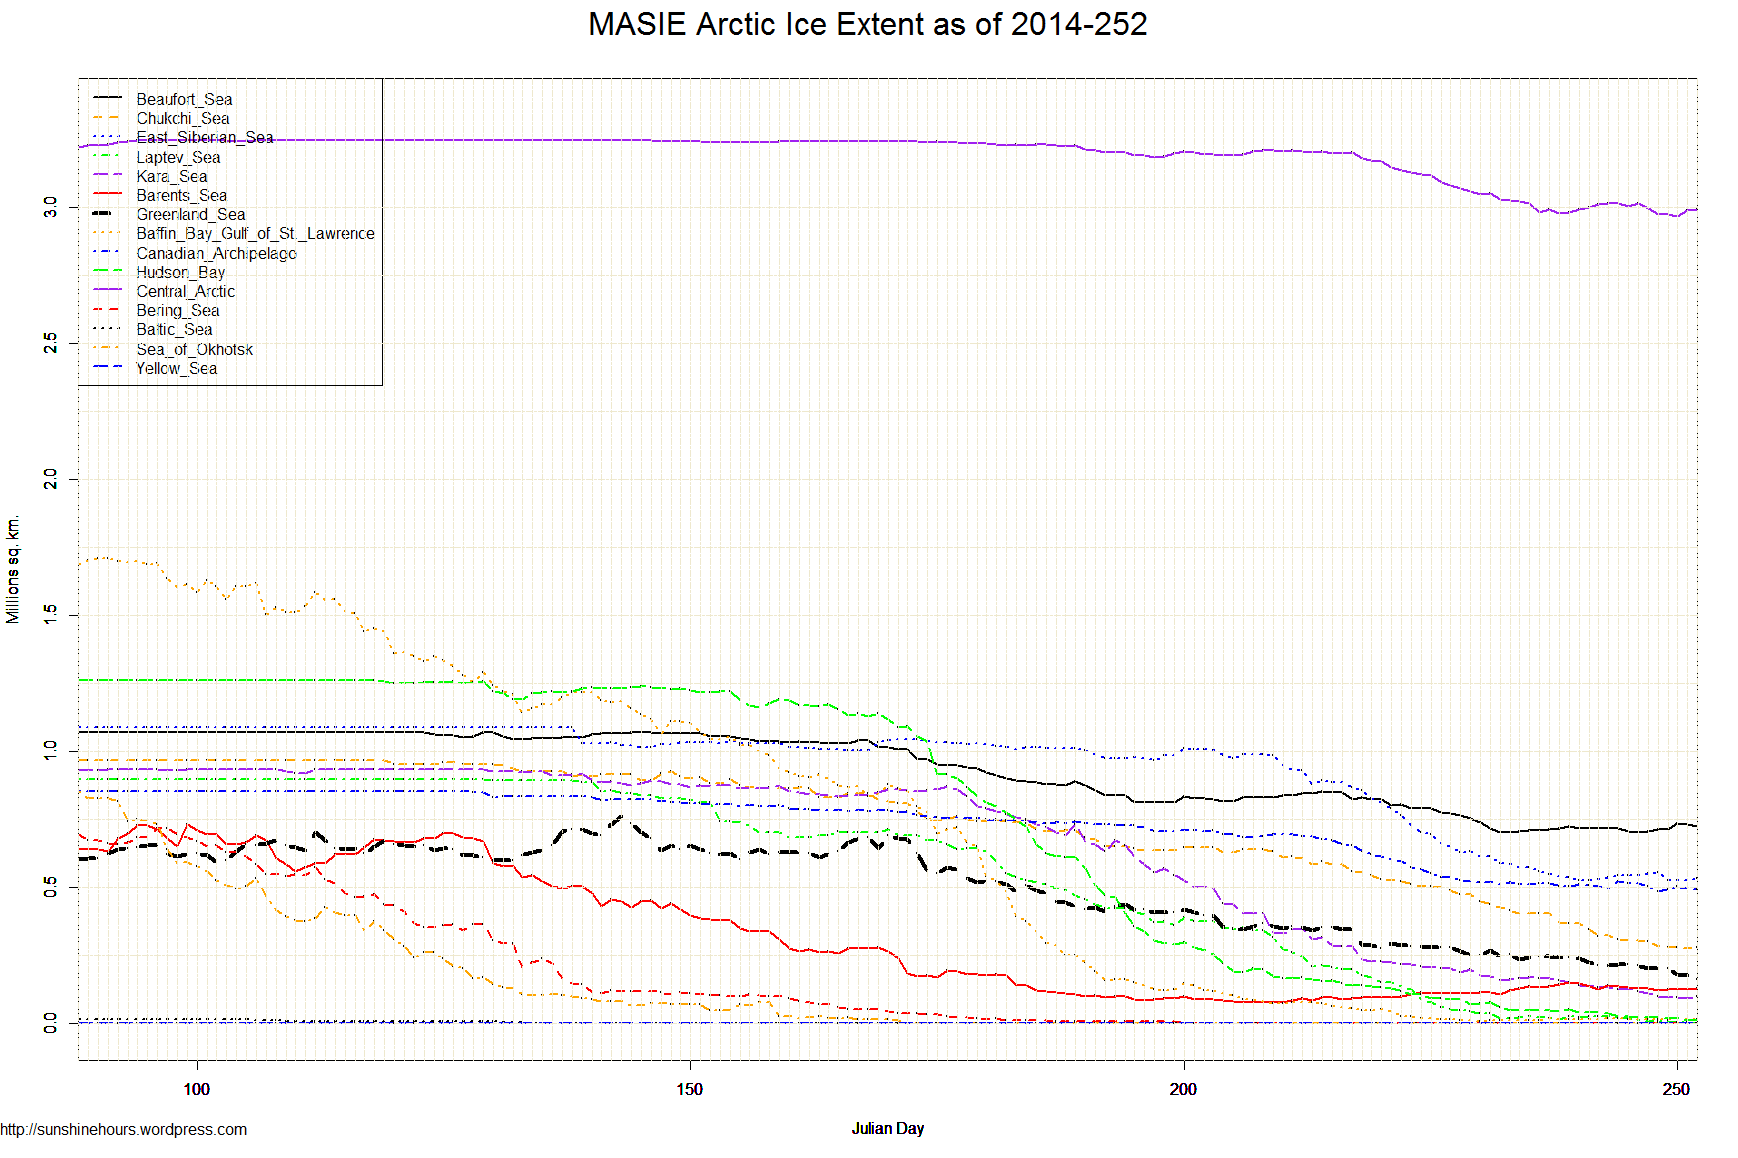
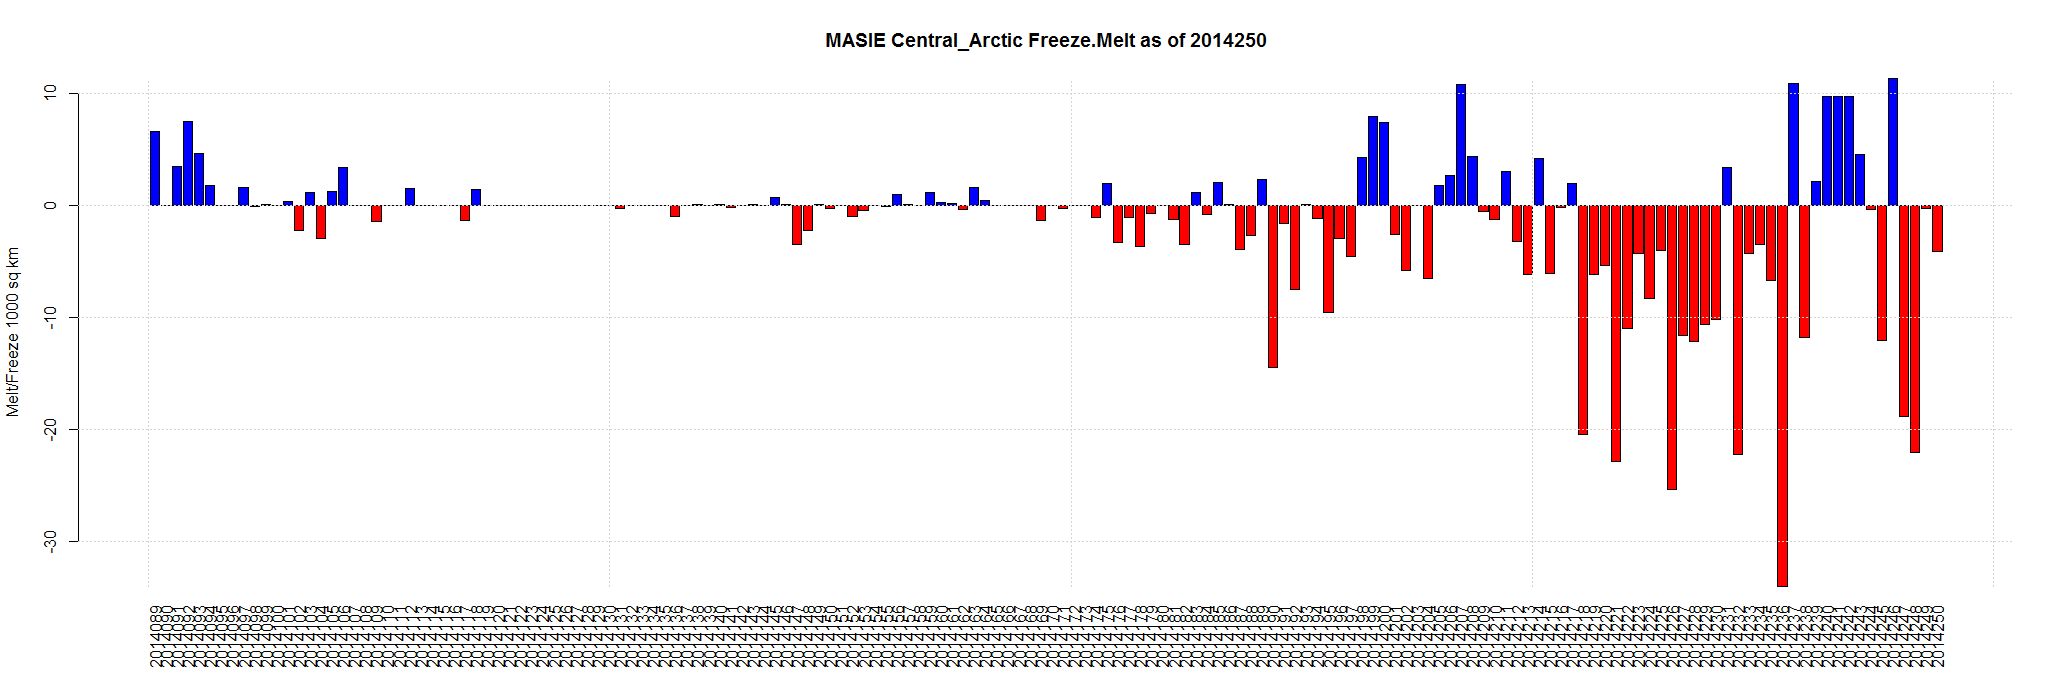
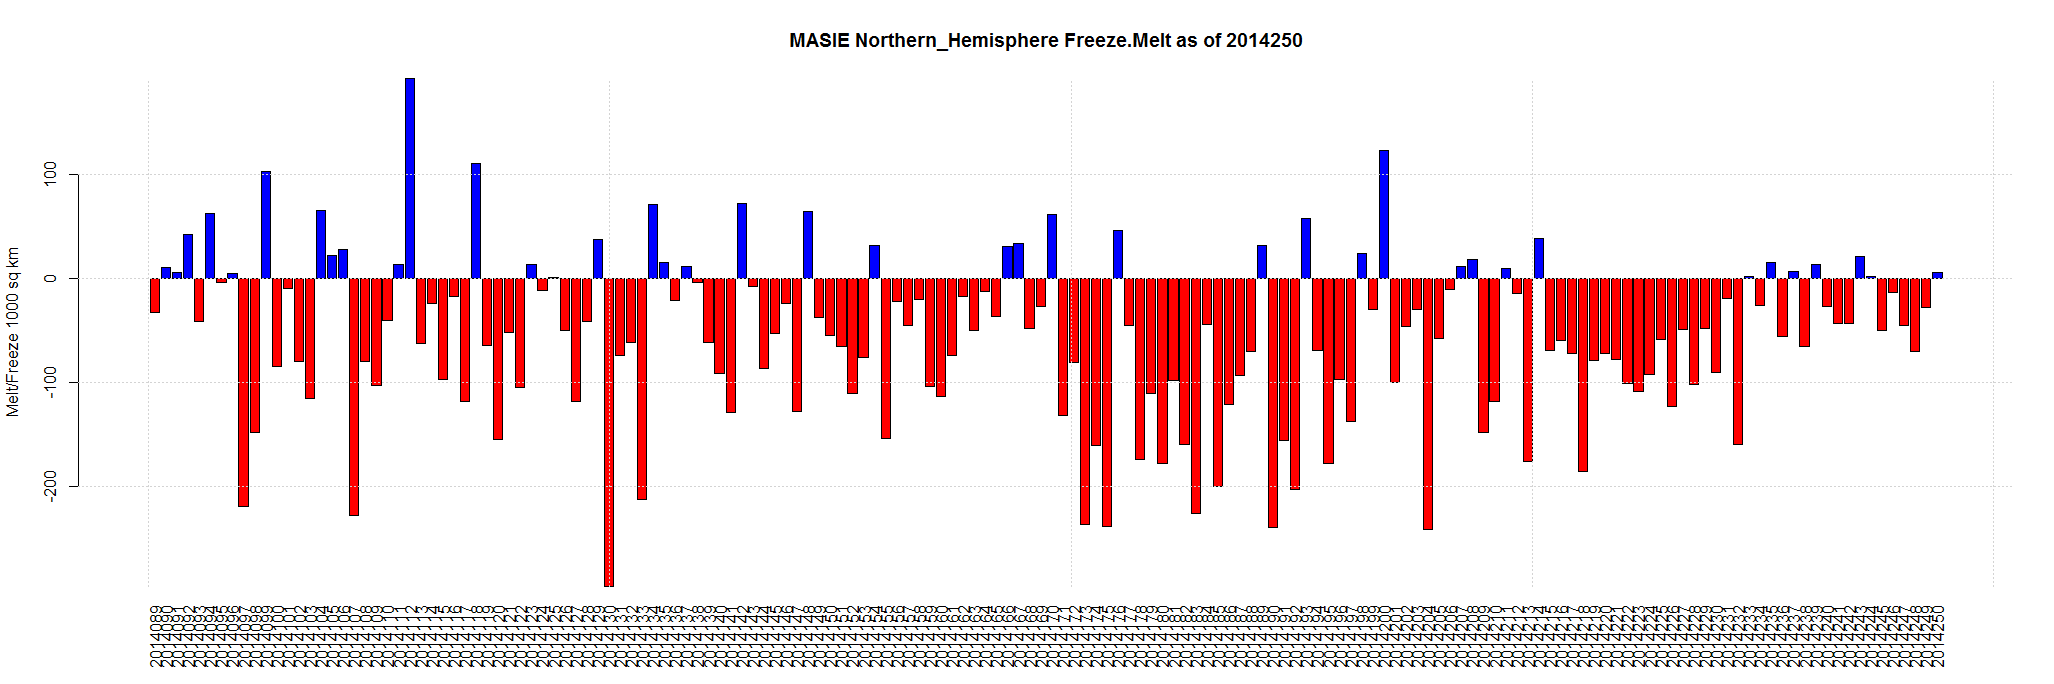
I only have 166 days of MASIE data. These two graphs are NSIDC and MASIE for the same period.
Minimum is close.


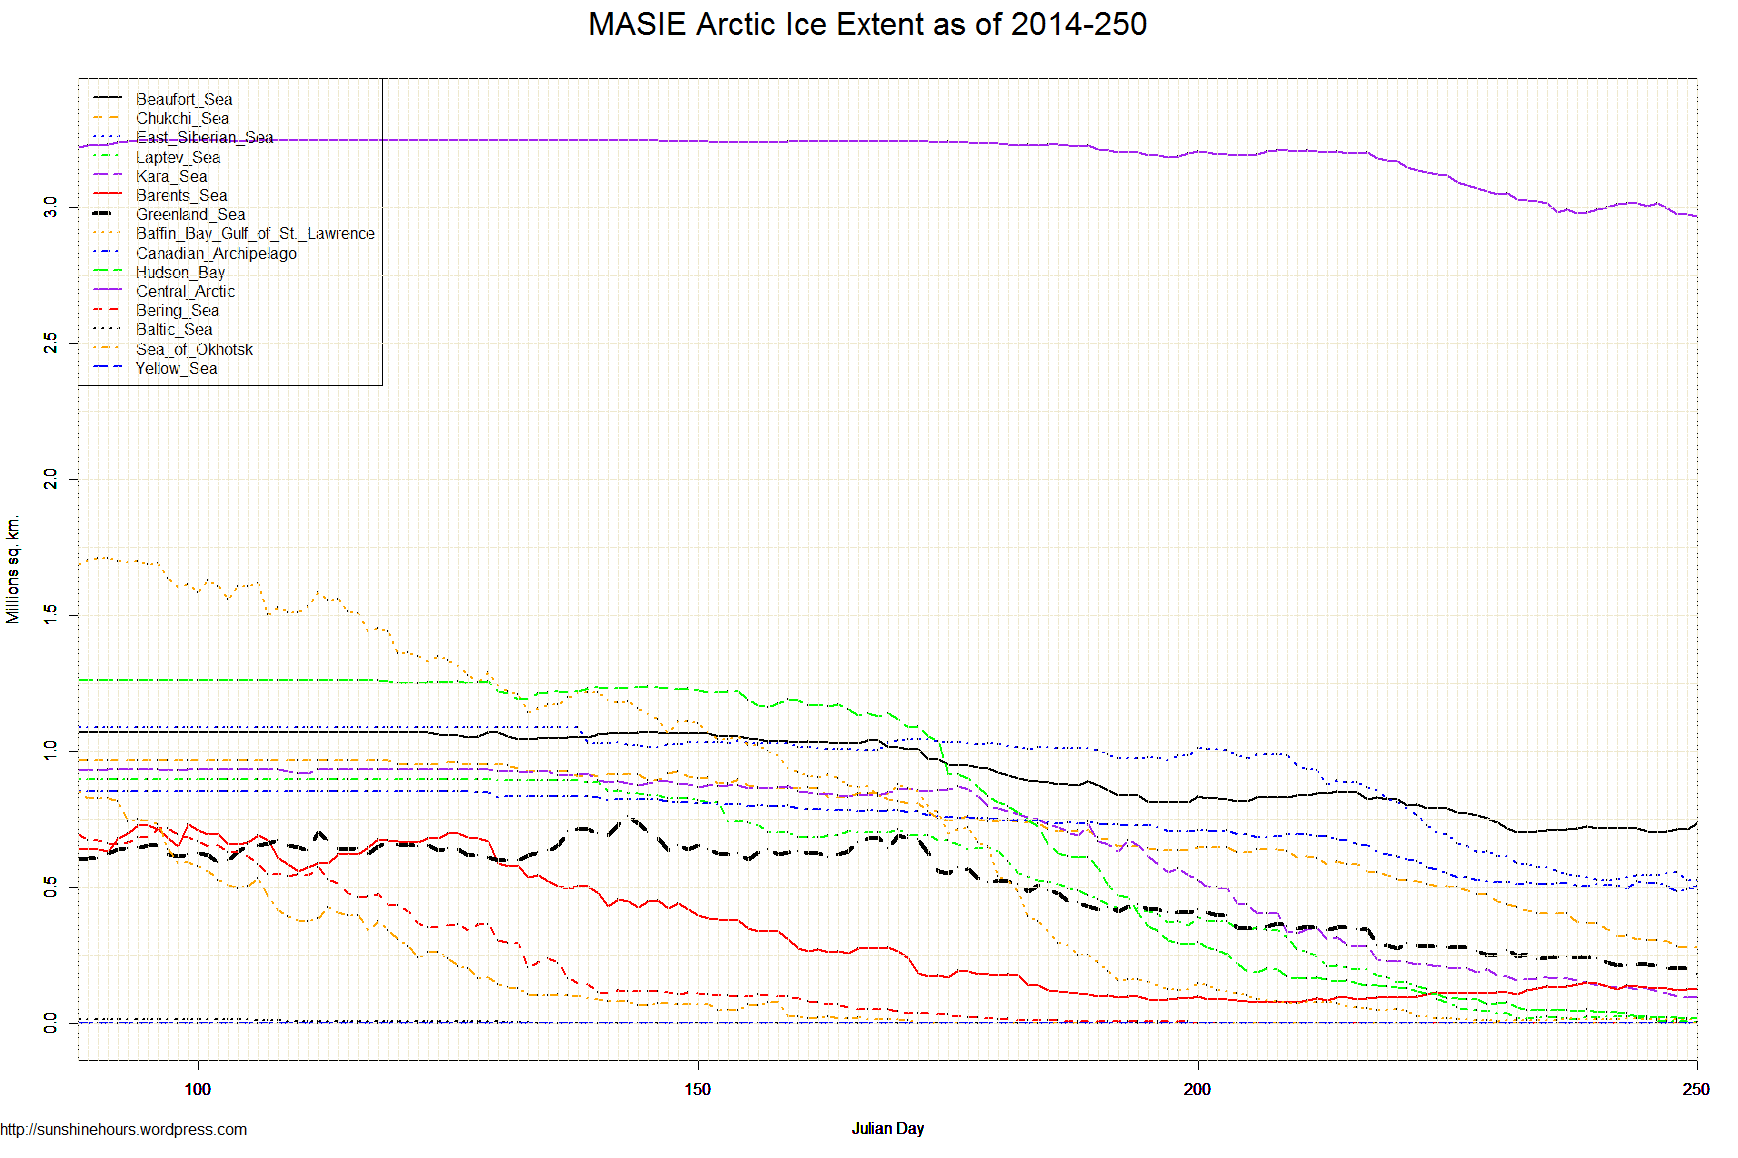
Sept 10 2014 MASIE Update – Tiny Changes
Data here. Click for bigger.
| Region | 165 days ago | End | Last 164 | Last 28 | Last 14 | Last 7 | Last 3 | Last 1 |
| Greenland Sea | 603,416 | 162,018 | -441,397 | -120,946 | -81,417 | -54,501 | -39,440 | -14,866 |
| Beaufort Sea | 1,070,445 | 726,746 | -343,699 | -62,719 | 9,384 | 19,833 | 11,948 | -5,306 |
| Laptev Sea | 897,845 | 2,411 | -895,434 | -87,910 | -12,750 | -15,057 | -4,000 | -3,145 |
| Canadian Archipelago | 853,214 | 495,091 | -358,123 | -70,948 | -9,063 | -19,862 | 1,066 | -2,867 |
| Hudson Bay | 1,260,903 | 11,503 | -1,249,401 | -95,643 | -33,774 | -16,122 | -9,270 | 0 |
| Bering Sea | 697,324 | 0 | -697,324 | 0 | 0 | 0 | 0 | 0 |
| Baltic Sea | 15,337 | 0 | -15,337 | 0 | 0 | 0 | 0 | 0 |
| Sea of Okhotsk | 853,240 | 0 | -853,240 | 0 | 0 | 0 | 0 | 0 |
| Yellow Sea | 0 | 0 | 0 | 0 | 0 | 0 | 0 | 0 |
| Baffin Bay Gulf of St. Lawrence | 1,688,530 | 14,436 | -1,674,094 | -6,488 | -2,478 | -311 | -1,820 | 21 |
| Central Arctic | 3,221,921 | 2,991,516 | -230,406 | -130,612 | 11,927 | -11,337 | 18,578 | 1,593 |
| Chukchi Sea | 966,006 | 279,621 | -686,385 | -225,800 | -94,086 | -25,880 | -1,513 | 2,045 |
| Barents Sea | 645,917 | 130,065 | -515,852 | 16,633 | -13,591 | -4,555 | 3,968 | 2,932 |
| Kara Sea | 933,859 | 98,293 | -835,566 | -113,221 | -60,184 | -30,611 | 1,083 | 5,243 |
| East Siberian Sea | 1,087,137 | 532,439 | -554,698 | -171,482 | -8,728 | -11,118 | 7,029 | 6,288 |
| Northern Hemisphere (Total) | 14,805,115 | 5,445,009 | -9,360,105 | -1,069,407 | -295,031 | -169,795 | -12,644 | -7,864 |
| NH (Average Loss per Day) | -56,728 | -38,193 | -21,074 | -24,256 | -4,215 | -7,864 |
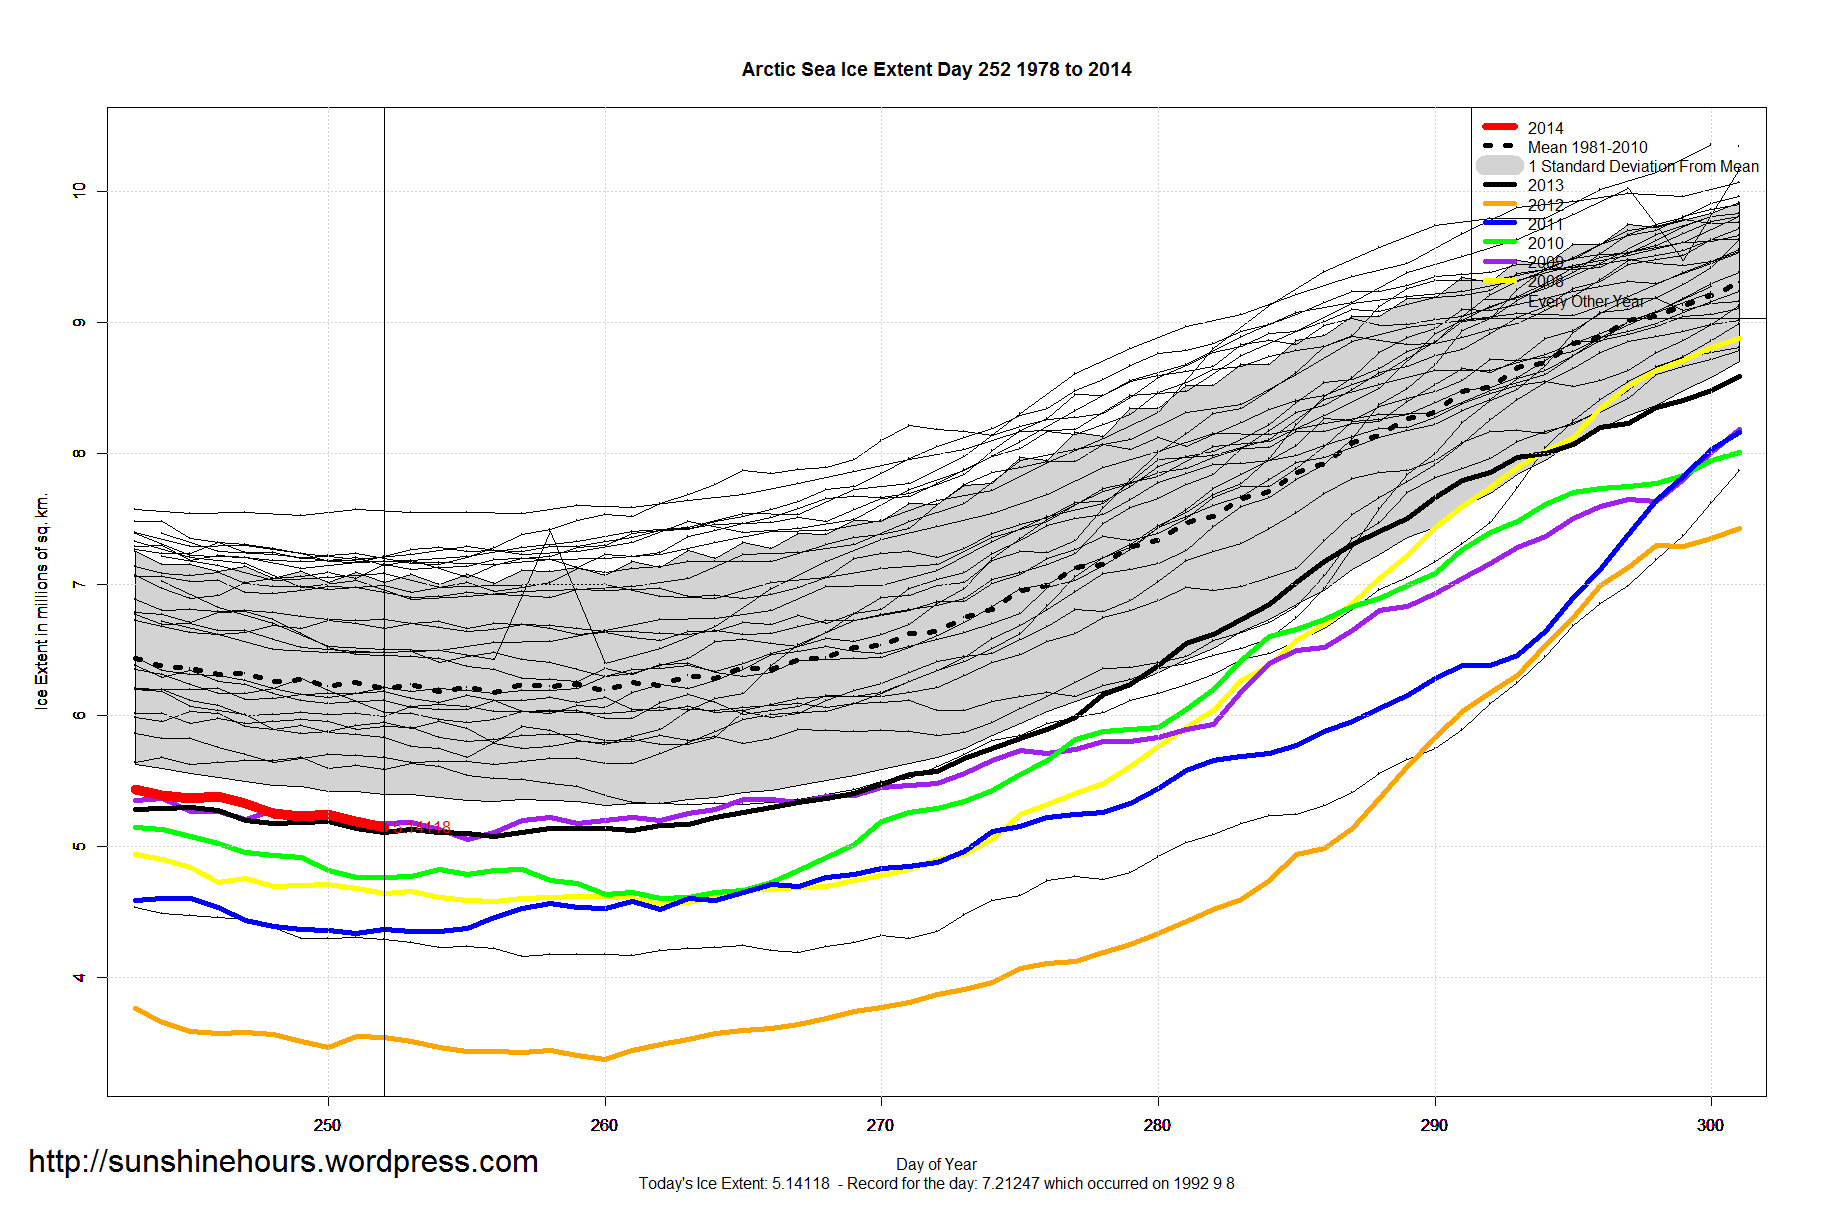
Arctic Sea Ice Extent Sept 10 2014 – -1,062,000 sq km below the 1981-2010 mean. Data for Day 252. Data here.

Sept 9 2014 MASIE Update – Tiny Gain – Central Arctic Losses Shrink
Data here. Click for bigger.


| Region | 164 days ago | End | Last 163 | Last 28 | Last 14 | Last 7 | Last 3 | Last 1 |
| Hudson Bay | 1,260,903 | 11,503 | -1,249,401 | -95,692 | -38,235 | -15,934 | -12,048 | -8,847 |
| Canadian Archipelago | 853,214 | 497,958 | -355,256 | -76,552 | -15,992 | -24,983 | 10,821 | -5,817 |
| Greenland Sea | 603,416 | 176,884 | -426,531 | -107,827 | -68,946 | -39,815 | -24,575 | -4,166 |
| Chukchi Sea | 966,006 | 277,576 | -688,430 | -233,955 | -127,985 | -33,205 | -6,625 | -3,955 |
| Baffin Bay Gulf of St. Lawrence | 1,688,530 | 14,415 | -1,674,115 | -10,961 | -3,007 | -3,805 | -736 | -3,595 |
| Kara Sea | 933,859 | 93,050 | -840,809 | -125,545 | -71,504 | -33,588 | -8,074 | -3,166 |
| Beaufort Sea | 1,070,445 | 732,053 | -338,392 | -57,889 | 19,934 | 12,633 | 16,566 | -2,138 |
| East Siberian Sea | 1,087,137 | 526,151 | -560,986 | -203,109 | -20,576 | -18,785 | -29,432 | -1,390 |
| Laptev Sea | 897,845 | 5,557 | -892,288 | -120,778 | -14,166 | -18,412 | -854 | -528 |
| Bering Sea | 697,324 | 0 | -697,324 | 0 | 0 | 0 | 0 | 0 |
| Baltic Sea | 15,337 | 0 | -15,337 | 0 | 0 | 0 | 0 | 0 |
| Sea of Okhotsk | 853,240 | 0 | -853,240 | 0 | 0 | 0 | 0 | 0 |
| Yellow Sea | 0 | 0 | 0 | 0 | 0 | 0 | 0 | 0 |
| Barents Sea | 645,917 | 127,133 | -518,784 | 19,488 | -10,125 | -10,199 | 5,926 | 2,435 |
| Central Arctic | 3,221,921 | 2,989,922 | -231,999 | -140,522 | -1,478 | -25,007 | 16,690 | 21,122 |
| Northern Hemisphere (Total) | 14,805,115 | 5,452,873 | -9,352,242 | -1,153,814 | -352,551 | -211,571 | -32,813 | -10,515 |
| NH (Average Loss per Day) | -57,026 | -41,208 | -25,182 | -30,224 | -10,938 | -10,515 |
Arctic Sea Ice Extent Sep 09 2014 – -1,063,000 sq km below the 1981-2010 mean. Data for Day 251. Data here.


Sept 8 2014 MASIE Update – Tiny Gain – Central Arctic Losses Shrink
Data here. Click for bigger.
| Region | 163 days ago | End | Last 162 | Last 28 | Last 14 | Last 7 | Last 3 | Last 1 |
| Greenland Sea | 603,416 | 181,050 | -422,366 | -107,920 | -65,228 | -33,303 | -23,063 | -20,409 |
| Central Arctic | 3,221,921 | 2,968,800 | -253,121 | -165,937 | -11,731 | -46,477 | -26,501 | -4,137 |
| Barents Sea | 645,917 | 124,699 | -521,218 | 25,108 | -6,880 | -14,657 | -5,225 | -1,399 |
| Kara Sea | 933,859 | 96,216 | -837,644 | -120,965 | -70,240 | -35,190 | -15,204 | -994 |
| Hudson Bay | 1,260,903 | 20,349 | -1,240,554 | -96,437 | -29,389 | -18,411 | -1,684 | -424 |
| Laptev Sea | 897,845 | 6,084 | -891,760 | -131,835 | -15,339 | -20,988 | -3,444 | -326 |
| Bering Sea | 697,324 | 0 | -697,324 | 0 | 0 | 0 | 0 | 0 |
| Baltic Sea | 15,337 | 0 | -15,337 | 0 | 0 | 0 | 0 | 0 |
| Sea of Okhotsk | 853,240 | 0 | -853,240 | 0 | 0 | 0 | 0 | 0 |
| Yellow Sea | 0 | 0 | 0 | 0 | 0 | 0 | 0 | 0 |
| Chukchi Sea | 966,006 | 281,531 | -684,475 | -241,025 | -123,322 | -43,379 | -22,031 | 397 |
| Baffin Bay Gulf of St. Lawrence | 1,688,530 | 18,010 | -1,670,521 | -9,558 | 7,767 | 531 | 3,039 | 1,754 |
| East Siberian Sea | 1,087,137 | 527,541 | -559,596 | -239,256 | -32,520 | -11,800 | -25,367 | 2,131 |
| Canadian Archipelago | 853,214 | 503,775 | -349,439 | -92,054 | -11,719 | 8,357 | -471 | 9,751 |
| Beaufort Sea | 1,070,445 | 734,191 | -336,254 | -71,757 | 22,919 | 16,257 | 27,194 | 19,392 |
| Northern Hemisphere (Total) | 14,805,115 | 5,463,388 | -9,341,727 | -1,251,636 | -335,682 | -199,060 | -92,757 | 5,735 |
| NH (Average Loss per Day) | -57,311 | -44,701 | -23,977 | -28,437 | -30,919 | 5,735 |
