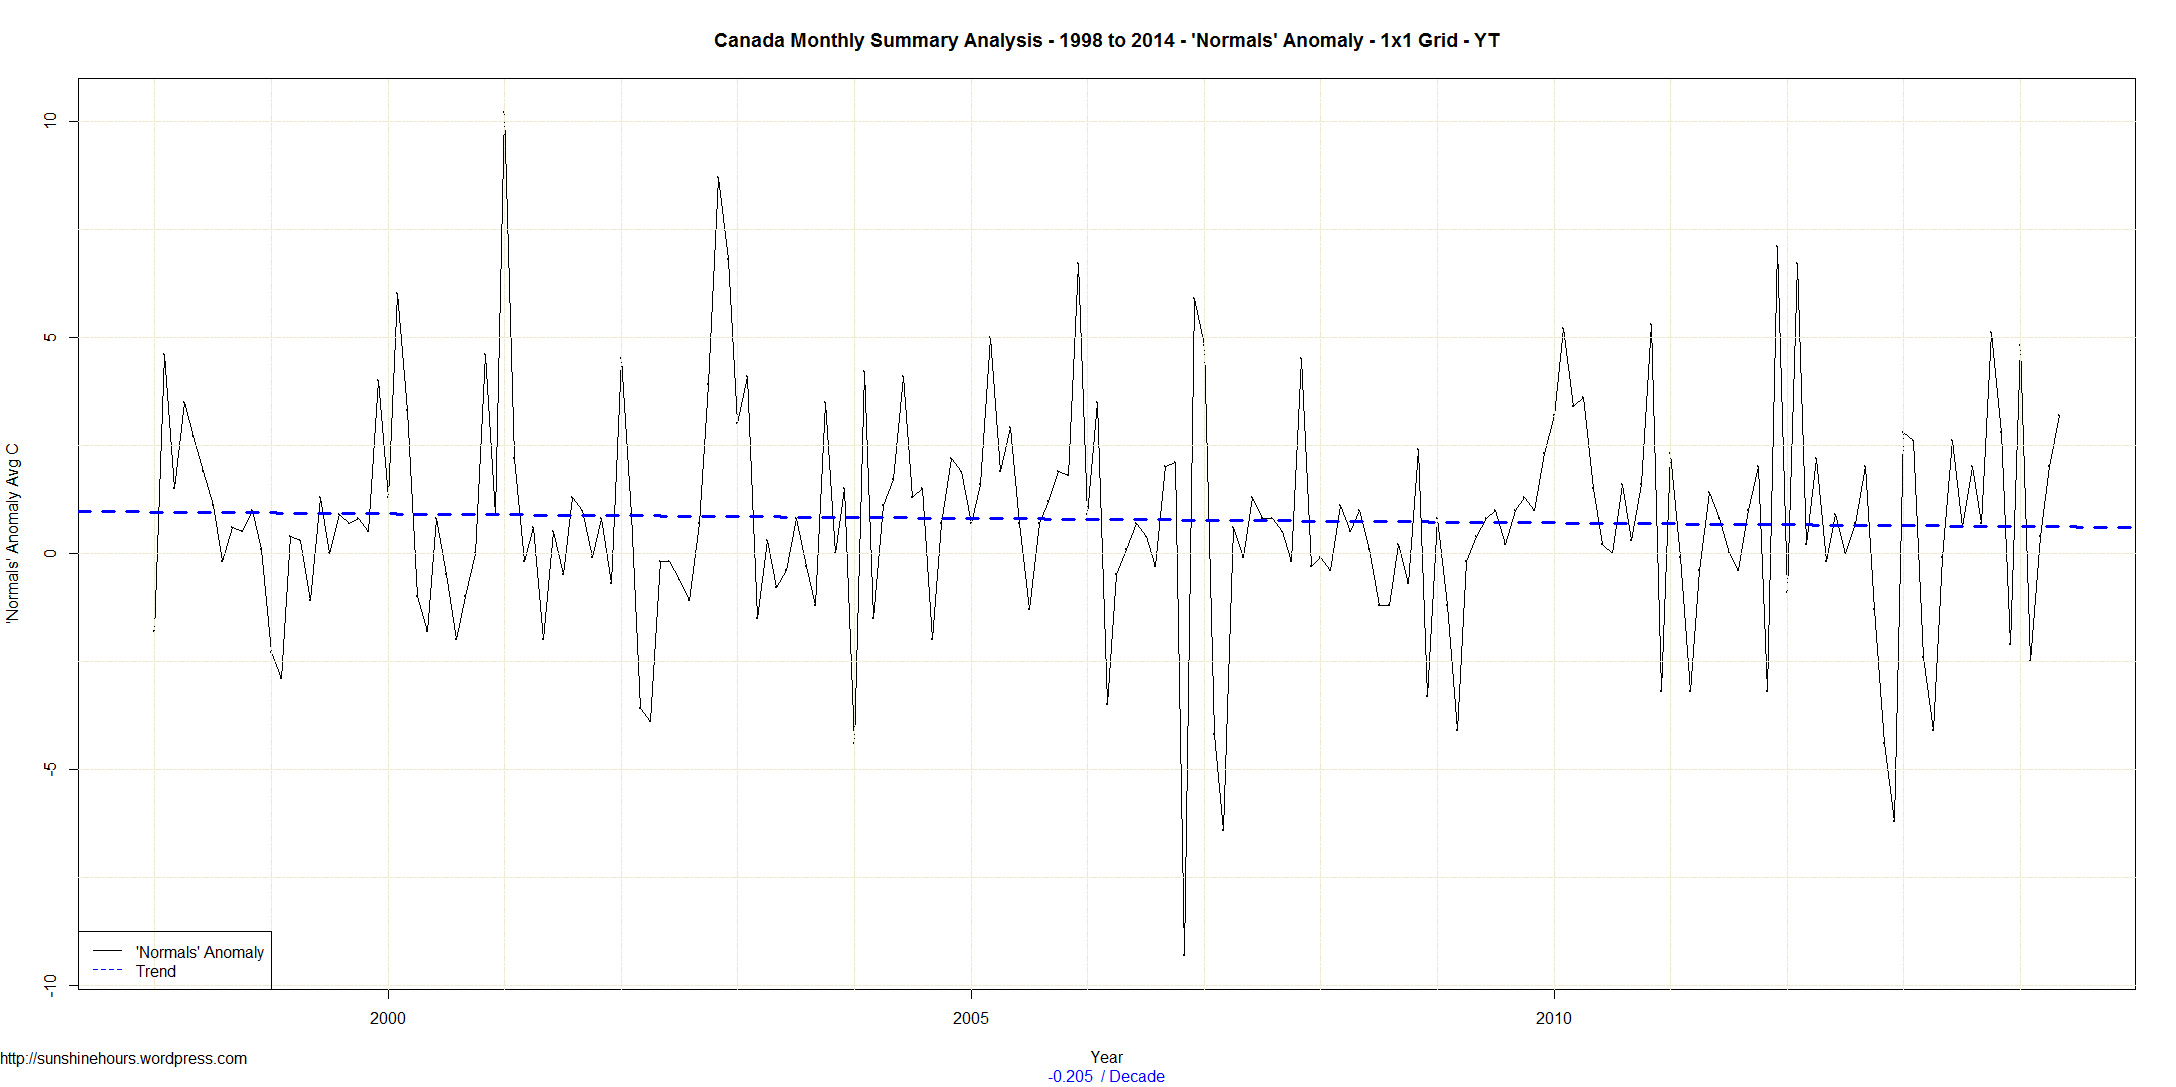
If you take Environment Canada’s monthly summaries from 1998 to April 2015.
Use only the station with pre-calculated Normals (anomalies from 1981-2010 avg).
Average them on a 1×1 grid and then graph the data:

If you take Environment Canada’s monthly summaries from 1998 to April 2015.
Use only the station with pre-calculated Normals (anomalies from 1981-2010 avg).
Average them on a 1×1 grid and then graph the data:
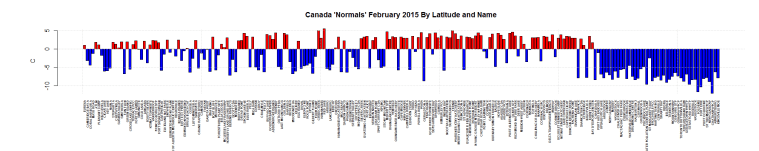
These are just the stations deemed ‘Normals” by Environment Canada. The temperature is the departure from the 1971-2000 average in Celsius. I’m using monthly summary.
This graphs data is sorted by Longitude (West to East) and By Name. Click for bigger.

This graphs data is sorted by Latitude (North to South) and By Name. Click for bigger.
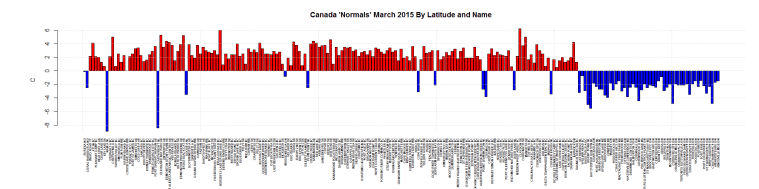

Using November Tmin data from Environment Canada’s monthly summaries.
I used the following filter. There had to be 25 years of data. And there had to be data in 2014.
420 stations fit that criteria.
For 122 of those stations, November 2014 was in the top 5 coldest.
So, for example. 108 MILE HOUSE ABEL LAKE has 27 rows of data, and 2014 is ranked as the 4th coldest.
| Prov | Stn | Rows | Last Year | Nov 2014 Monthly Tmin | Nov 2014 Monthly Rank | Coldest 10 Novembers (In order) |
| BC | 108 MILE HOUSE ABEL LAKE | 27 | 2014 | -28.5 | 4 | 1996,2006,1993,2014,2001,1995,1994,2005,2010,2003 |
| BC | ADDENBROKE ISLAND | 35 | 2014 | -7 | 3 | 1985,2006,2014,1993,2010,2003,2011,1982,1990,2001 |
| MB | ARBORG | 55 | 2014 | -31.5 | 5 | 1978,1985,1989,1995,2014,1964,1971,1976,1991,1997 |
| BC | ASHCROFT | 25 | 2014 | -21.1 | 1 | 1959,2014,1978,1977,2010,2011,1963,1958,2013,1979 |
| MB | BALDUR | 52 | 2014 | -27.5 | 4 | 1985,1964,1978,2007,2013,2014,1977,1976,1986,2012 |
| MB | BERENS RIVER CS | 30 | 2014 | -36 | 2 | 1985,2014,1986,1993,1995,1997,1989,1991,1996,2012 |
| ON | BIG TROUT LAKE | 57 | 2014 | -32 | 5 | 1989,1949,1968,1976,2012,2014,1958,1978,2012,1957 |
| BC | BILLINGS | 30 | 2014 | -17 | 5 | 1985,2006,2010,1993,2014,1996,2007,1991,1986,2003 |
| BC | BLUE RIVER A | 45 | 2014 | -30.6 | 3 | 1985,2006,2014,1975,1993,2010,1984,1978,1996,1970 |
| BC | BOAT BLUFF | 37 | 2014 | -5.5 | 5 | 1985,2006,1996,2010,2014,1993,2001,1978,1982,1990 |
| AB | BRETON | 29 | 2014 | -34 | 1 | 2014,1996,2006,2010,2013,2003,1993,1990,2011,1975 |
| AB | BROOKS | 37 | 2014 | -30.3 | 3 | 1975,1978,2014,1996,2003,2010,1973,1990,2006,1977 |
| AB | BRULE BLACK CAT | 28 | 2014 | -39.5 | 1 | 2014,1996,2010,2006,1990,1993,1995,2001,2003,1991 |
| BC | BURNS LAKE DECKER LAKE | 35 | 2014 | -31.4 | 3 | 1955,2006,2014,1970,1963,2010,1964,2011,1965,1966 |
| BC | CAPE ST JAMES | 48 | 2014 | -3.4 | 4 | 1985,1946,1955,2014,1963,1959,1970,1973,1950,1945 |
| AB | CARDSTON | 99 | 2014 | -32 | 5 | 1955,1996,1946,1985,1996,2014,1950,1959,1963,1993 |
| MB | CARMAN | 25 | 2014 | -28 | 1 | 2014,1996,2005,1995,2007,2013,2010,1991,1990,2003 |
| ON | CHAPLEAU A | 37 | 2014 | -31.5 | 1 | 2014,1989,1983,2007,1995,1978,1992,1993,1986,2000 |
| NL | CHURCHILL FALLS A | 27 | 2014 | -29.9 | 3 | 1986,1972,2014,1978,1989,1992,1977,1980,1991,2013 |
| QC | CHUTE-DES-PASSES | 37 | 2014 | -23.8 | 5 | 1964,1968,1997,2002,2014,1971,2005,1962,1975,2013 |
| SK | CIGAR LAKE | 28 | 2014 | -36 | 3 | 1988,1990,2014,2004,1995,2007,2012,1994,2001,2006 |
| AB | CLARESHOLM | 29 | 2014 | -35.3 | 2 | 2010,2014,1996,2006,2003,1955,2012,2007,1993,1995 |
| SK | CLAYDON | 44 | 2014 | -28 | 2 | 1985,1996,2014,2010,1982,1973,1975,1976,1986,2006 |
| SK | COLLINS BAY | 39 | 2014 | -35.8 | 2 | 1988,2014,1975,1978,1976,2004,1985,1982,1972,1977 |
| SK | CORONACH | 48 | 2014 | -30.5 | 4 | 1996,1985,1946,2006,2014,1993,2010,1977,1978,1945 |
| SK | CORONACH SPC | 33 | 2014 | -28.6 | 3 | 1996,1985,2010,2014,1991,1993,2003,2006,2000,1990 |
| MB | COWAN | 29 | 2014 | -33 | 2 | 1985,2010,2014,1991,1989,1984,2006,1996,1995,2000 |
| BC | CRISS CREEK | 25 | 2014 | -31.5 | 2 | 2006,2014,1993,2010,1996,2013,2011,1990,1994,2003 |
| MB | DAUPHIN | 41 | 2014 | -31.5 | 2 | 1919,2014,1905,1921,1907,2013,1935,1940,1914,1926 |
| BC | DAWSON CREEK A | 47 | 2014 | -37.1 | 5 | 1985,2006,1990,1970,2014,1993,1982,2013,1973,2001 |
| BC | DELTA TSAWWASSEN BEACH | 27 | 2014 | -7.5 | 2 | 2006,2014,1993,2010,1996,2011,1994,2003,2013,1992 |
| BC | DRYAD POINT | 37 | 2014 | -6 | 5 | 1985,2006,1996,2010,2011,2014,1993,1982,1990,1978 |
| BC | DUNCAN KELVIN CREEK | 27 | 2014 | -6 | 5 | 2010,1993,2006,1996,2003,2014,1994,1995,2002,2000 |
| SK | DUVAL | 52 | 2014 | -28 | 5 | 1985,1978,1996,2013,2014,1966,1970,1977,1965,1991 |
| AB | EDMONTON STONY PLAIN | 49 | 2014 | -31 | 3 | 1985,1970,2014,2010,1996,2006,2003,1990,1973,1984 |
| AB | EDSON | 58 | 2014 | -36 | 4 | 1963,1919,1950,2014,1955,1940,1946,2013,2010,1921 |
| AB | EGG ISLAND | 61 | 2014 | -25.6 | 2 | 2012,2014,2013,2001,2002,2003,2004,1985,2006,2007 |
| MB | ELKHORN 2 EAST | 26 | 2014 | -27 | 5 | 2013,1996,2006,2007,2014,1995,1990,1991,2010,1989 |
| BC | ENTRANCE ISLAND | 28 | 2014 | -2 | 3 | 2006,2010,2014,1996,2014,1916,2003,2005,2007,2011 |
| AB | ENTWISTLE | 28 | 2014 | -33 | 2 | 2010,2006,2014,1996,2003,1990,2013,1993,1991,2012 |
| BC | EQUITY SILVER | 32 | 2014 | -29.5 | 3 | 1985,1982,1996,2014,2010,2001,2013,1984,2003,1986 |
| SK | ESTEVAN | 26 | 2014 | -27.7 | 5 | 1919,1905,1900,1914,2014,1903,2013,1910,1911,1924 |
| SK | ESTEVAN A | 71 | 2014 | -28.5 | 4 | 1996,1985,1964,1990,2014,1978,1946,1955,2006,2010 |
| AB | FABYAN | 34 | 2014 | -31.5 | 4 | 1985,1996,2010,2014,1990,1986,2006,1982,1993,2013 |
| BC | FERNIE | 96 | 2014 | -29 | 5 | 1959,1985,1982,1993,2014,1946,1970,2006,1940,2003 |
| ON | FOLDENS | 52 | 2014 | -13 | 5 | 1987,2013,1986,2000,2014,1976,1996,2005,1964,1967 |
| AB | FORT VERMILION | 26 | 2014 | -34.9 | 3 | 2006,2012,2014,2013,1915,1963,2011,1908,2007,1914 |
| ON | GERALDTON A | 34 | 2014 | -32.1 | 4 | 1985,1989,1995,2014,2007,1986,1997,1992,2013,2005 |
| MB | GILBERT PLAINS | 55 | 2014 | -34 | 3 | 1958,1985,2014,1964,1991,1996,1978,2010,1995,1971 |
| BC | GOLDSTREAM RIVER | 31 | 2014 | -22 | 3 | 1985,2006,1993,2014,1982,1984,2007,1995,1996,2013 |
| MB | GRAND RAPIDS HYDRO | 46 | 2014 | -30 | 3 | 2004,1985,2014,1978,1989,1966,1970,2010,1993,1971 |
| AB | GRANDE PRAIRIE A | 73 | 2014 | -38 | 4 | 1963,1985,1955,2014,1970,2006,1950,1990,1961,1965 |
| MB | GRETNA (AUT) | 34 | 2014 | -27.2 | 4 | 1958,1996,1964,2014,1955,2013,2007,1995,1993,2006 |
| ON | HAMILTON A | 55 | 2014 | -13.2 | 2 | 2000,2014,1987,1959,2013,1986,1976,1996,1967,2005 |
| BC | HOPE A | 60 | 2014 | -10.1 | 4 | 1985,1955,1959,2014,1993,1945,1946,1970,1940,1977 |
| BC | HORSEFLY LAKE GRUHS LAKE | 37 | 2014 | -30.5 | 3 | 1955,2006,2014,2010,1996,1959,2001,2013,1993,1994 |
| BC | IVORY ISLAND | 30 | 2014 | -6 | 3 | 2006,1996,2010,2014,1993,2011,1950,1990,2001,2005 |
| BC | KAMLOOPS PRATT ROAD | 26 | 2014 | -24 | 2 | 2006,2014,1996,2010,1993,1990,2013,2003,2011,1995 |
| ON | KAPUSKASING A | 78 | 2014 | -31.1 | 4 | 1938,1957,1975,2014,1940,1995,1976,2012,1964,1978 |
| BC | KELOWNA | 68 | 2014 | -19.4 | 4 | 1900,2010,1955,2014,1959,1911,2011,1921,1927,1903 |
| SK | KINDERSLEY A | 32 | 2014 | -28.5 | 5 | 1996,1985,2010,1991,2014,2011,1993,2006,2013,1984 |
| ON | KINGSVILLE MOE | 47 | 2014 | -11 | 3 | 1996,1976,1986,2014,1979,1991,2005,2013,1969,1977 |
| SK | LEROY | 35 | 2014 | -29 | 4 | 1985,1996,1990,1995,2007,2010,2014,1982,2003,2013 |
| BC | LILLOOET | 44 | 2014 | -19.2 | 2 | 1883,2014,1921,1940,2010,1927,1931,1881,1919,1924 |
| AB | LLOYDMINSTER A | 33 | 2014 | -28.3 | 5 | 1985,1996,2010,1990,2014,2003,2013,1995,2006,1986 |
| MB | MAFEKING | 25 | 2014 | -31 | 1 | 2014,1989,1991,1993,2007,1990,1996,2006,2010,2011 |
| SK | MANKOTA | 46 | 2014 | -32.5 | 3 | 1985,1996,2014,1978,2003,1975,1976,1984,1964,1977 |
| MB | MARQUETTE | 46 | 2014 | -27 | 5 | 1985,1978,1976,1977,1995,2014,1986,2007,1989,1996 |
| ON | MASSEY | 32 | 2014 | -24.5 | 2 | 1989,2014,1995,2000,1986,2005,2007,2013,1983,1991 |
| SK | MCKAGUE 2 | 30 | 2014 | -32.5 | 3 | 1985,1991,2014,1996,2007,1990,2010,1986,1993,1995 |
| BC | MCLEESE LAKE GRANITE MT | 39 | 2014 | -29 | 3 | 2006,1978,2014,1996,2010,2013,1993,1984,1995,1977 |
| SK | MEADOW LAKE | 28 | 2014 | -34.6 | 3 | 2013,1970,2014,2006,2003,1996,2007,2010,1975,1972 |
| SK | MEADOW LAKE A | 32 | 2014 | -34.4 | 5 | 1985,1982,1990,1978,2014,1986,2003,2006,1994,2007 |
| BC | MERRITT | 43 | 2014 | -24.7 | 1 | 2014,1924,1945,1921,1946,1931,1950,1919,1935,2011 |
| BC | MICA DAM | 52 | 2014 | -18.5 | 4 | 1985,2006,1970,2014,1963,1984,2010,1975,1993,1978 |
| AB | MILK RIVER | 40 | 2014 | -29.3 | 2 | 1996,2014,2006,2010,2003,1970,2007,2012,1964,1963 |
| BC | MISSION WEST ABBEY | 53 | 2014 | -9 | 4 | 1985,2006,2010,1993,2014,1978,1996,1970,1977,1963 |
| BC | MYRA CREEK | 32 | 2014 | -6 | 5 | 2010,2006,1982,1993,1996,2014,2003,1979,1981,1983 |
| BC | NEW DENVER | 45 | 2014 | -14 | 5 | 1985,2006,2010,1993,1977,2014,1970,1978,1975,1984 |
| BC | NORTH PENDER ISLAND | 32 | 2014 | -5 | 5 | 1985,2006,1993,2010,1982,2014,1996,1975,2011,1984 |
| BC | OKANAGAN CENTRE | 85 | 2014 | -14.5 | 5 | 1985,1955,1959,1996,2014,1946,1940,1970,1993,1977 |
| BC | OSOYOOS CS | 25 | 2014 | -13 | 4 | 2010,2006,1993,2014,1996,2003,2002,1995,1994,2013 |
| BC | PEACHLAND | 41 | 2014 | -16.5 | 3 | 1985,2006,2010,2014,1978,1993,1996,1977,2003,1975 |
| SK | PELLY | 60 | 2014 | -34 | 4 | 1958,1985,1970,1978,2014,1959,1991,1955,1951,1982 |
| AB | PICTURE BUTTE WEST | 26 | 2014 | -29.5 | 3 | 1996,2006,2014,2010,2012,2003,1991,1993,1990,2001 |
| MB | PINAWA | 58 | 2014 | -30 | 3 | 1929,1926,1919,2014,1940,1921,1930,1933,1996,1927 |
| ON | PORT COLBORNE | 50 | 2014 | -10 | 5 | 1987,1976,2000,2013,1986,2005,2008,2014,1989,1967 |
| BC | PRINCE GEORGE | 38 | 2014 | -32.3 | 3 | 1927,1940,2014,1919,2010,1935,1921,1931,2011,1924 |
| BC | PRINCE GEORGE STP | 39 | 2014 | -28 | 4 | 1985,2006,1996,2014,1978,2010,1982,1977,1986,1984 |
| BC | PRINCE RUPERT | 60 | 2014 | -8.7 | 4 | 1955,1911,1921,2014,1909,1910,1946,1950,2010,1959 |
| BC | PRINCETON A | 79 | 2014 | -27 | 5 | 1985,2006,1975,1955,2014,2010,1958,1959,1970,1982 |
| AB | QUEENSTOWN | 53 | 2014 | -29 | 4 | 1985,2010,2010,2006,2014,1993,1977,1996,1975,1978 |
| BC | QUESNEL | 83 | 2014 | -31.3 | 4 | 1896,1893,1955,2014,1897,1946,1959,1892,1911,1940 |
| BC | RED LAKE | 30 | 2014 | -25 | 4 | 1985,2006,2010,2014,1993,1996,1995,1986,2013,1974 |
| ON | RED LAKE A | 70 | 2014 | -31 | 5 | 1985,1978,1940,1995,2014,1964,1976,1986,1956,1955 |
| MB | RENNIE | 28 | 2014 | -32.5 | 2 | 1996,2014,1991,2007,1989,1995,1997,2013,1979,2003 |
| MB | ROBLIN | 42 | 2014 | -32.2 | 4 | 1985,1978,1996,2014,1991,2010,1996,1989,2013,1977 |
| SK | ROCK POINT | 40 | 2014 | -28.5 | 5 | 1985,1978,1996,1977,2014,1976,1982,1984,1975,2010 |
| SK | ROCKGLEN (AUT) | 30 | 2014 | -28.6 | 3 | 1978,1996,2014,1977,2010,1976,1975,2006,2003,1995 |
| ON | ROSEVILLE | 43 | 2014 | -17 | 1 | 2000,2014,2008,1987,1996,1982,1972,1999,2013,1976 |
| BC | SATURNA ISLAND CS | 28 | 2014 | -2.9 | 5 | 1985,2010,2006,1993,2014,1984,2011,1982,1983,2012 |
| ON | SAULT STE MARIE A | 57 | 2014 | -19.1 | 4 | 1975,1976,1995,2014,1989,1947,1964,2013,1997,1977 |
| BC | SILVER CREEK | 25 | 2014 | -21.5 | 3 | 2006,2010,1996,2014,1993,2003,1990,1994,2013,1991 |
| BC | SPARWOOD | 33 | 2014 | -33.5 | 2 | 1985,2014,2010,1993,2006,1996,1984,1991,1986,2003 |
| BC | SPOKIN LAKE 4E | 31 | 2014 | -36 | 2 | 1985,2014,2006,1996,2013,2010,1993,1986,1995,2001 |
| MB | ST ALPHONSE | 29 | 2014 | -27 | 4 | 2007,1996,2013,2014,1986,1989,2006,2000,2010,1991 |
| NL | ST ANTHONY | 60 | 2014 | -22.6 | 1 | 2014,1946,1993,1978,1989,2000,1994,1992,1986,1982 |
| SK | STEWART VALLEY | 30 | 2014 | -28 | 4 | 1985,1996,2013,2014,1991,2010,2006,1984,1993,1995 |
| ON | SUDBURY A | 61 | 2014 | -22.6 | 3 | 1958,1989,2014,1977,1956,1978,1982,1986,2013,1964 |
| BC | SUMMERLAND CS | 25 | 2014 | -16.8 | 3 | 2006,2010,2014,1993,1996,2003,1990,1994,2013,1992 |
| BC | SUSKWA VALLEY | 31 | 2014 | -24 | 4 | 1985,2006,1996,2014,2010,1982,1993,1990,2007,1986 |
| NU | TALOYOAK A | 31 | 2014 | -38.9 | 2 | 2004,2014,2002,1989,1993,1985,1987,1992,1994,2000 |
| ON | TIMMINS A | 41 | 2014 | -30.2 | 4 | 1975,1957,1964,2014,1989,1986,1959,1978,1976,1968 |
| AB | VEGREVILLE | 36 | 2014 | -34.6 | 4 | 1996,1985,2010,2014,1990,2006,2013,2003,1984,2011 |
| BC | VERNON SILVER STAR LODGE | 32 | 2014 | -26.5 | 5 | 2006,1985,2003,1993,2014,2009,2010,1970,1984,1994 |
| MB | WASAGAMING | 45 | 2014 | -32.3 | 5 | 1985,1978,1996,2013,2014,1986,2010,1967,1995,1971 |
| ON | WAWA A | 36 | 2014 | -25.9 | 2 | 1989,2014,2007,2013,1995,1997,1977,1986,1982,1993 |
| ON | WELCOME ISLAND (AUT) | 36 | 2014 | -20.2 | 3 | 1976,1978,2014,2007,1977,1979,1997,2013,2000,1967 |
| BC | WHISTLER ROUNDHOUSE | 35 | 2014 | -23 | 5 | 1985,1993,2006,2010,2014,1977,1975,1973,1986,1982 |
| AB | WHITECOURT | 52 | 2014 | -33.4 | 5 | 1955,1963,1950,1970,2014,1946,1964,2006,1961,1959 |
| AB | WHITECOURT A | 37 | 2014 | -32.9 | 3 | 1985,2006,2014,1996,2010,1984,1990,2003,1986,2013 |
| BC | WILLIAMS LAKE A | 54 | 2014 | -31 | 2 | 1985,2014,1996,2006,1970,1978,1993,1977,1963,2010 |
Map of snowfall in Canada for September 2014 from Environment Canada’s monthly summaries.
The size of the black dot in the top left corner represents 100cm of snow. MOUNTAIN VIEW VILLAGE got 80cm in September. Top 10 list is below.
Click for bigger.

| Prov | Stn_Name | Snow(cm) | Lat | Long |
| AB | MOUNTAIN VIEW VILLAGE | 80 | 49.132 | -113.594 |
| NU | ALERT UA | 77.8 | 82.5 | -62.333 |
| AB | KANANASKIS | 60.6 | 51.028 | -115.035 |
| AB | WILDCAT HILLS | 34 | 51.269 | -114.721 |
| AB | CALGARY INTL A | 28.2 | 51.123 | -114.013 |
| AB | OKOTOKS | 19.6 | 50.729 | -113.961 |
| NU | BAKER LAKE A | 17.8 | 64.299 | -96.078 |
| BC | FORT ST. JOHN A | 15.6 | 56.238 | -120.74 |
| NU | RANKIN INLET A | 15.4 | 62.811 | -92.115 |
| AB | BRULE BLACK CAT | 15.2 | 53.35 | -117.867 |
These are just the stations deemed ‘Normals” by Environment Canada. The temperature is the departure from the 1971-2000 average in Celsius. I’m using monthly summary.
This graphs data is sorted by Latitude (North to South) and By Name. Click for bigger.

This graphs data is sorted by Longitude (West to East) and By Name. Click for bigger.

These are just the stations deemed ‘Normals” by Environment Canada. The temperature is the departure from the 1971-2000 average in Celsius. I’m using monthly summary.
This graphs data is sorted by Longitude (West to East) and By Name. Click for bigger.

This graphs data is sorted by Latitude (North to South) and By Name. Click for bigger.

Well … technically they say 4.2% less clouds. But that does mean more sunshine (except at night).
The emergence of satellite-based cloud records of climate-length and quality hold tremendous potential for climate model development, climate monitoring, and studies on global water cycling and its subsequent energetics. This article examines the more than thirty-year PATMOS-x AVHRR cloudiness record over North America and assesses its suitability as a climate-quality data record. A loss of ~4.2% total cloudiness is observed between 1982 and 2012 over a North American domain centered over the contiguous United States.
http://journals.ametsoc.org/doi/abs/10.1175/JCLI-D-14-00068.1?af=R&
As you know, land base sunshine monitoring is atrocious in North America. Once upon a time Canada had over 300 stations collecting sunshine data. How do we know whether major ups and downs in climate aren’t because of more or less clouds?
(h/t Hockey Schtick)
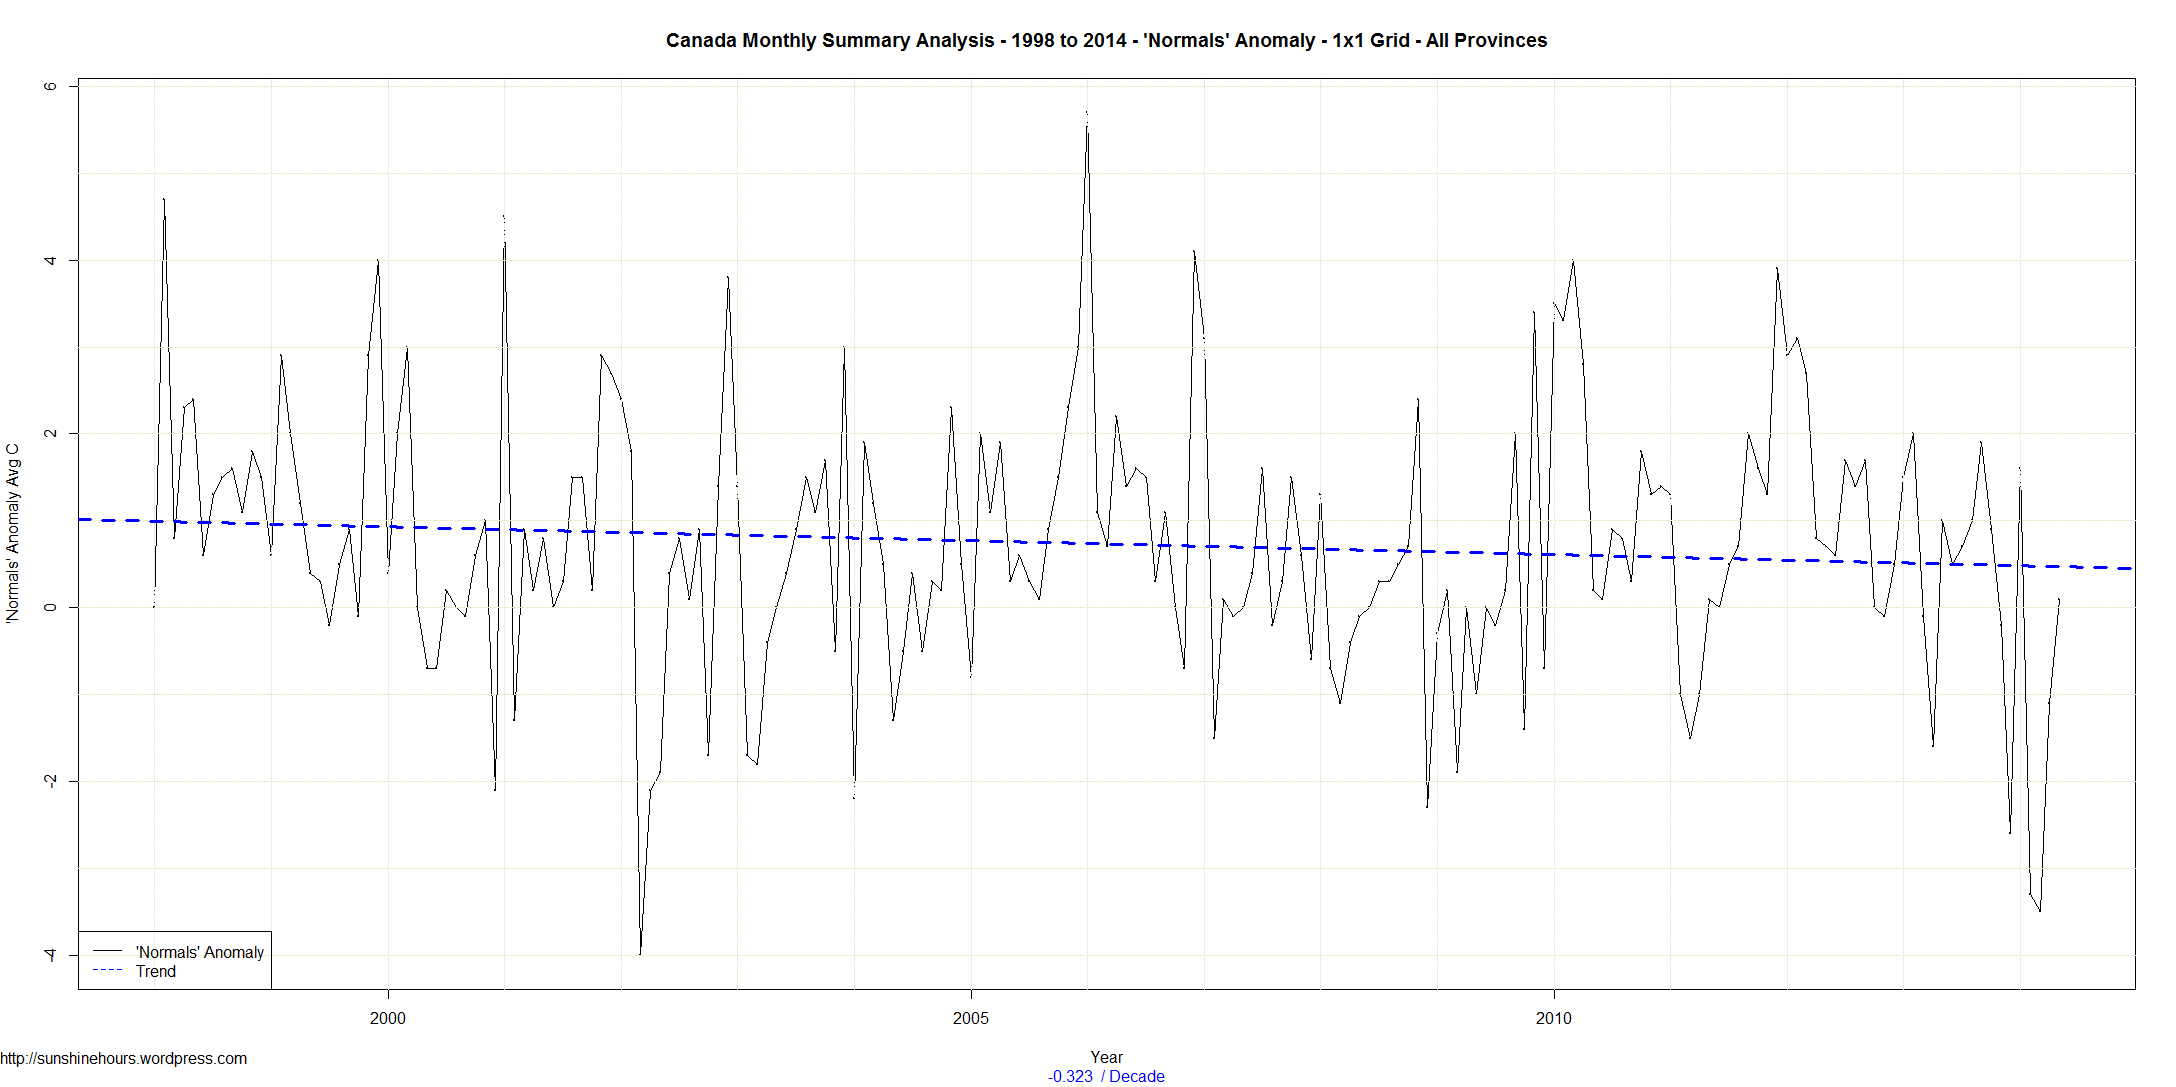
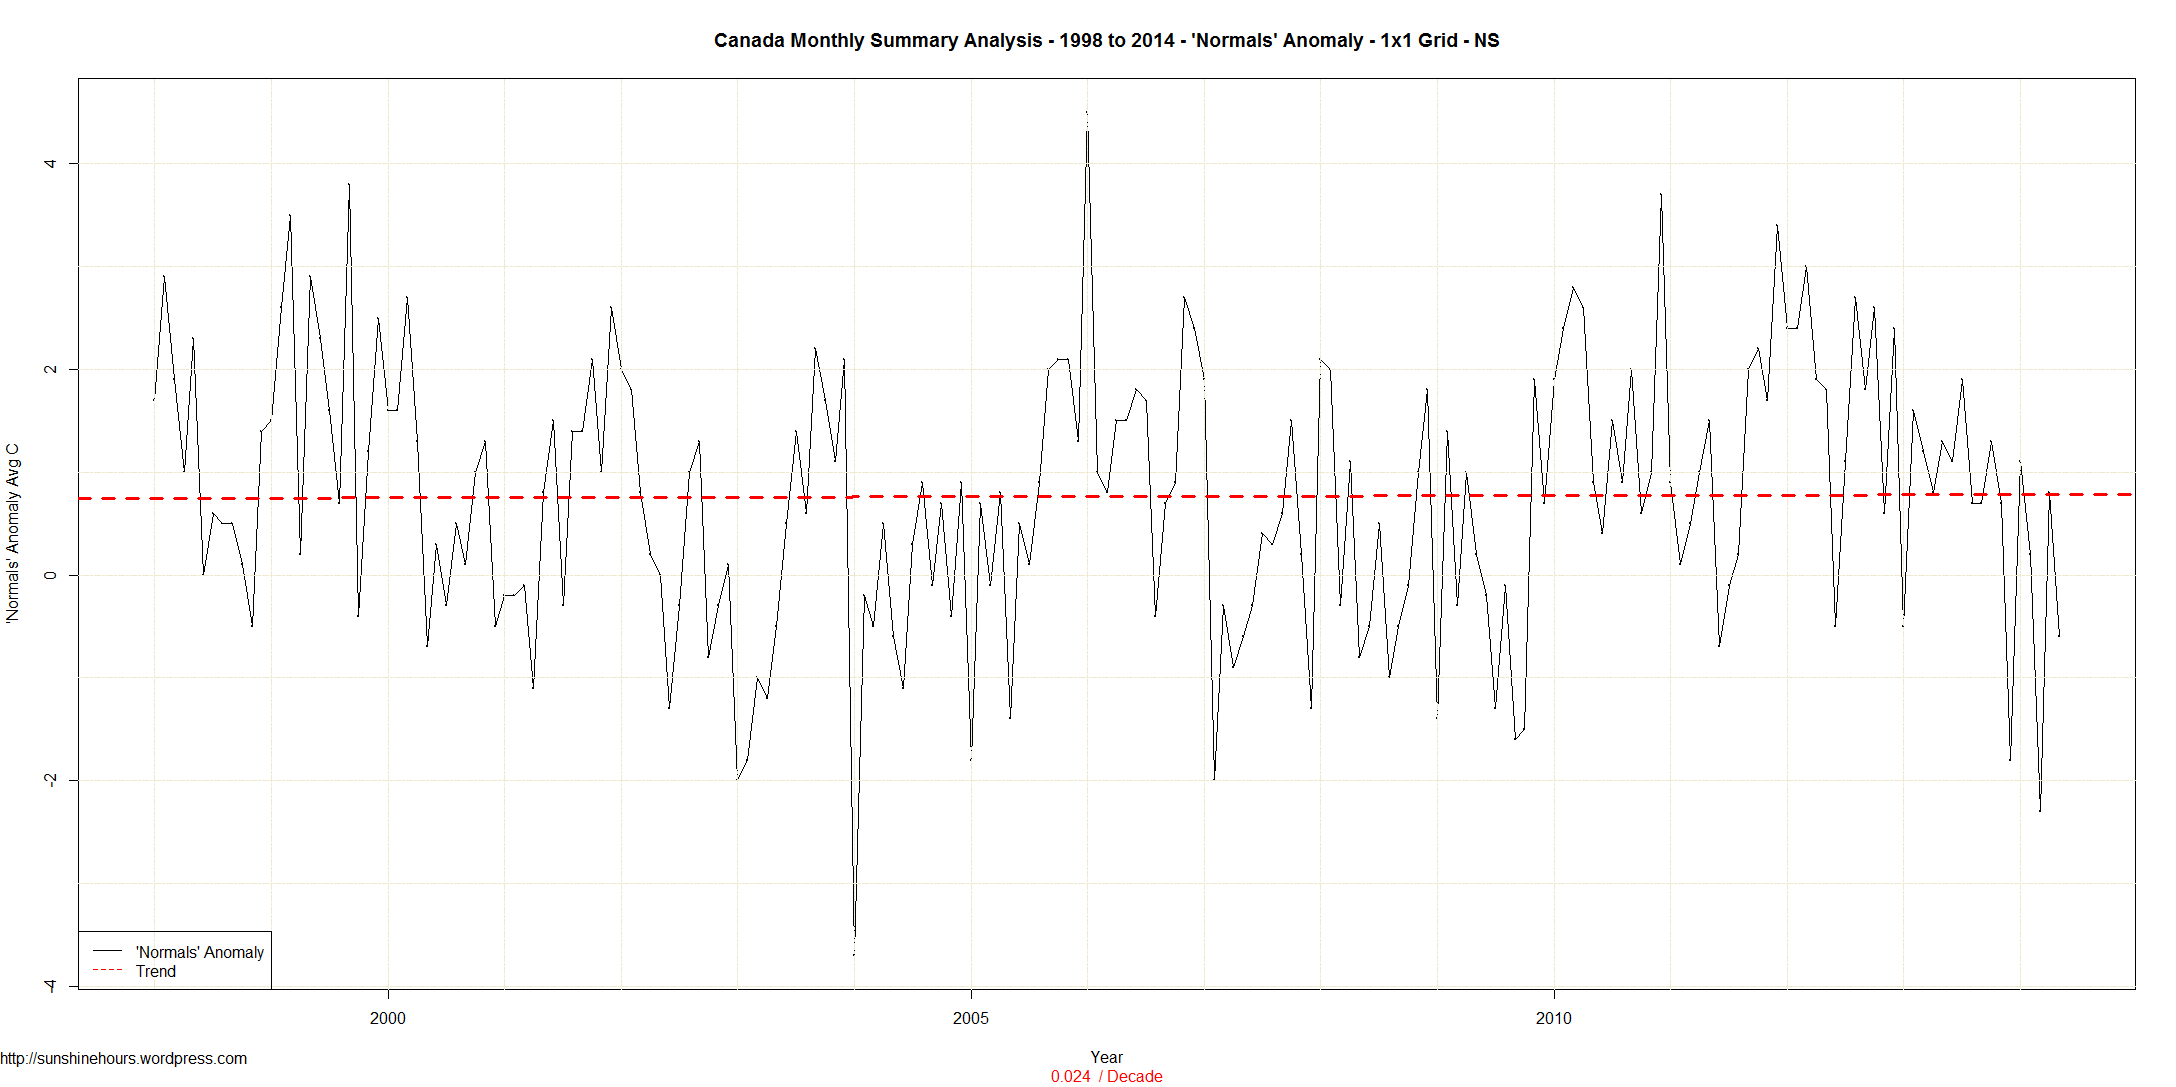
Environment Canada publishes monthly summaries here. The data included Tmax, Tmean, Tmin and Normals (the D column). The Normals column is “Mean Temperature difference from Normal (1971-2000) (°C)”. These are supposedly the higher quality stations. Only some of the stations get a Normals value.
I could just look at the stations with Normals and summarize the data. But some of the stations are close together. So I thought why not summarize the data by 1×1 grid square and then summarize the grid squares.
Correction: I left the green line out of these graphs – The green line is the count of grid squares with data in them. That is dropping like a stone. (I will discuss this in another post).
And why not see what happens from 1998. We know 1998 is a pivot point in climate.
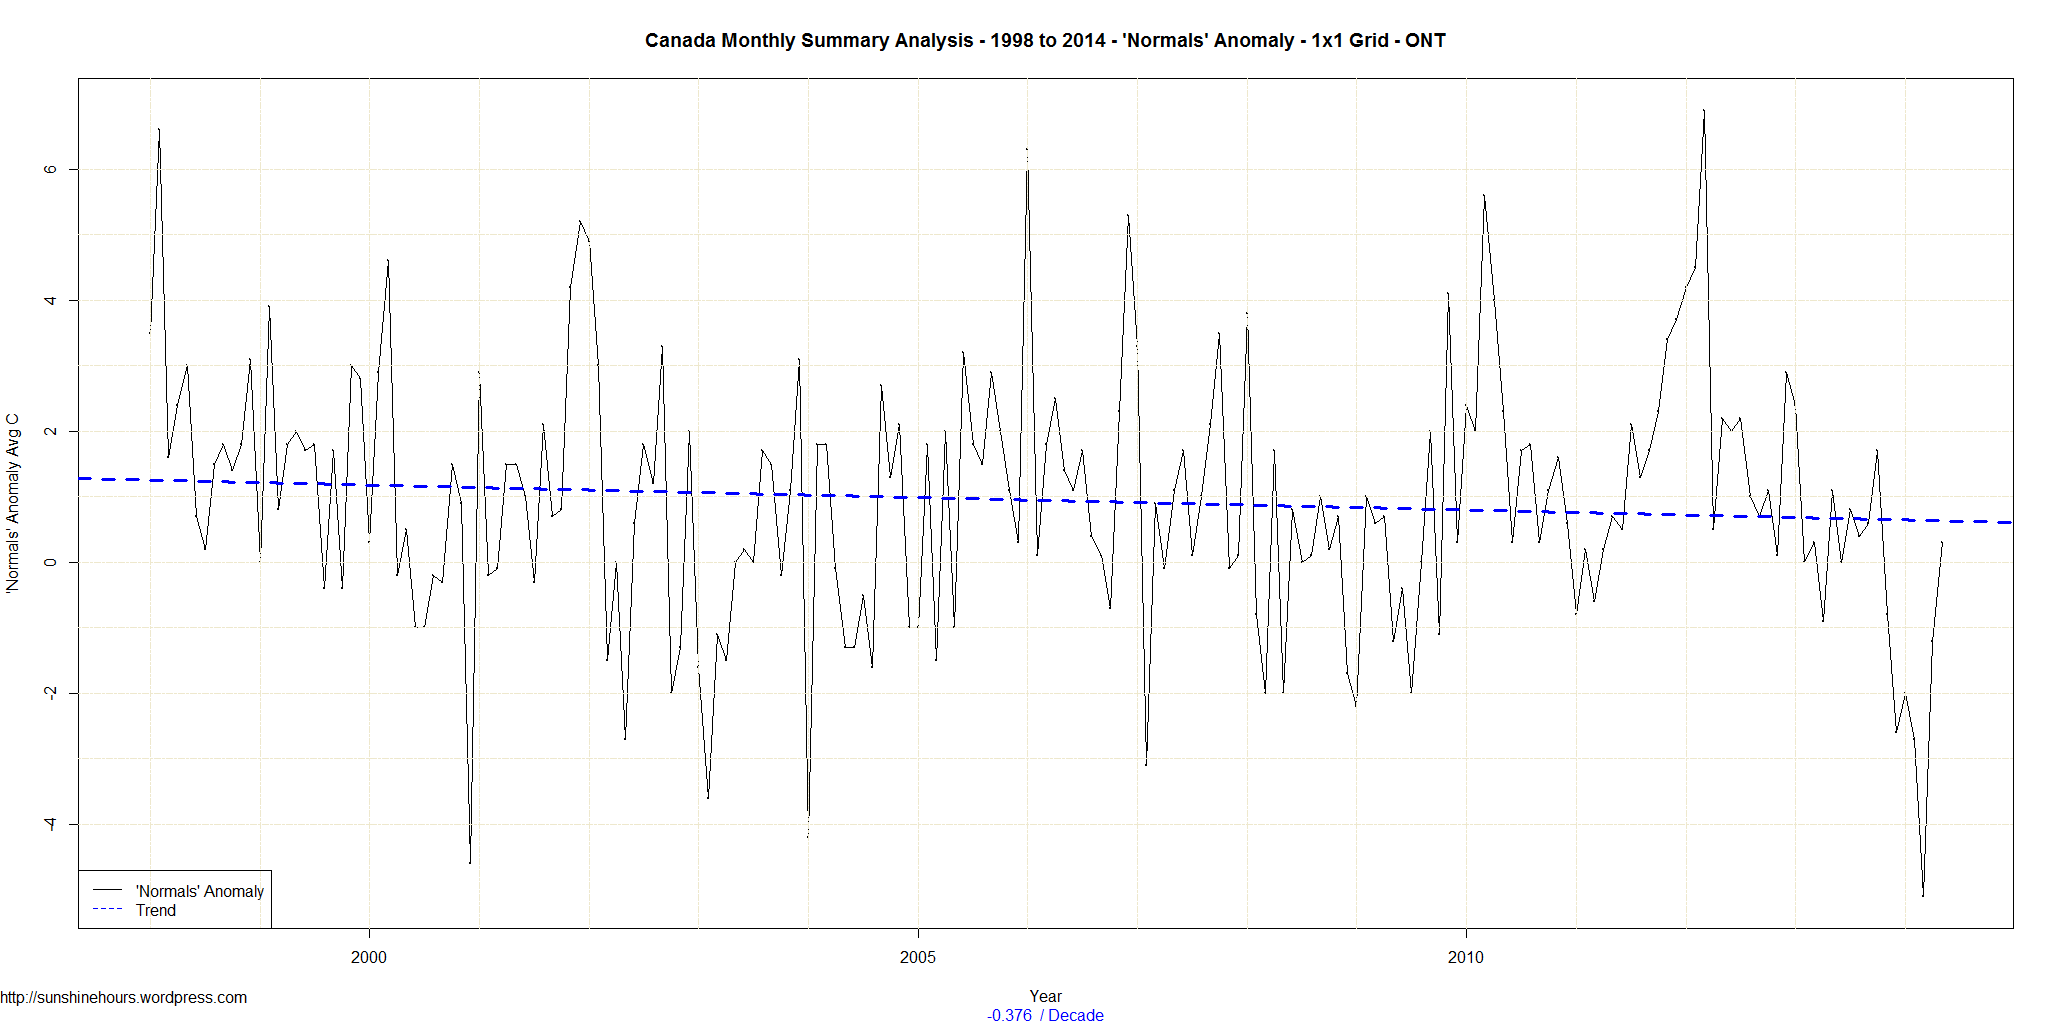
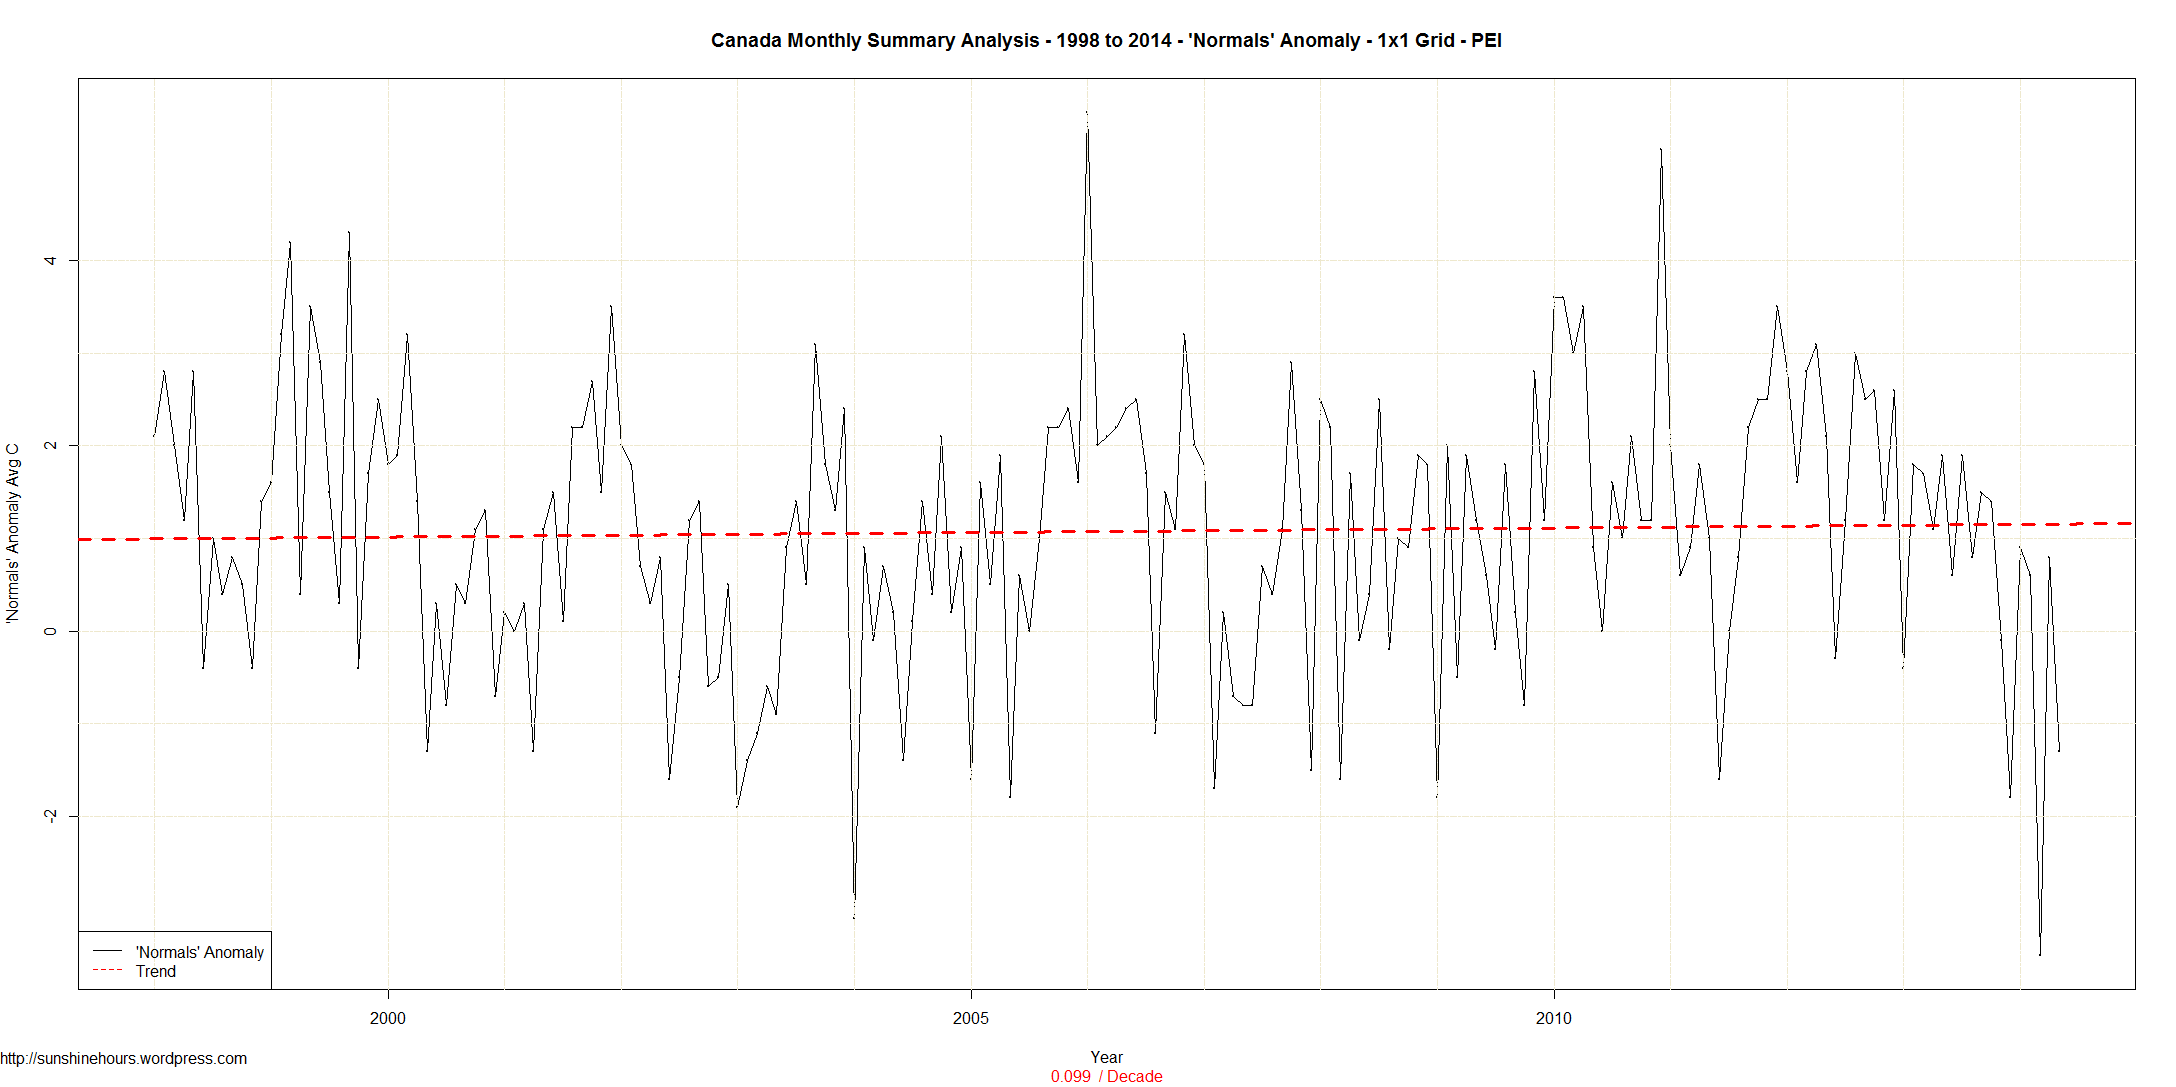
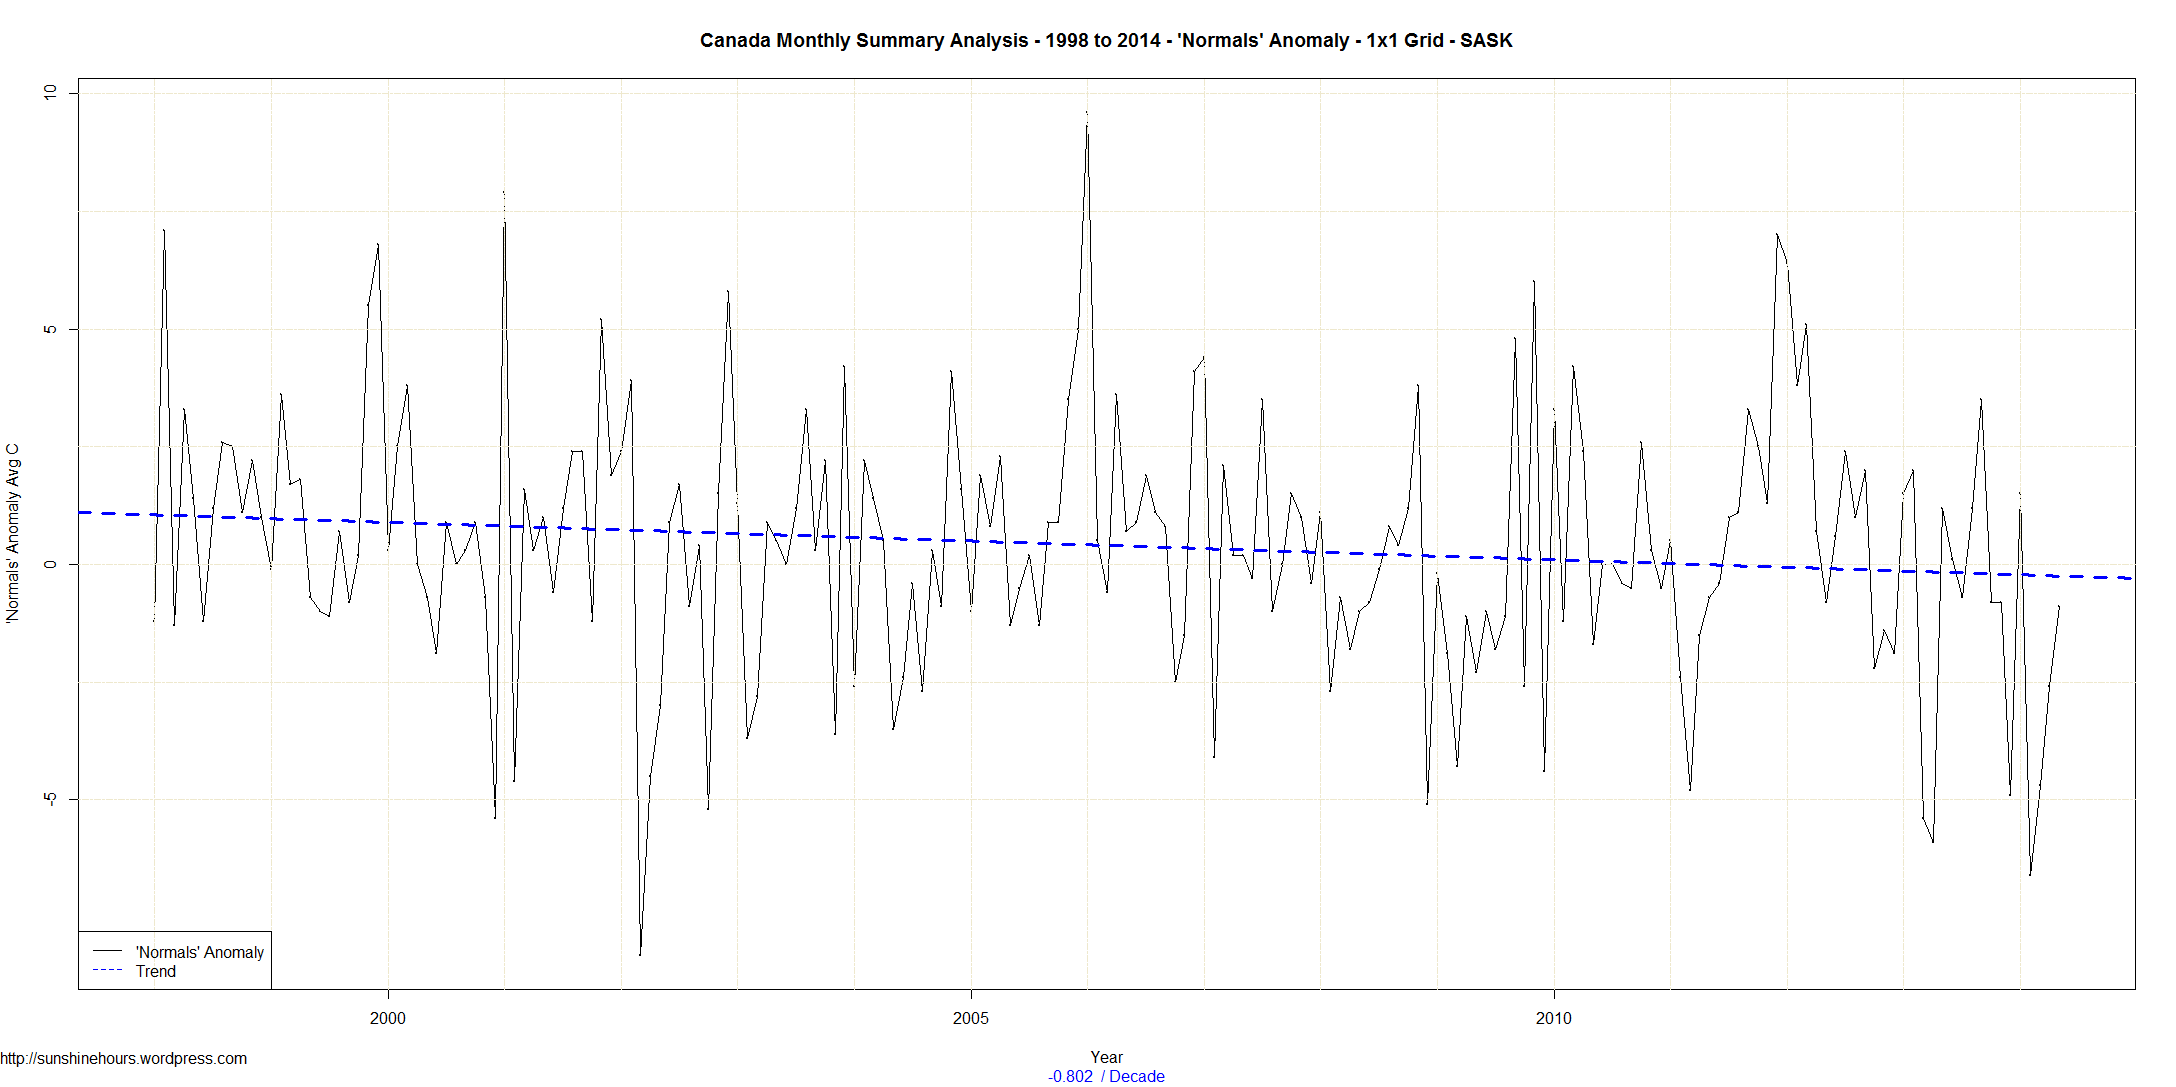
The trend for the whole country from 1998 is cooling at -0.32C/decade. Saskatchewan and Manitoba are cooling at over -.8 C /decade. Wow.
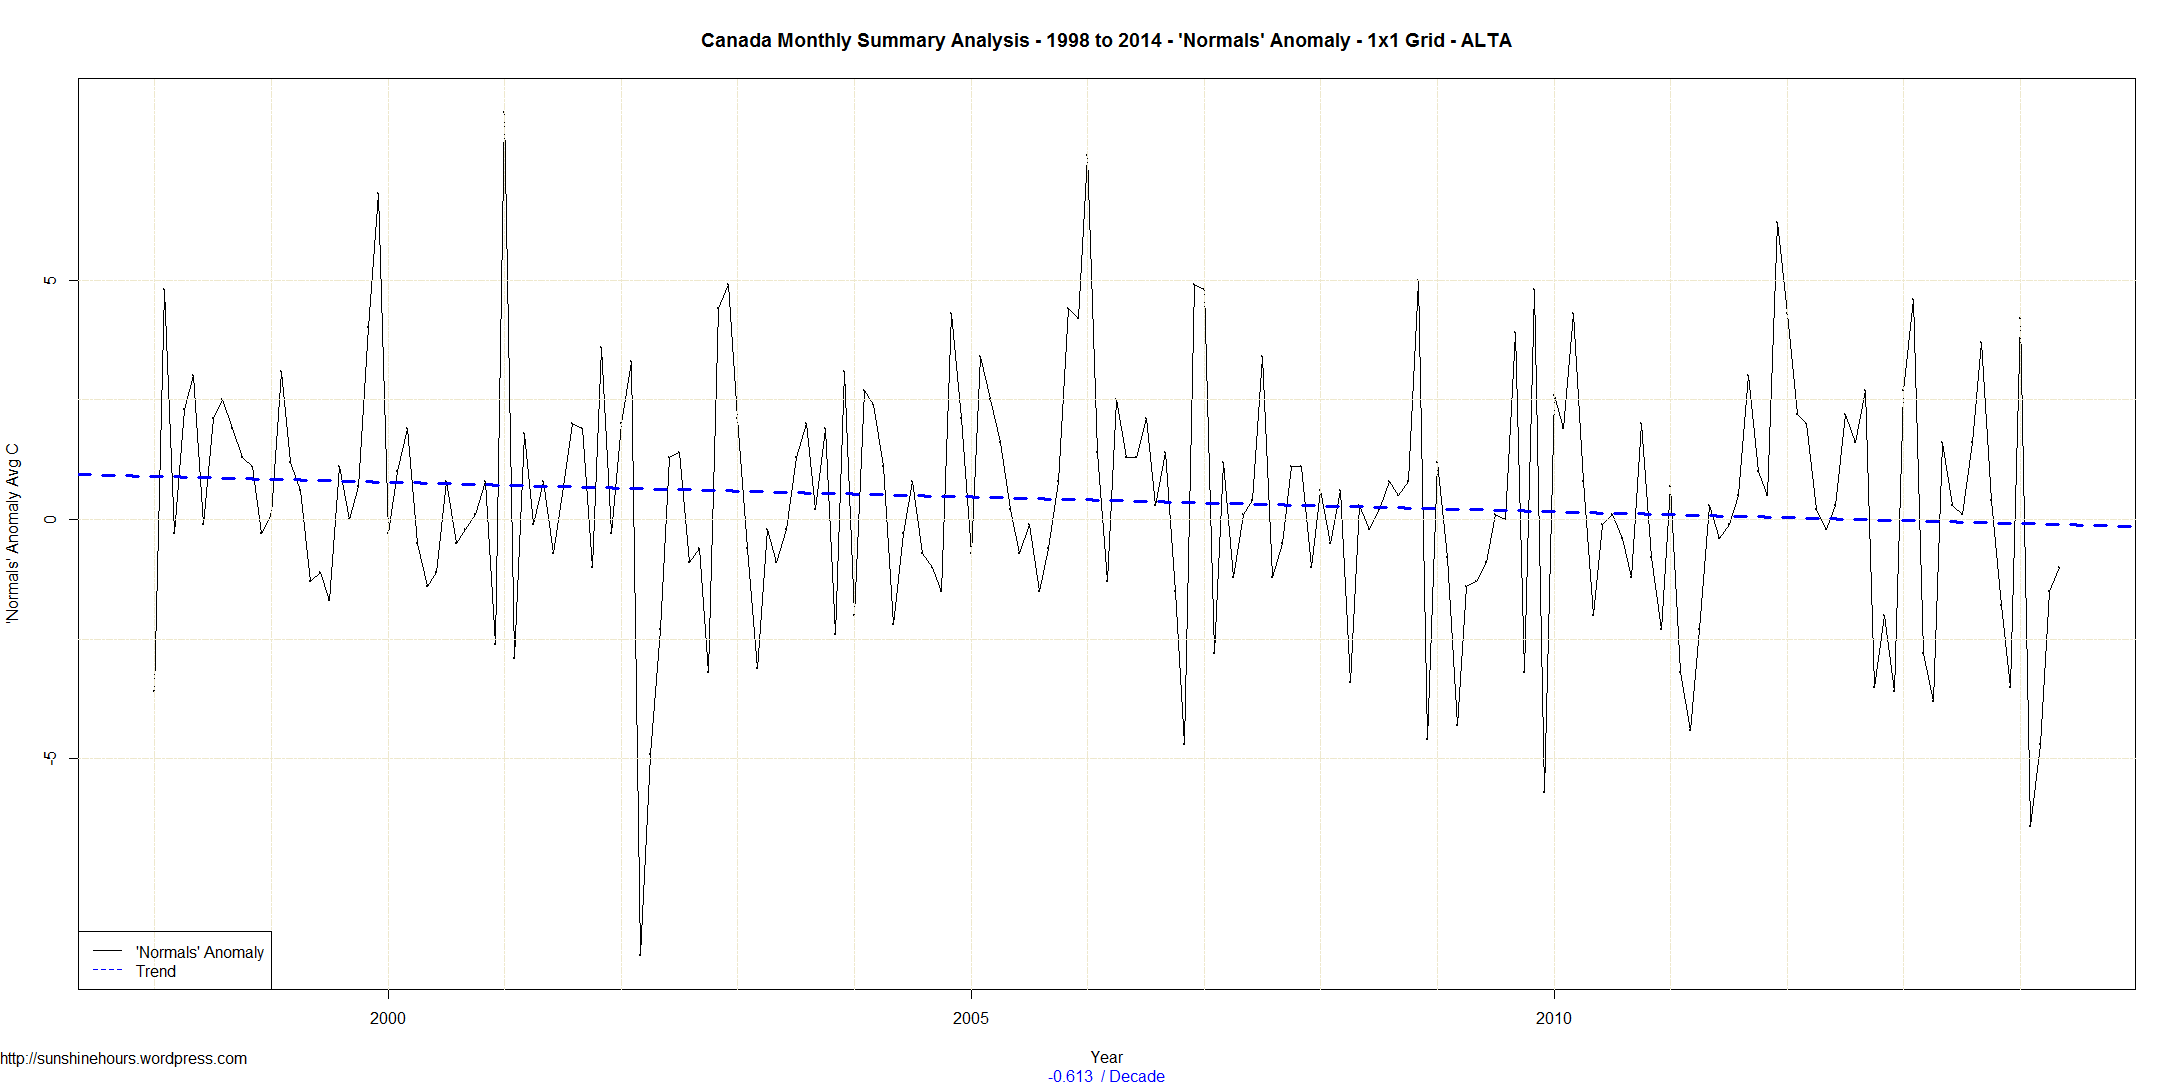
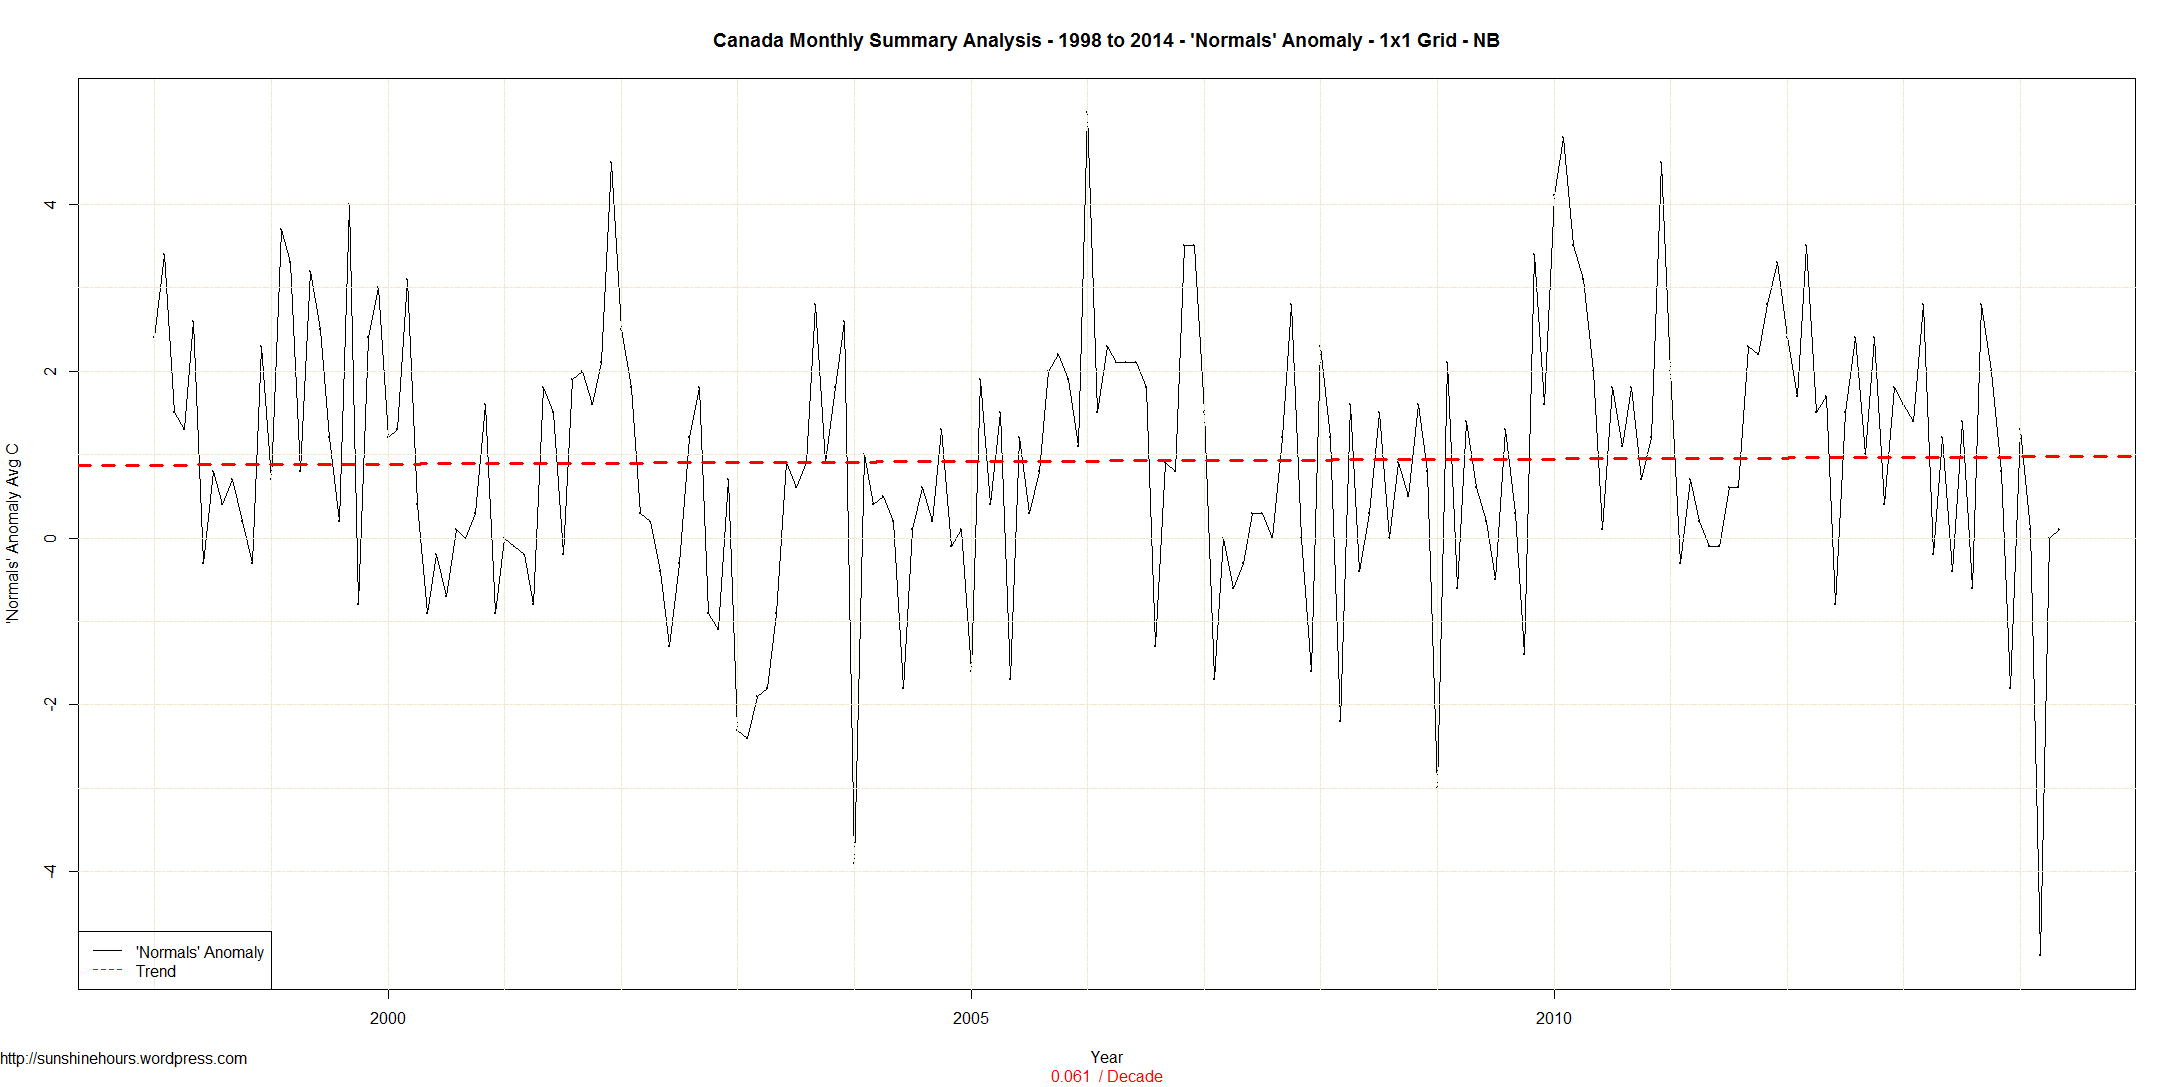
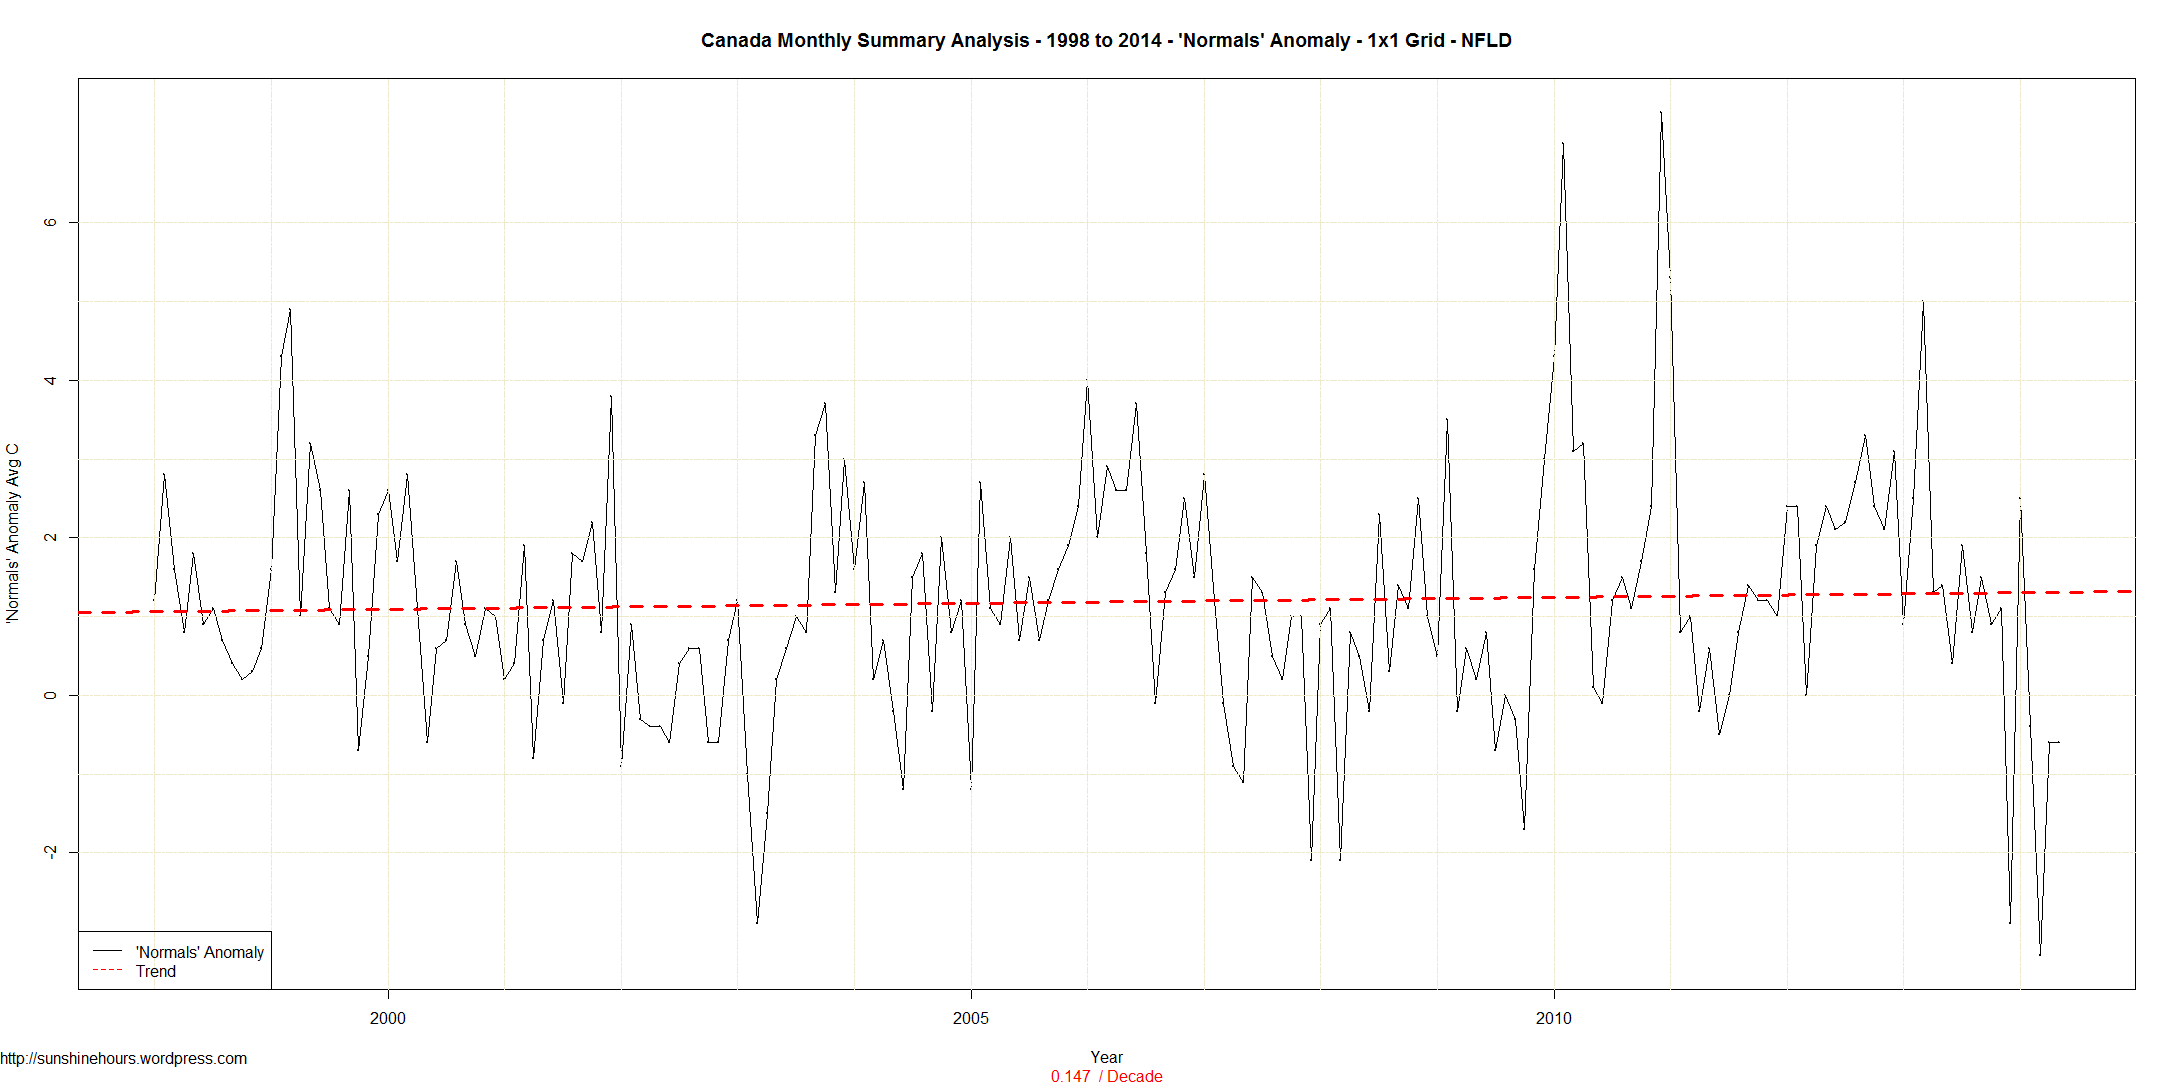
Here are the trends for each province.
All Provinces -0.32 C/decade
ALTA -0.61
BC -0.3
MAN -0.86
NB 0.06
NFLD 0.15
NS 0.02
NU 0.47
NWT -0.36
ONT -0.38
PEI 0.1
QUE 0.01
SASK -0.8
YT -0.21
And here are the graphs for each province and then one more for the whole country. Click For bigger.