Starfish Return – Warmer Temperatures To Blame?
Remember this headline:
Warming Temperatures Are Killing Millions of Starfish
Well …. now there is a new one … and it all happened during an El Nino when ocean temperatures were really high.
Starfish babies return in droves to Oregon and California after massive die-off
Droves of baby starfish are returning to Oregon and Northern California’s shores after a wasting disease decimated whole populations of the creatures over the past two years along the West Coast.
Data collected by Oregon State University researchers shows an unprecedented number of baby starfish, or sea stars, survived the summer and winter of 2015, the Eureka Times Standard reported Saturday.
“When we looked at the settlement of the larval sea stars on rocks in 2014 during the epidemic, it was the same or maybe even a bit lower than previous years,” Oregon State University marine biology professor Bruce Menge said in a statement.
“But a few months later, the number of juveniles was off the charts — higher than we’d ever seen — as much as 300 times normal.”
The cause of the massive outbreak remains unclear. Some have hypothesized it to be abnormally warm waters in the Pacific Ocean, which have wreaked havoc on marine ecosystems for the past two years.
Humboldt State University Marine Lab Director Brian Tissot disagrees with that hypothesis since the virus spread during colder months and didn’t expand as much during the abnormally warm 2015.
“There is no clear environmental cue,”
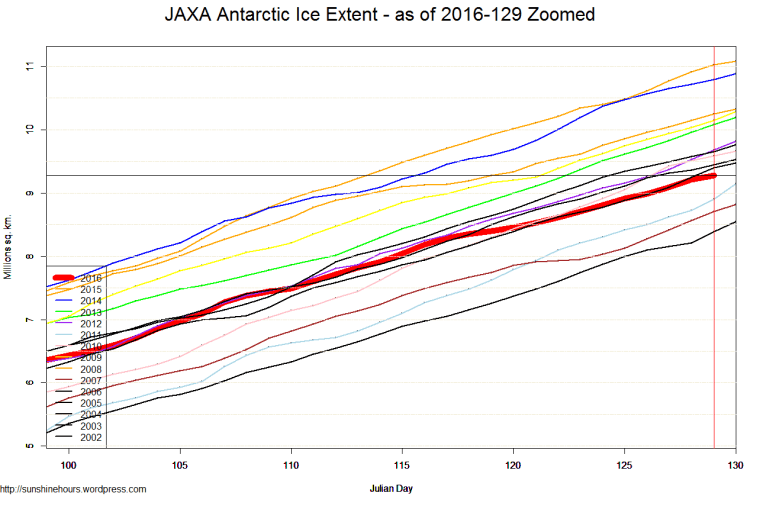
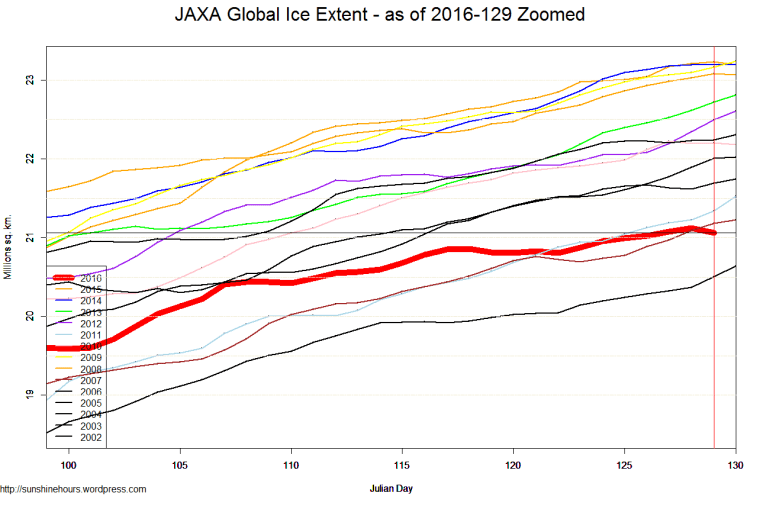
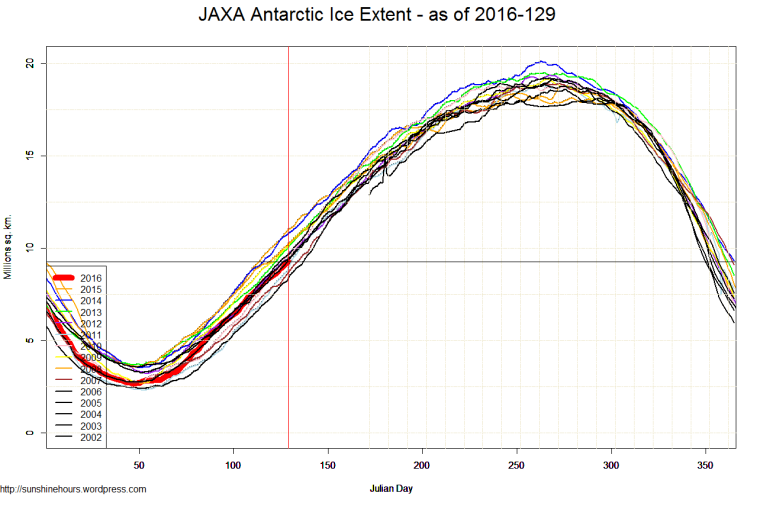
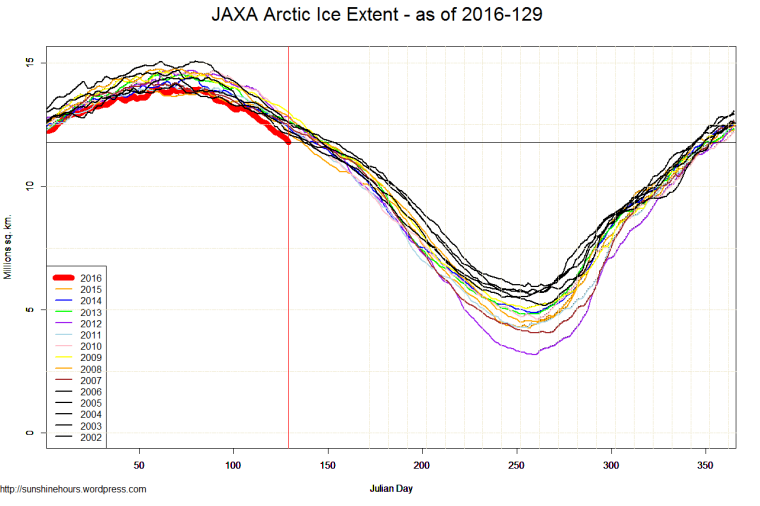
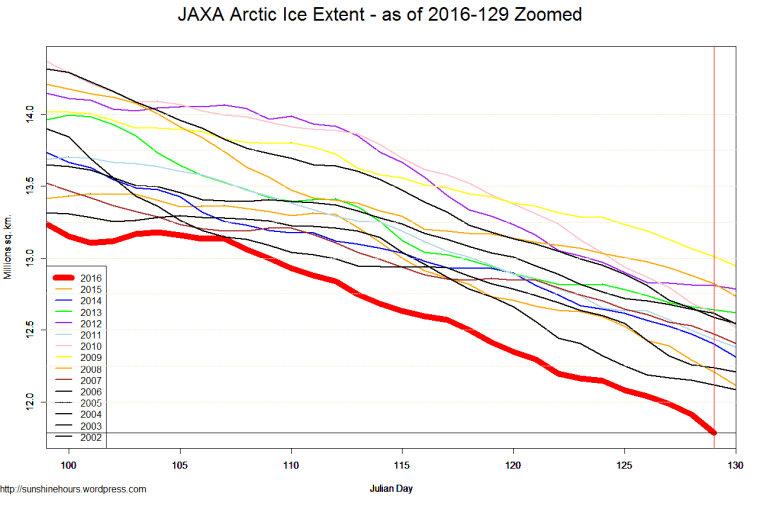
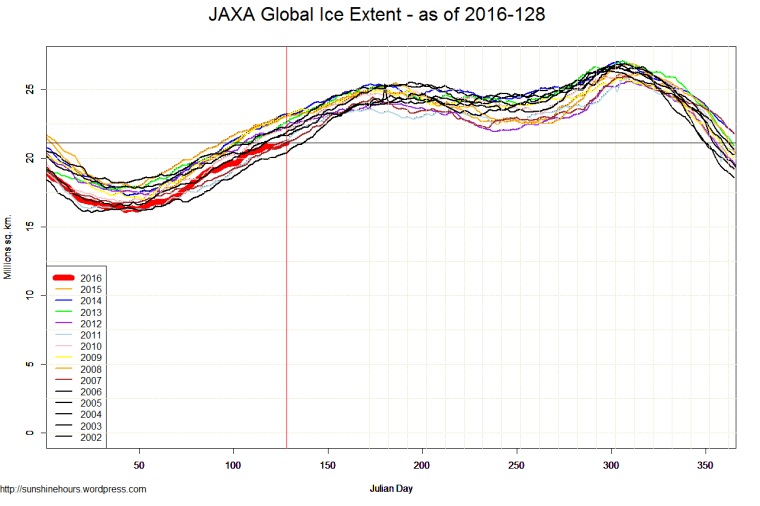
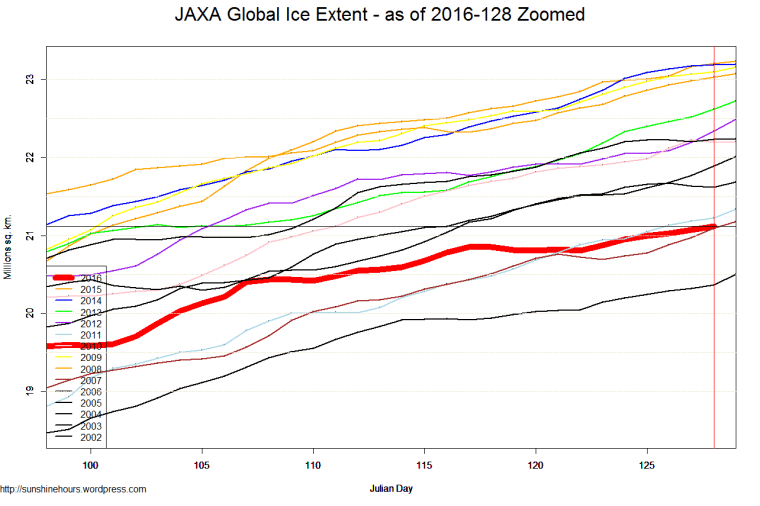
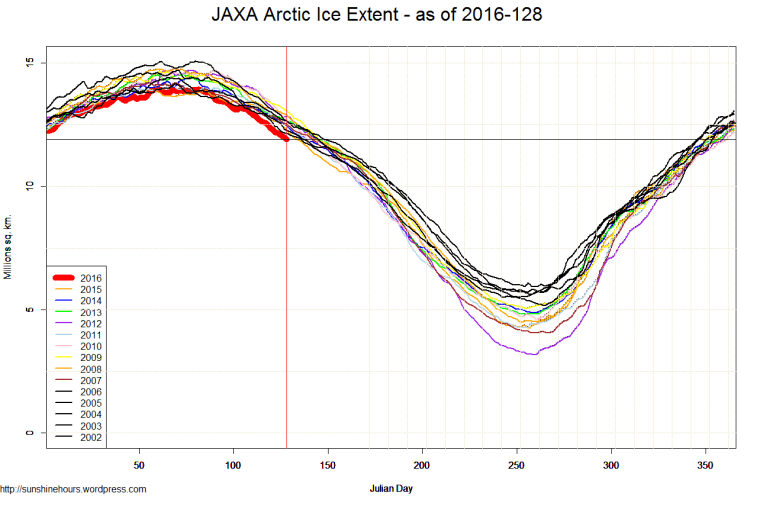
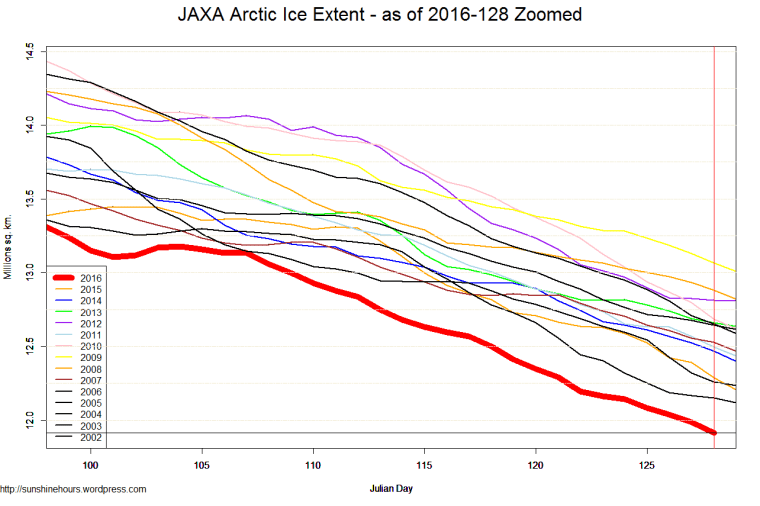
JAXA Sea Ice Extent (Antarctic and Arctic and Global) – Day 129 – 2016
JAXA sea ice extent data from Japanese Aerospace Exploration Agency.

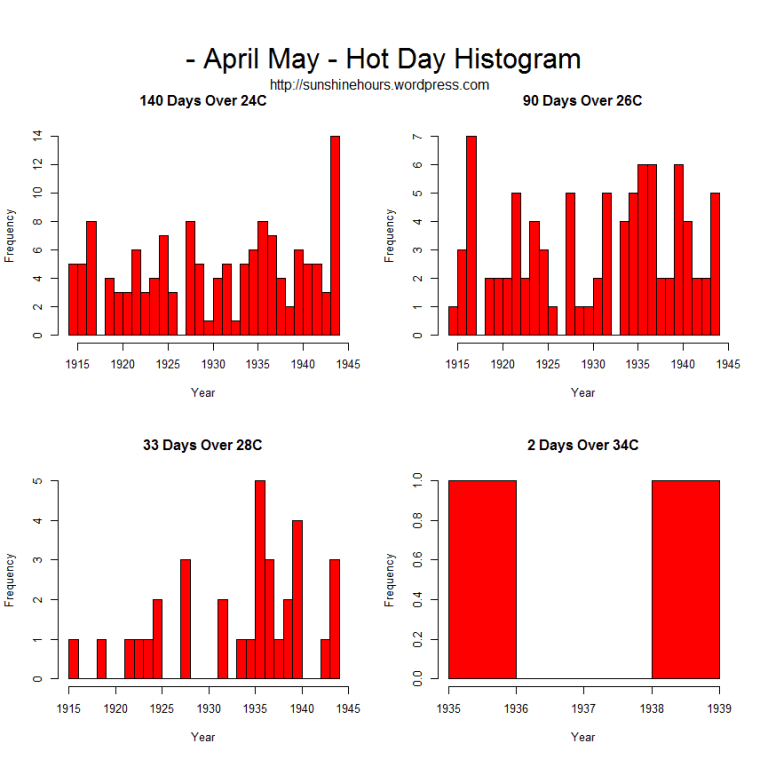
Fort McMurray – Jeff Masters – Hot Days Histogram
The other day I did a post point out that it did get hot in Fort McMurray in April and May.
That post (and this) is using data from Environment Canada for 1908 to 1944.
Remember what Jeff Masters said:
“Fort McMurray saw record daily highs of 91°F on Tuesday and 89°F on Wednesday. The city gets this warm on only about five days in a typical year, and those days are usually in July or August (even then, the average daily high is between 70°F and 75°F)”
I’ve done two sets of histograms using the 75F (24C) boundary suggested by Jeff Masters. One for April/May and One for July/Aug.
In April/May 1944 there were 14 days 24C and above.
In July/Aug 1944 there were 40 days 24C and above.

Green Plans to Burn Wood in Alberta Instead of Coal
The green lobbyists have big plans for some of the coal power plants Rachel Notley and the NDP plant to close down.
The are going to convert them to burn trees. And quadruple the price of electricity.
There is more than enough fibre both in Alberta and Canada to fuel a major expansion in pellet production to feed one or two large Alberta coal-fired plants without much of an impact in overall fibre availability. Presenter Jamie Stephen of Torchlight Bioresources estimates a gap between AAC and actual harvest of over 39 million bone dry tonnes (BDT) across Canada, as well as the availability of residues topping 30 million BDT.
AAC is Annual Allowable Cut.
The technology and processes are proven and expertise widely available to convert coal-fired plants to biomass. Presentations by Bill Strauss of FutureMetrics, Brent Boyko of OPG and Brian Moran of U.K. bioenergy giant Drax made that abundantly clear.
Burning trees instead of coal is the future because government lobbyists can make people do stupid things.
The execution gap is economic, something outlined with some precision all day, but driven home by Mark Mackay of Transalta, Corp. Transalta is one of the three major power generators in Alberta with coal fired assets on hand. “If we say the current power market in Alberta is paying roughly $22/Mwh, and biomass is looking like $85/Mwh, somehow we have to think that equation through. I think government policy will be a big part of getting this started.”
More lobbying to take an abundant resource (coal) and replace it with forests and charge consumers 4 times as much.
The bulk of available biomass in Alberta and neighbouring B.C. is controlled by the major forest tenure holders, and so any solution will have to include them. Several speakers and attendees suggest the provinces could adopt a ‘use it or lose it” approach like Ontario.
Burn trees or else.
The next step is to build off the momentum created by this gathering of varied interests in Edmonton. In the closing chat, both WPAC executive director Gord Murray and Transalta’s Mark Mackay agreed that parties should work together to get this viable peak option in front of policy makers in Alberta. “It’s clear to me from this meeting that biomass is an option worth looking into, and that the will is there in this group to make it work,” Mackay concluded. “But time is of the essence. We have to get in front of government with this, and soon.”
Lobby politicians with huge amounts of money and be quick about it! Or those idiots building windmills will get all the government subsidies.
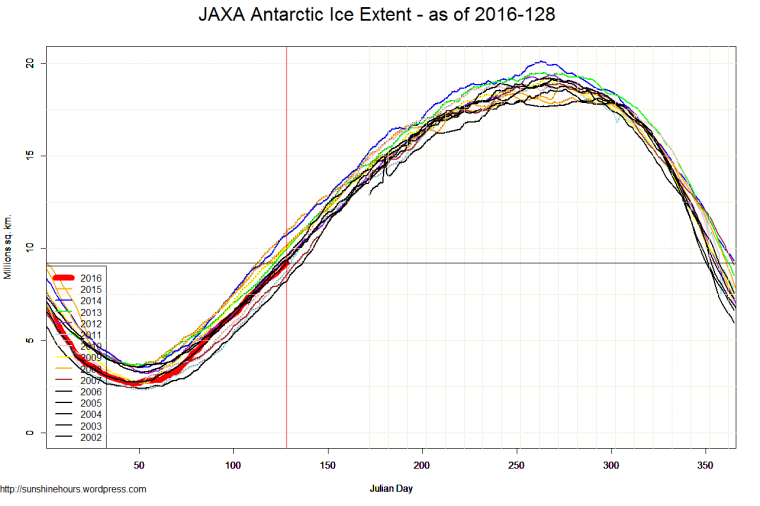
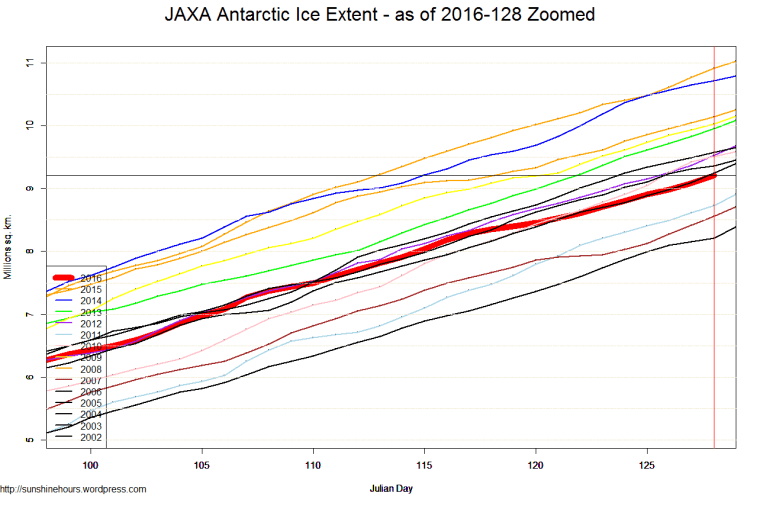
JAXA Sea Ice Extent (Antarctic and Arctic and Global) – Day 128 – 2016
JAXA sea ice extent data from Japanese Aerospace Exploration Agency.
Fort McMurray – April and May
The other day I did a post pointing out that most of the really hot temperature records in Canada occurred 1936 to 1941.
Then I did a post about Jeff Masters at Wunderground claiming it never got this hot in Fort McMurray before in May.
I had only found monthly data before 1944. Reader Fred found pre-1944 daily data under the name “Ft McMurray”.
Jeff Masters said:
“Fort McMurray saw record daily highs of 91°F on Tuesday and 89°F on Wednesday. The city gets this warm on only about five days in a typical year, and those days are usually in July or August (even then, the average daily high is between 70°F and 75°F)”
Lets look at the data! Wow!!!!! And this was before 80,000 people and all the UHI moved in.
10 Warmest April Days Before 1944
| Date | Max Temp C | Max Temp F |
| 1939-04-29 | 35 | 95 |
| 1939-04-28 | 28.3 | 82.9 |
| 1941-04-30 | 27.8 | 82 |
| 1941-04-26 | 27.2 | 81 |
| 1941-04-29 | 27.2 | 81 |
| 1924-04-26 | 26.7 | 80.1 |
| 1915-04-29 | 26.1 | 79 |
| 1931-04-29 | 26.1 | 79 |
| 1915-04-24 | 25.6 | 78.1 |
| 1943-04-14 | 25.6 | 78.1 |
10 Warmest May Days Before 1944
| Date | Max Temp C | Max Temp F |
| 1936-05-29 | 36.7 | 98.1 |
| 1916-05-21 | 33.9 | 93 |
| 1936-05-28 | 33.3 | 91.9 |
| 1944-05-04 | 33.3 | 91.9 |
| 1934-05-25 | 32.8 | 91 |
| 1944-05-28 | 32.8 | 91 |
| 1919-05-19 | 32.2 | 90 |
| 1936-05-26 | 32.2 | 90 |
| 1940-05-23 | 32.2 | 90 |
| 1924-05-14 | 31.7 | 89.1 |
For fun, lets look at the whole year.
| Date | Max Temp C | Max Temp F |
| 1941-07-18 | 38.9 | 102 |
| 1916-07-02 | 37.8 | 100 |
| 1916-07-31 | 36.7 | 98.1 |
| 1924-07-02 | 36.7 | 98.1 |
| 1936-05-29 | 36.7 | 98.1 |
| 1937-06-29 | 36.7 | 98.1 |
| 1944-06-29 | 36.7 | 98.1 |
| 1941-07-15 | 35.6 | 96.1 |
| 1941-07-16 | 35.6 | 96.1 |
| 1918-07-10 | 35 | 95 |
| 1924-07-01 | 35 | 95 |
| 1939-04-29 | 35 | 95 |
| 1939-08-04 | 35 | 95 |
| 1916-06-30 | 34.4 | 93.9 |
| 1917-07-16 | 34.4 | 93.9 |
| 1919-06-20 | 34.4 | 93.9 |
| 1927-07-24 | 34.4 | 93.9 |
| 1930-07-14 | 34.4 | 93.9 |
| 1910-06-11 | 33.9 | 93 |
| 1916-05-21 | 33.9 | 93 |
| 1916-08-26 | 33.9 | 93 |
| 1925-06-28 | 33.9 | 93 |
| 1925-08-02 | 33.9 | 93 |
| 1926-07-05 | 33.9 | 93 |
| 1936-06-23 | 33.9 | 93 |
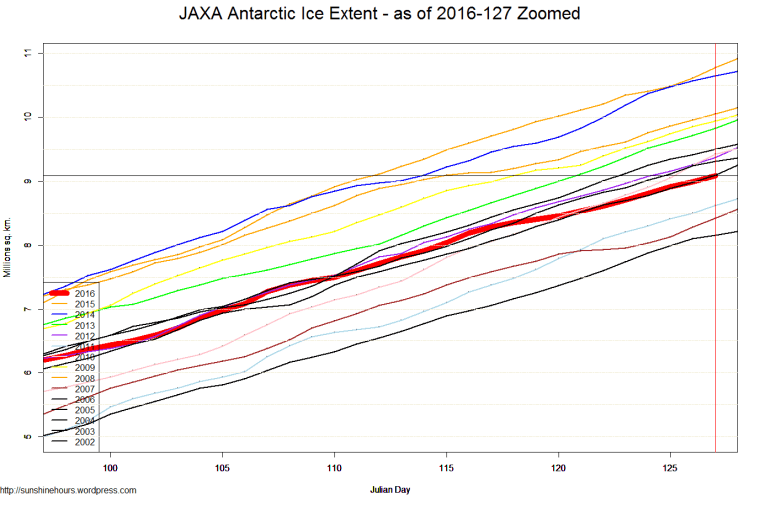
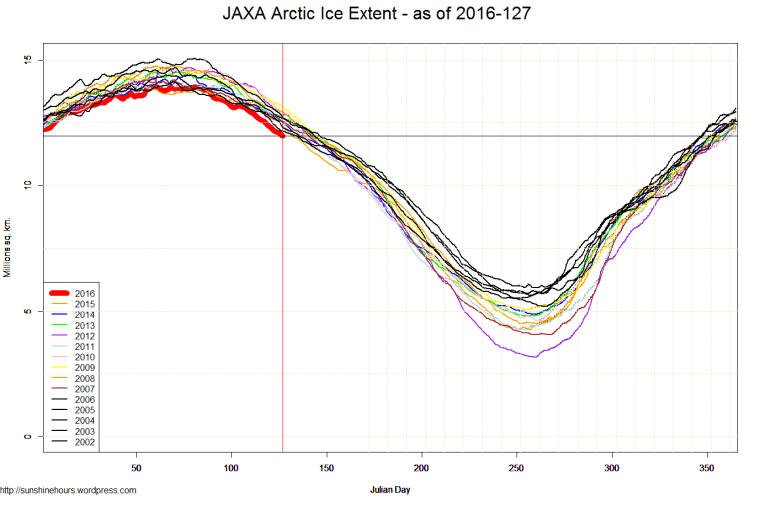
JAXA Sea Ice Extent (Antarctic and Arctic and Global) – Day 127 – 2016
JAXA sea ice extent data from Japanese Aerospace Exploration Agency.


Benefits Of Global Warming
A good article by Bjorn Lomborg.
If our climate conversation managed to include the good along with the bad, we would have a much better understanding of our options. Last week, a study in the prestigious journal Nature revealed just how much CO₂ increases have greened the Earth over the past three decades. Because CO₂ acts as a fertilizer, as much as half of all vegetated land is persistently greener today. This ought to be a cause for great joy.
The biggest study on heat and cold deaths, published last year in Lancet, examined more than 74 million deaths from 384 locations in 13 countries from cold Sweden to hot Thailand. The researchers found that heat causes almost one-half of one percent of all deaths, while more than 7 percent are caused by cold.
Indeed, climate-related deaths have droppedfrom half a million per year in the 1920s to less than 25,000 per year in the 2010s. A recent Nature studyexpecting more severe hurricanes from global warming still found that damages would halve from 0.04 per cent to 0.02 per cent of global GDP, because the increased ferocity would be more than made up by increased prosperity and resilience.
Read the rest.
Fort McMurray and Climate Change and “Scientists”
Yesterday I did a post pointing out that most of the really hot temperature records in Canada occurred 1936 to 1941.
Today I noticed that Jeff Masters at Wunderground was claiming it never got this hot in Fort McMurray before in May.
I’ll just post a few quick facts.
- The monthly data for Fort McMurray only goes back to 1944. I doubt daily goes further back.
- The really hot years were the 1936 – 1941 years. So temperature records missed the 1936-1941 period.
Here are the ten warmest May’s (in terms of TX = Tmax) in For McMurray from 1944 on.
| Year | Month | Tx | Tn | Tm |
| 1986 | 5 | 34.8 | -3 | 11.6 |
| 1944 | 5 | 32.8 | -7.8 | 12 |
| 1961 | 5 | 32.8 | -5.6 | 10 |
| 1971 | 5 | 32.8 | -5.6 | 12.3 |
| 1995 | 5 | 32.8 | -6.7 | 10.5 |
| 2003 | 5 | 31.3 | -5.4 | 9.3 |
| 1972 | 5 | 31.1 | -6.7 | 12 |
| 1987 | 5 | 30.8 | -6.9 | 11.1 |
| 1948 | 5 | 30.6 | -4.4 | 11.1 |
| 1980 | 5 | 30.6 | -3.8 | 11.2 |
