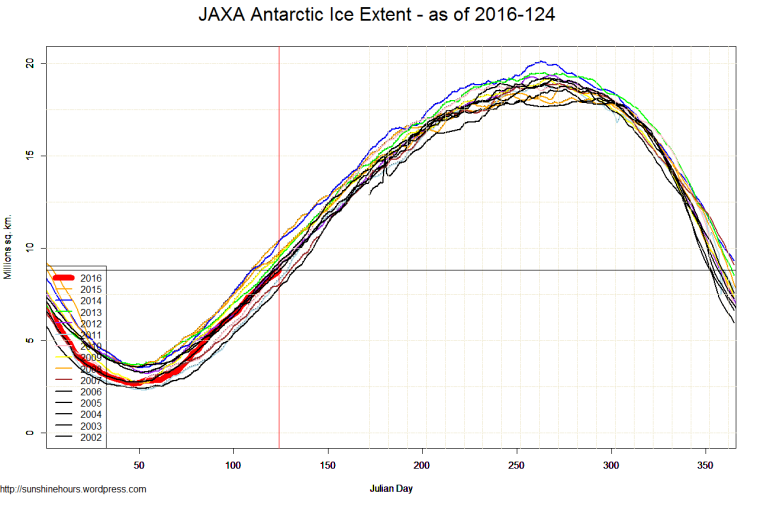
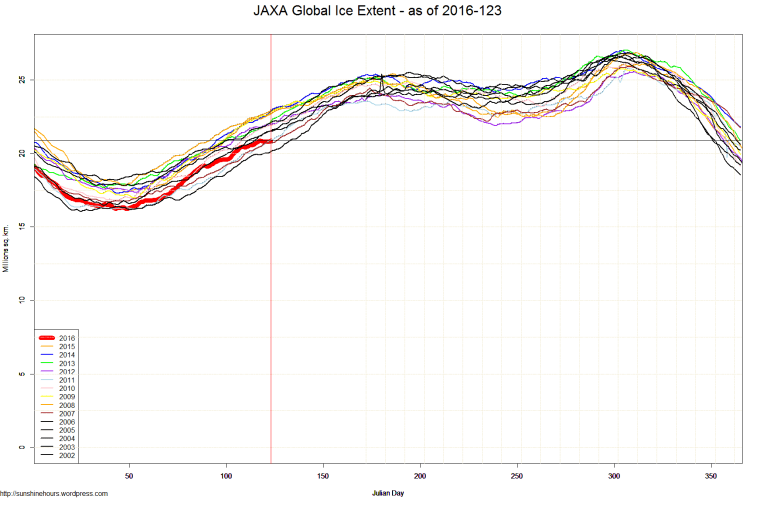
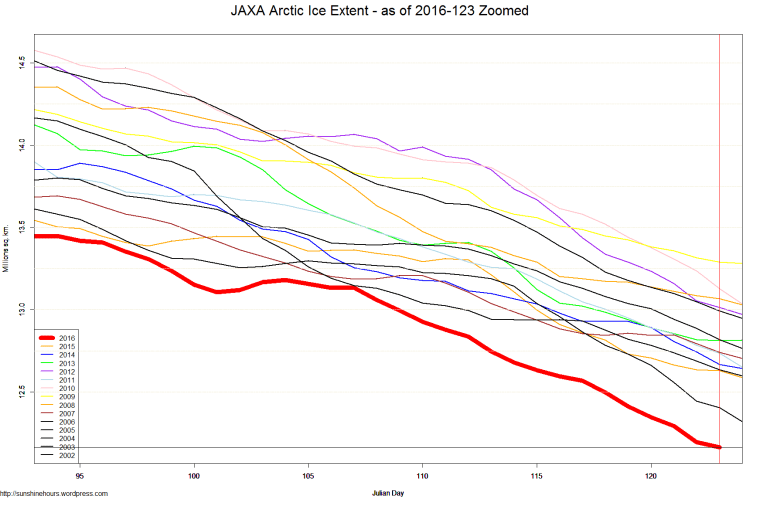
JAXA sea ice extent data from Japanese Aerospace Exploration Agency.
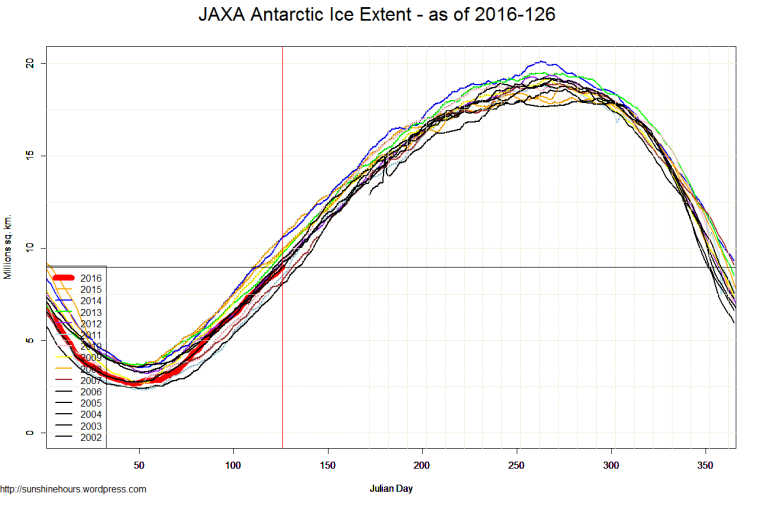

JAXA sea ice extent data from Japanese Aerospace Exploration Agency.
Environmentalism = Cold Blooded Eagle Slaughterers
Don’t get in the way of crony capitalists making huge subsidies.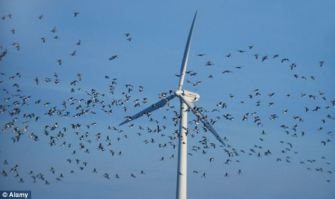
The Obama administration is revising a federal rule that allows wind-energy companies to operate high-speed turbines for up to 30 years, even if means killing or injuring thousands of federally protected bald and golden eagles.
Under the plan announced Wednesday, companies could kill or injure up to 4,200 bald eagles a year without penalty — nearly four times the current limit. Golden eagles could only be killed if companies take steps to minimize the losses, for instance, by retrofitting power poles to reduce the risk of electrocution.
More here.
Fort McMurray Alberta, Canada is burning. 1,600 homes so far.
Some people have already started blaming “Climate Change”.
Here is wikipedia’s list of hottest temperatures ever recorded in Canada. 1937, 1936, 1941 …. You have to go to the bottom of the list to find one from 1960 and one from 1961. Look up dustbowl (but be careful … wikepedia and others blame the following temperatures on bad plowing techniques)
| Date Recorded | Location | Temperature |
|---|---|---|
| July 5, 1937 | Midale, Saskatchewan | 45.0 °C |
| July 5, 1937 | Yellow Grass, Saskatchewan | 45.0 °C |
| July 11, 1936 | St. Albans, Manitoba | 44.4 °C |
| July 11, 1936 | Emerson, Manitoba | 44.4 °C |
| July 5, 1937 | Fort Qu’Appelle, Saskatchewan | 44.4 °C |
| July 16, 1941 | Lillooet, British Columbia | 44.4 °C |
| July 16, 1941 | Lytton, British Columbia | 44.4 °C |
| July 17, 1941 | Lillooet, British Columbia | 44.4 °C |
| July 17, 1941 | Lytton, British Columbia | 44.4 °C |
| July 17, 1941 | Chinook Cove, British Columbia | 44.4 °C |
| July 29, 1934 | Rock Creek, British Columbia | 43.9 °C |
| July 5, 1936 | Midale, Saskatchewan | 43.9 °C |
| July 11, 1936 | Emerson, Manitoba | 43.9 °C |
| July 11, 1936 | Morden, Manitoba | 43.9 °C |
| July 4, 1937 | Rosetown, Saskatchewan | 43.9 °C |
| July 5, 1937 | Regina, Saskatchewan | 43.9 °C |
| July 16, 1941 | Oliver, British Columbia | 43.9 °C |
| June 23, 1900 | Cannington, Saskatchewan | 43.3 °C |
| June 25, 1919 | Dauphin, Manitoba | 43.3 °C |
| July 31, 1926 | Fort Qu’Appelle, Saskatchewan | 43.3 °C |
| July 24, 1927 | Greenwood, British Columbia | 43.3 °C |
| July 25, 1931 | Fort Qu’Appelle, Saskatchewan | 43.3 °C |
| July 5, 1936 | Estevan, Saskatchewan | 43.3 °C |
| July 7, 1936 | Emerson, Manitoba | 43.3 °C |
| July 11, 1936 | Waskada, Manitoba | 43.3 °C |
| July 11, 1936 | Virden, Manitoba | 43.3 °C |
| July 11, 1936 | Brandon, Manitoba | 43.3 °C |
| July 11, 1936 | Greenfell, Saskatchewan | 43.3 °C |
| July 5, 1937 | Moose Jaw, Saskatchewan | 43.3 °C |
| July 5, 1937 | Grenfell, Saskatchewan | 43.3 °C |
| July 5, 1937 | Francis, Saskatchewan | 43.3 °C |
| July 5, 1937 | Regina, Saskatchewan | 43.3 °C |
| July 5, 1937 | Estevan, Saskatchewan | 43.3 °C |
| July 5, 1937 | Carlyle, Saskatchewan | 43.3 °C |
| July 12, 1937 | Regina, Saskatchewan | 43.3 °C |
| July 27, 1939 | Oliver, British Columbia | 43.3 °C |
| July 17, 1941 | Oliver, British Columbia | 43.3 °C |
| July 17, 1941 | Skagit River, British Columbia | 43.3 °C |
| July 19, 1941 | Elbow, Saskatchewan | 43.3 °C |
| July 19, 1941 | Lumsden, Saskatchewan | 43.3 °C |
| August 6, 1949 | Rosetown, Saskatchewan | 43.3 °C |
| July 19, 1960 | Newgate, British Columbia | 43.3 °C |
| August 5, 1961 | Maple Creek, Saskatchewan | 43.3 °C |
Wow. Isn’t one of the signs of a first world economy a stable reliable electrical grid?
Not anymore. Green stupidity is amazing.
Sainsbury’s has cast doubt on the UK’s ability to keep the lights on, revealing it has built a string of new power plants for its supermarkets in part due to fears of a looming energy crunch.
Paul Crewe, a senior executive at the supermarket giant, said he had sleepless nights over energy security and feared UK electricity demand could soon outstrip supply.
The new gas-fired power generators – already supplying electricity for 10 supermarkets, and due to be built at a further six this year – would enable the stores to keep trading even in the event of a blackout, he said.
“It gives us energy security,” Mr Crewe said. “Energy security is extremely important, it keeps me awake at night if I’m honest thinking about it – especially as we use just under one per cent of power in the UK. We know UK grid infrastructure is at an extremely stretching period of time.”
He raised concerns about the UK being “reliant on interconnectors from Europe and gas from the Baltic and Russia”.
“Having the ability to generate our own power at a local level gives us surety of supply at these locations as the availability of electricity becomes more stretched across the national grid infrastructure, with demand potentially outstripping supply in the near future,” he said.
– See more at: http://www.thegwpf.com/sainsburys-builds-its-own-power-plants-amid-energy-shortage-fears
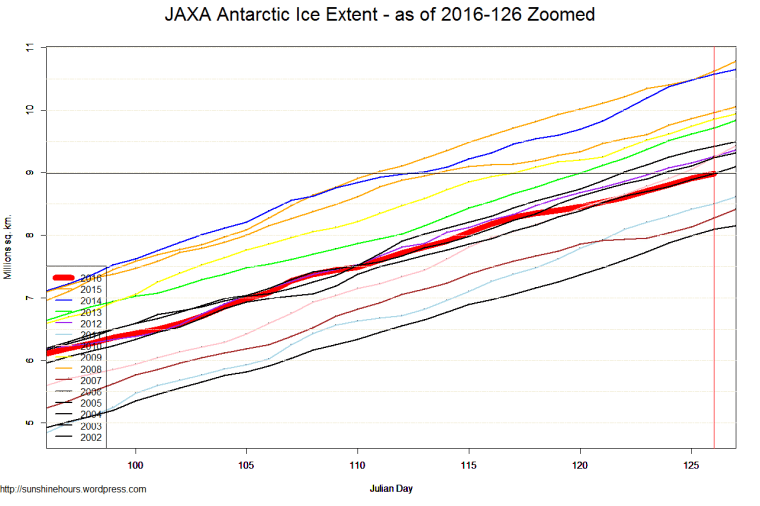
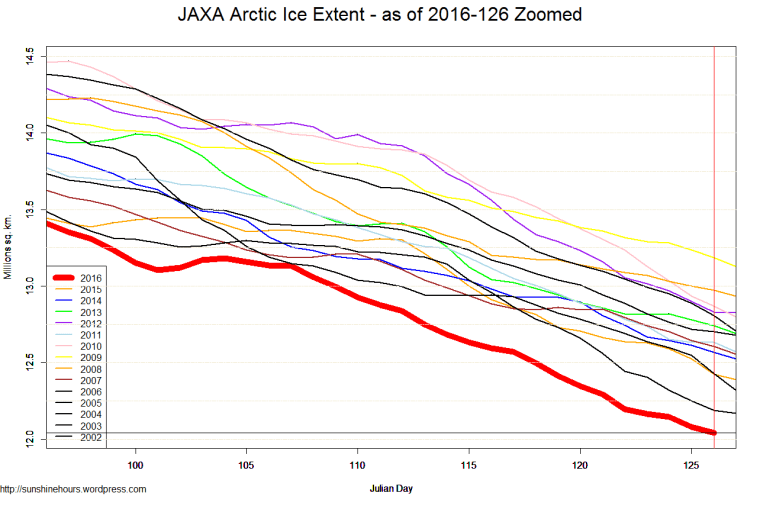
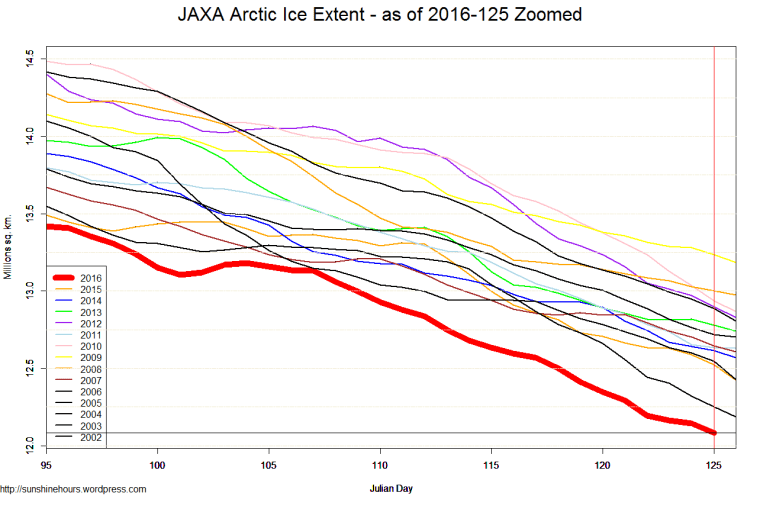
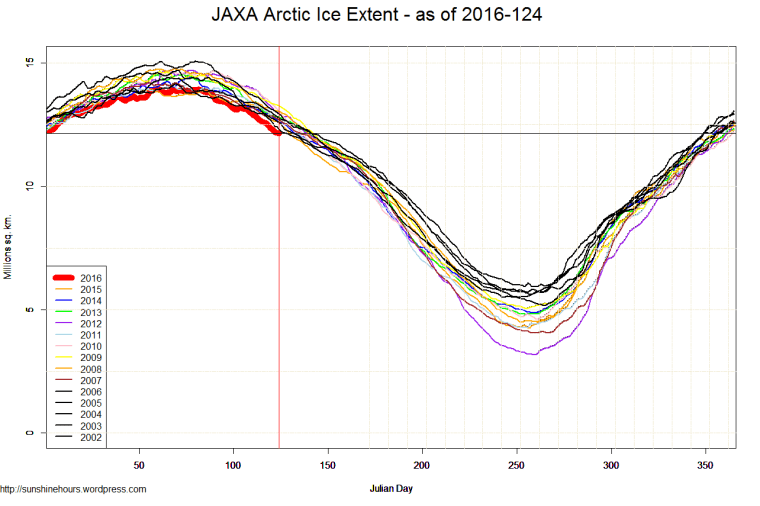
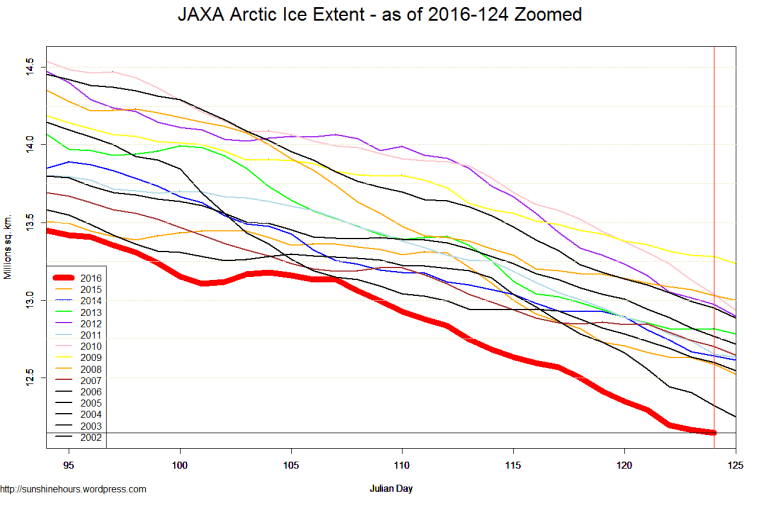
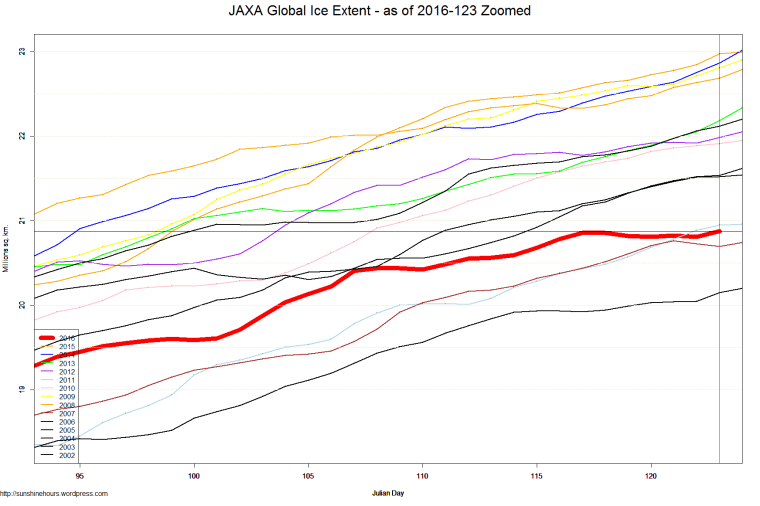
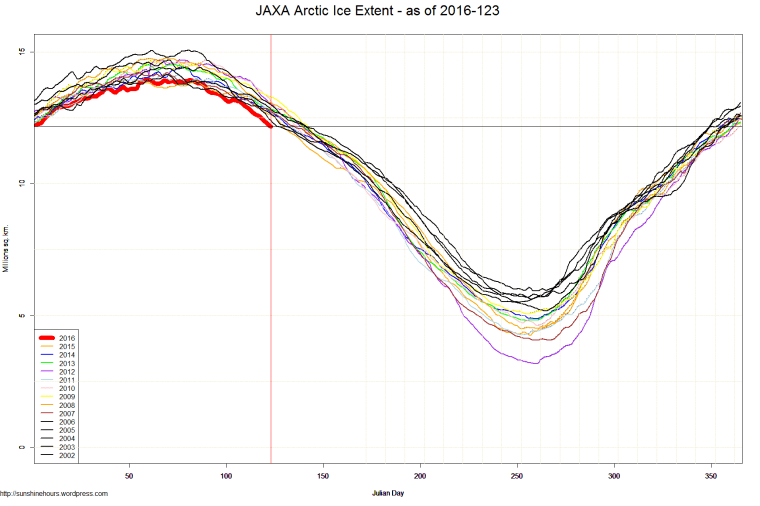
JAXA sea ice extent data from Japanese Aerospace Exploration Agency.
Arctic for day 125 is only 168,000 sq km below 2006.


Tree rings are magical. Not only can you reconstruct temperatures from the past, but you can reconstruct droughts (rainfall).
Whenever I see the word “novel approach” I worry we are in for BS.
However, since the authors of this paper are saying things were worse in the past than present I like to pretend I believe them.
They also sort of say that more dendrohydrologists are needed. Surprise.
Recent streamflow droughts in south coastal British Columbia have had major socioeconomic and ecological impacts. Increasing drought severity under projected climate change poses serious water management challenges, particularly in the small coastal watersheds that serve as primary water sources for most communities in the region. A 332-year dendrohydrological record of regionalized mean summer streamflow for four watersheds is analyzed to place recent drought magnitudes in a long-term perspective.
We present a novel approach for optimizing tree-ring based reconstructions in small watersheds in temperate environments, combining winter snow depth and summer drought sensitive proxies as model predictors. The reconstruction model, estimated by regression of observed flows on Tsuga mertensiana ring-width variables and a tree-ring derived paleorecord of the Palmer Drought Severity Index, explains 64% of the regionalized streamflow variance.
The model is particularly accurate at estimating lowest flow events, and provides the strongest annually resolved paleohydrological record in British Columbia. The extended record suggests that since 1658 sixteen natural droughts have occurred that were more extreme than any within the instrumental period. Flow-duration curves show more severe worst-case scenario droughts and a higher probability of those droughts in the long-term reconstruction than in the hydrometric data.
Such curves also highlight the value of dendrohydrology for probabilistic drought assessment. Our results suggest current water management strategies based on worst-case scenarios from historical gauge data likely underestimate the potential magnitudes of natural droughts. If the low-flow magnitudes anticipated under climate change co-occur with lowest possible natural flows, streamflow drought severities in small watersheds in south coastal British Columbia could exceed any of those experienced in the past ∼350 years.
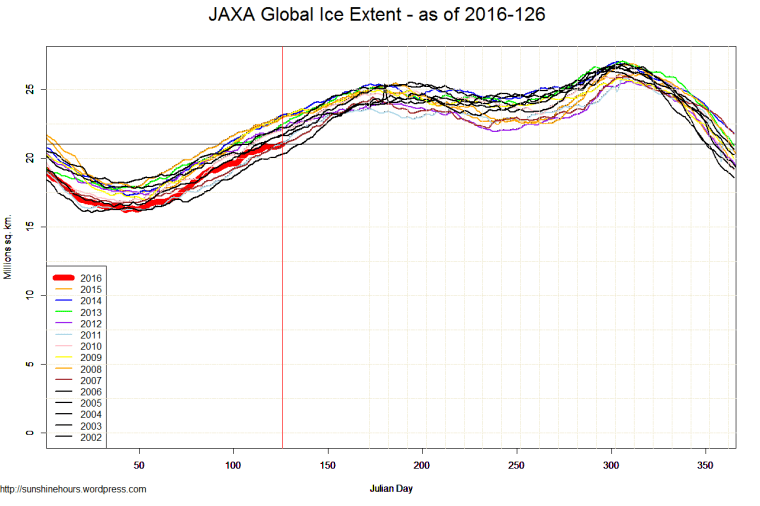
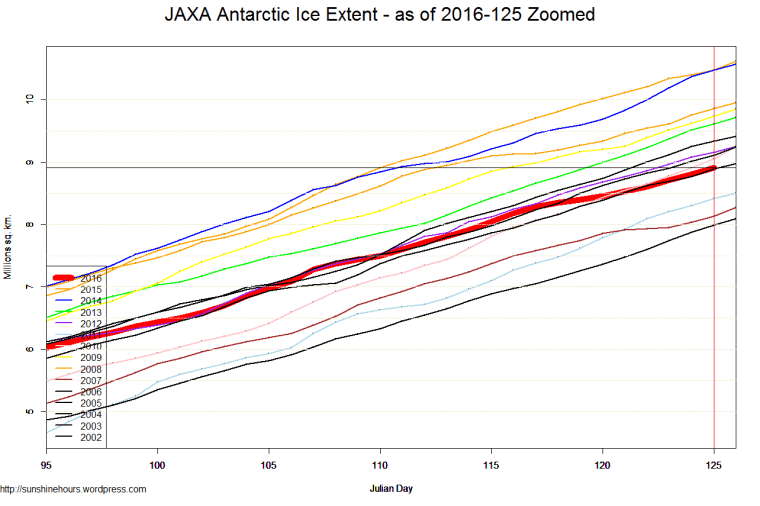
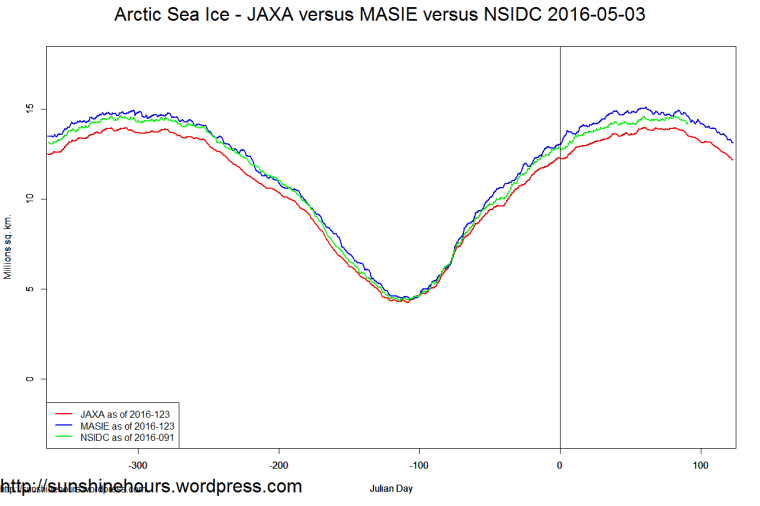
JAXA sea ice extent data from Japanese Aerospace Exploration Agency.
JAXA tends to show extent lower than NSIDC (which is broken due to satellite issues)

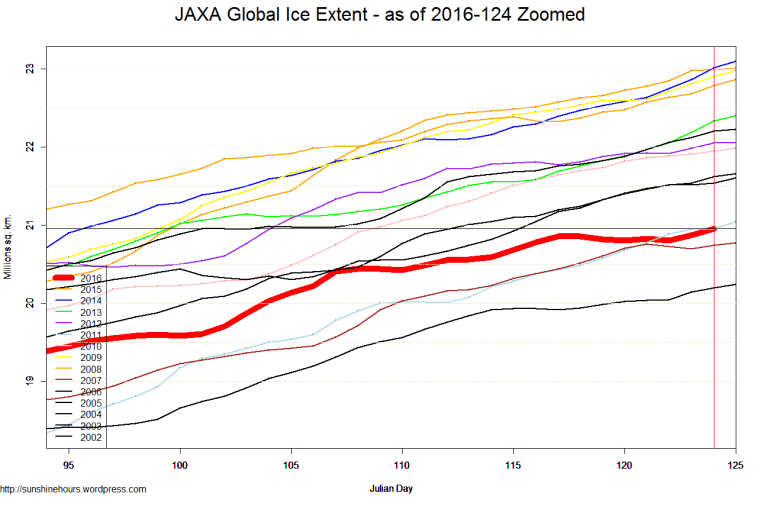
NSIDC is truncated at day 91 due to satellite problems. But they are updating the ftp site. Maybe in preparation of going live again.
JAXA always runs lower than NSIDC. AND NSIDC mostly runs lower than MASIE.
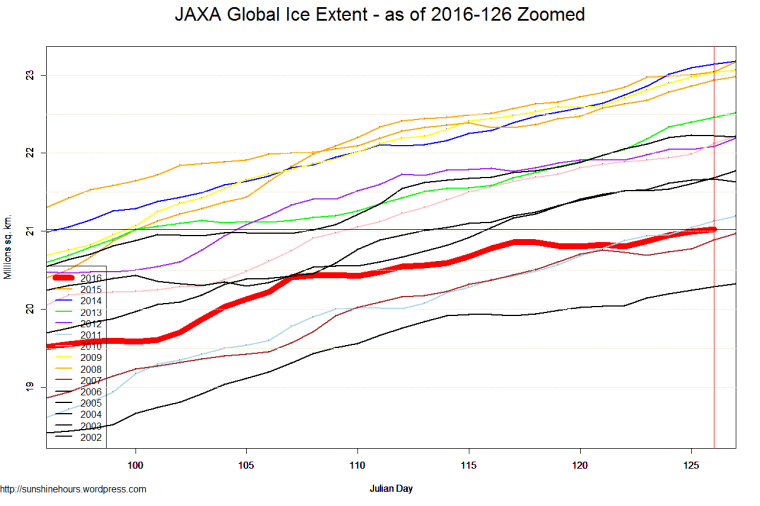
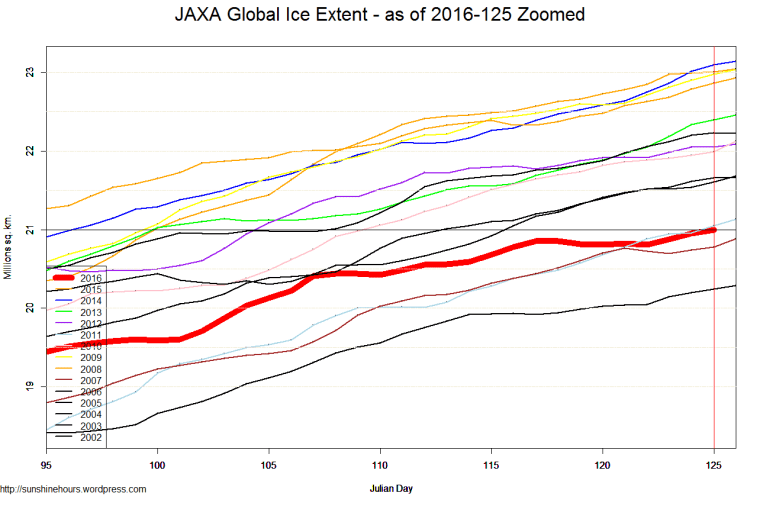
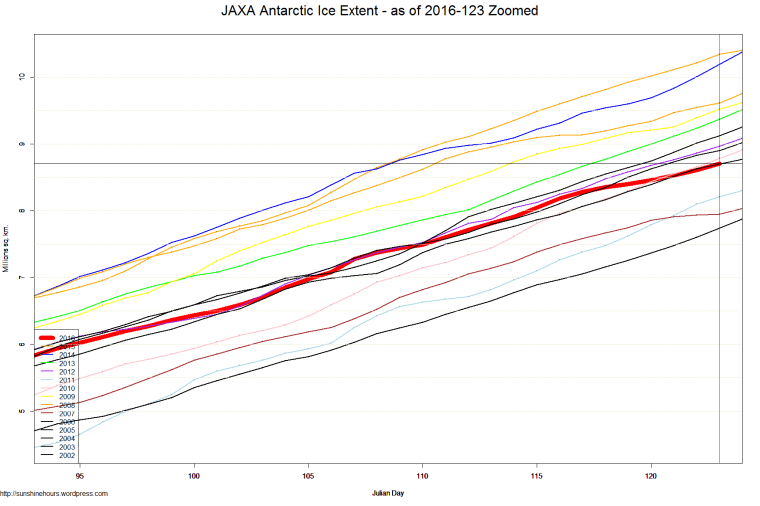
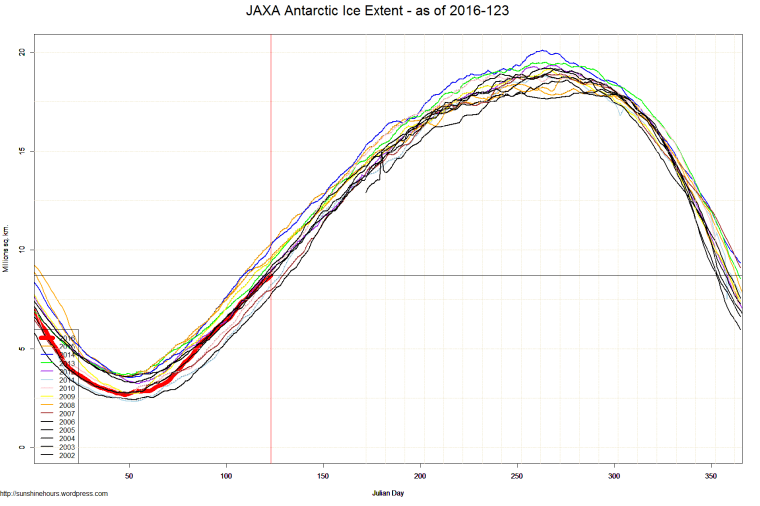
JAXA sea ice extent data from Japanese Aerospace Exploration Agency.
I used to watch Almost Live a long time ago on a Seattle TV station. And I remember Bill Nye comedian.
