Arctic Sea Ice Extent Sep 05 2014 – -991,000 sq km below the 1981-2010 mean. Data for Day 247. Data here.
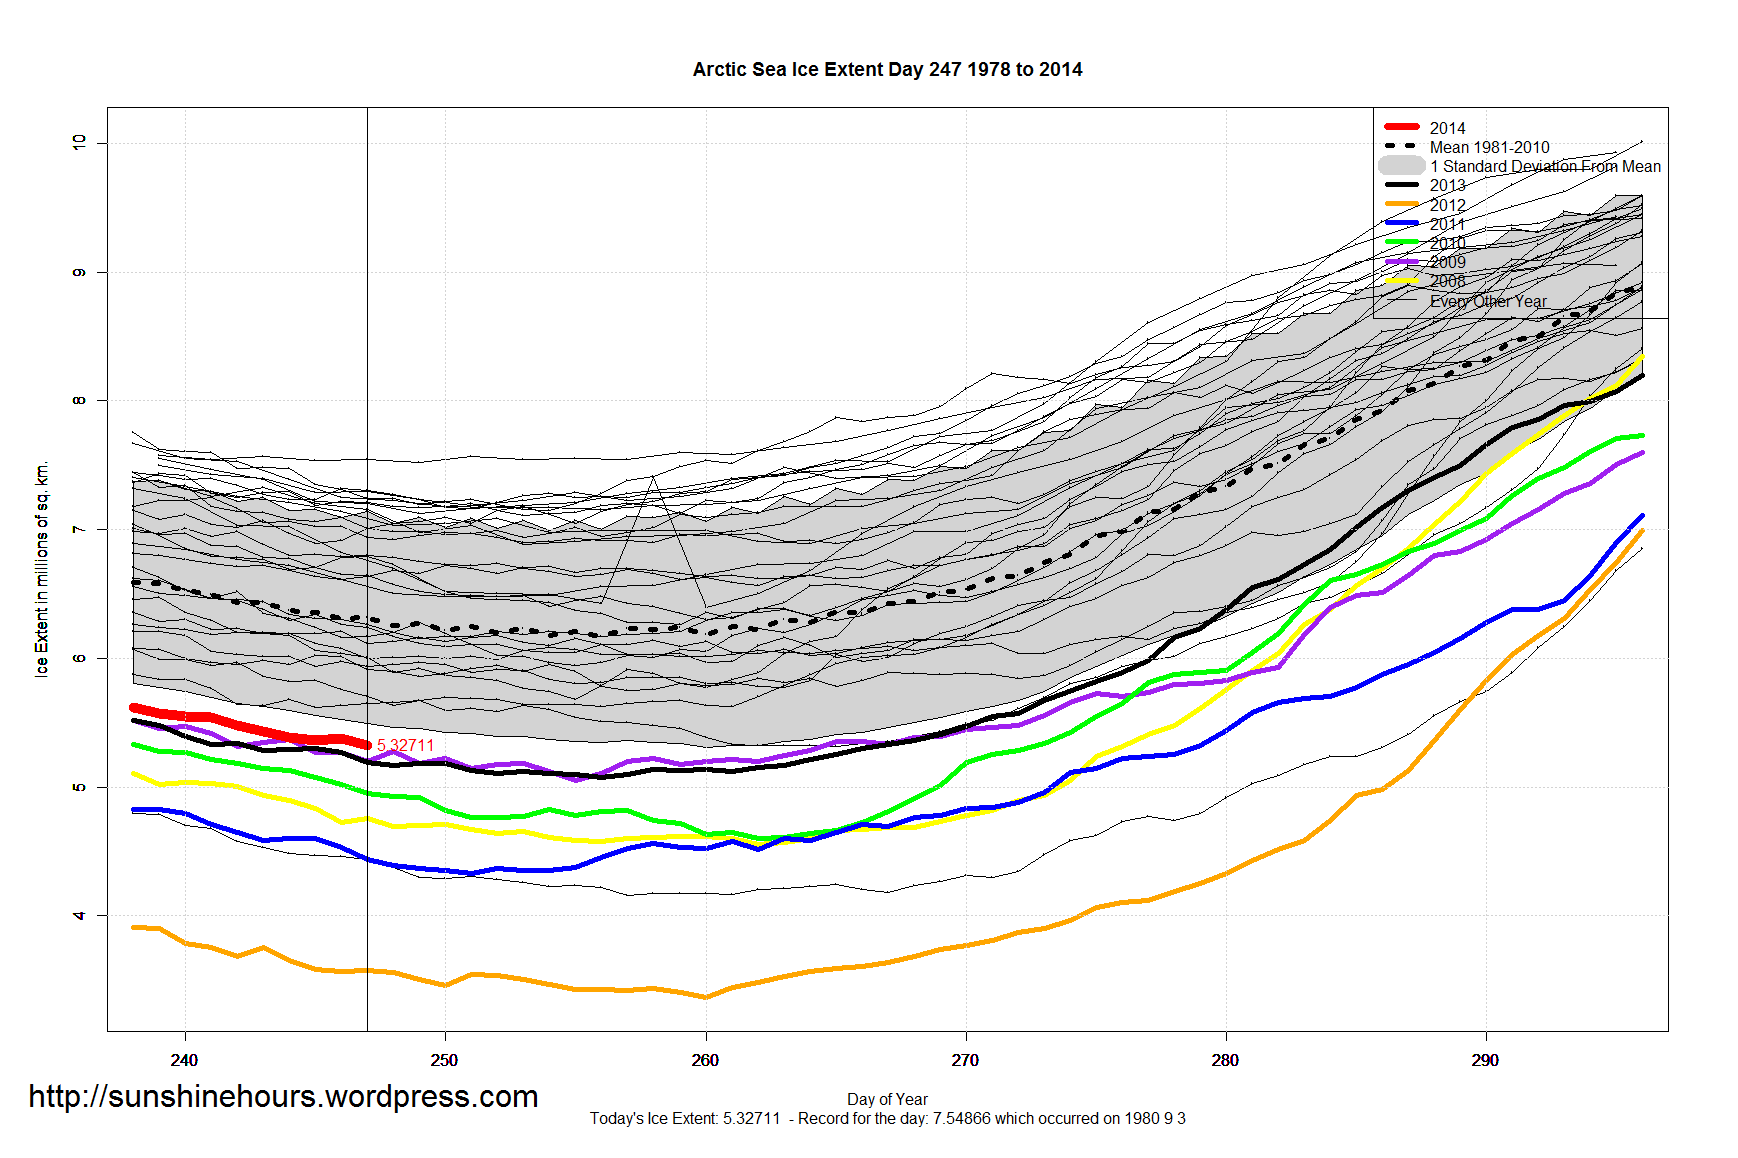

Arctic Sea Ice Extent Sep 05 2014 – -991,000 sq km below the 1981-2010 mean. Data for Day 247. Data here.
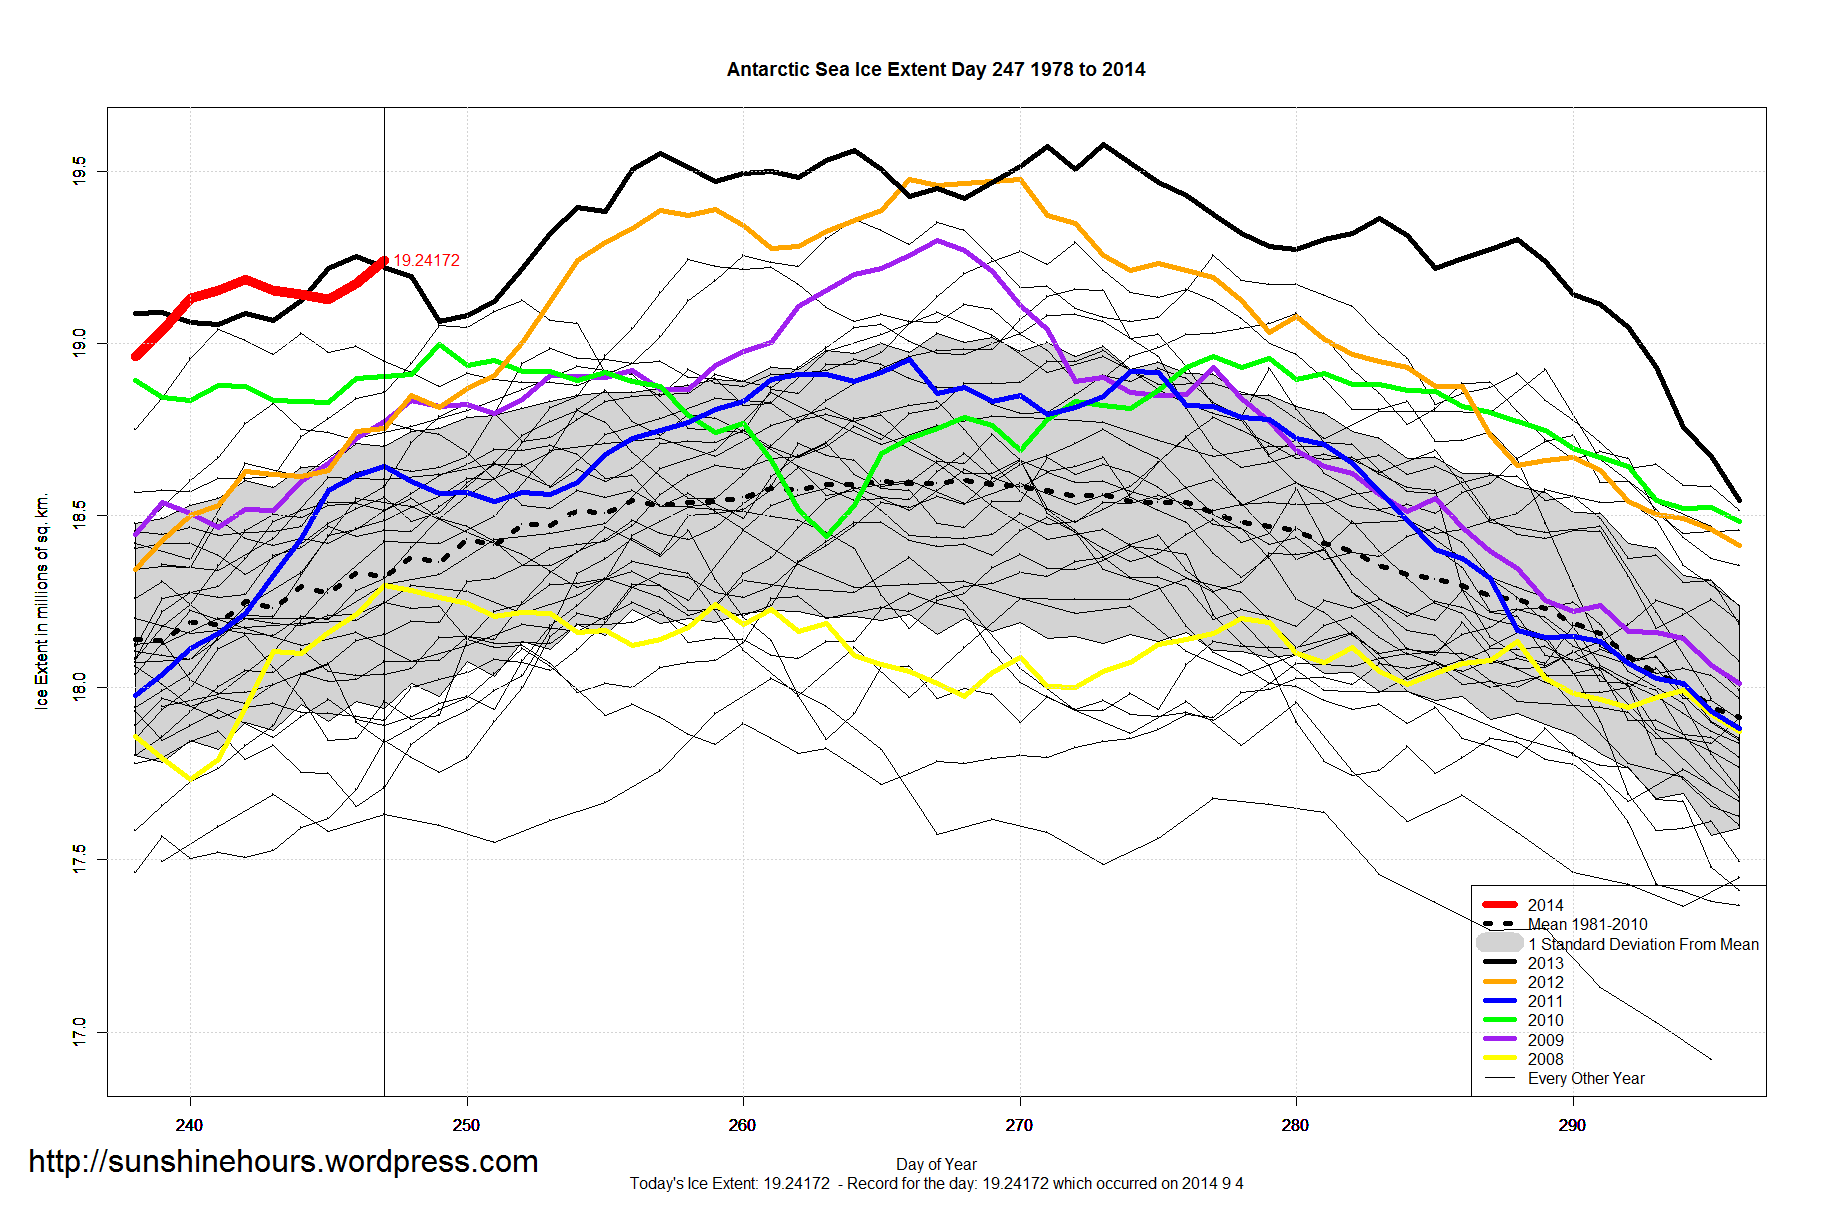
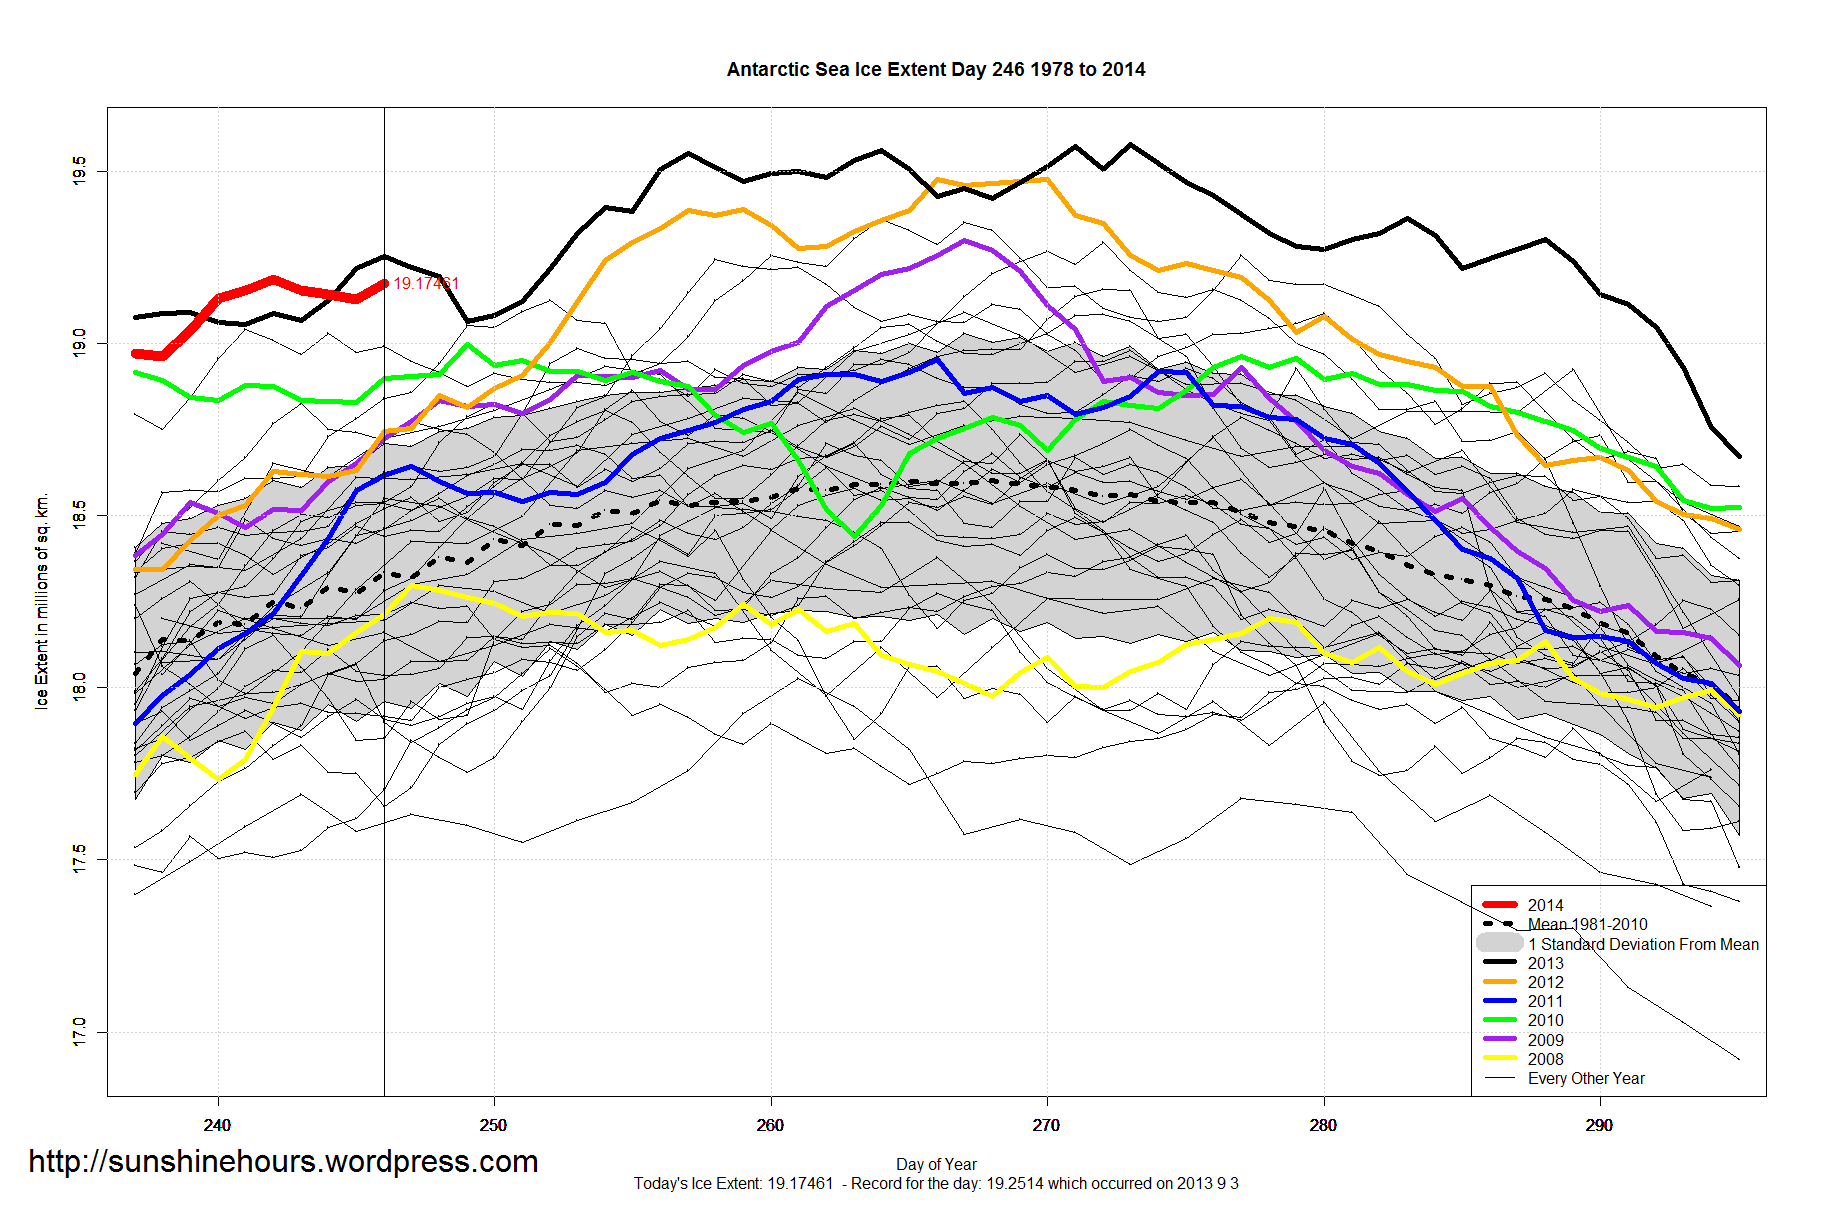
Antarctic Sea Ice Extent Sep 05 2014 – 921,000 sq km above the 1981-2010 mean. Data for Day 247. Data here.

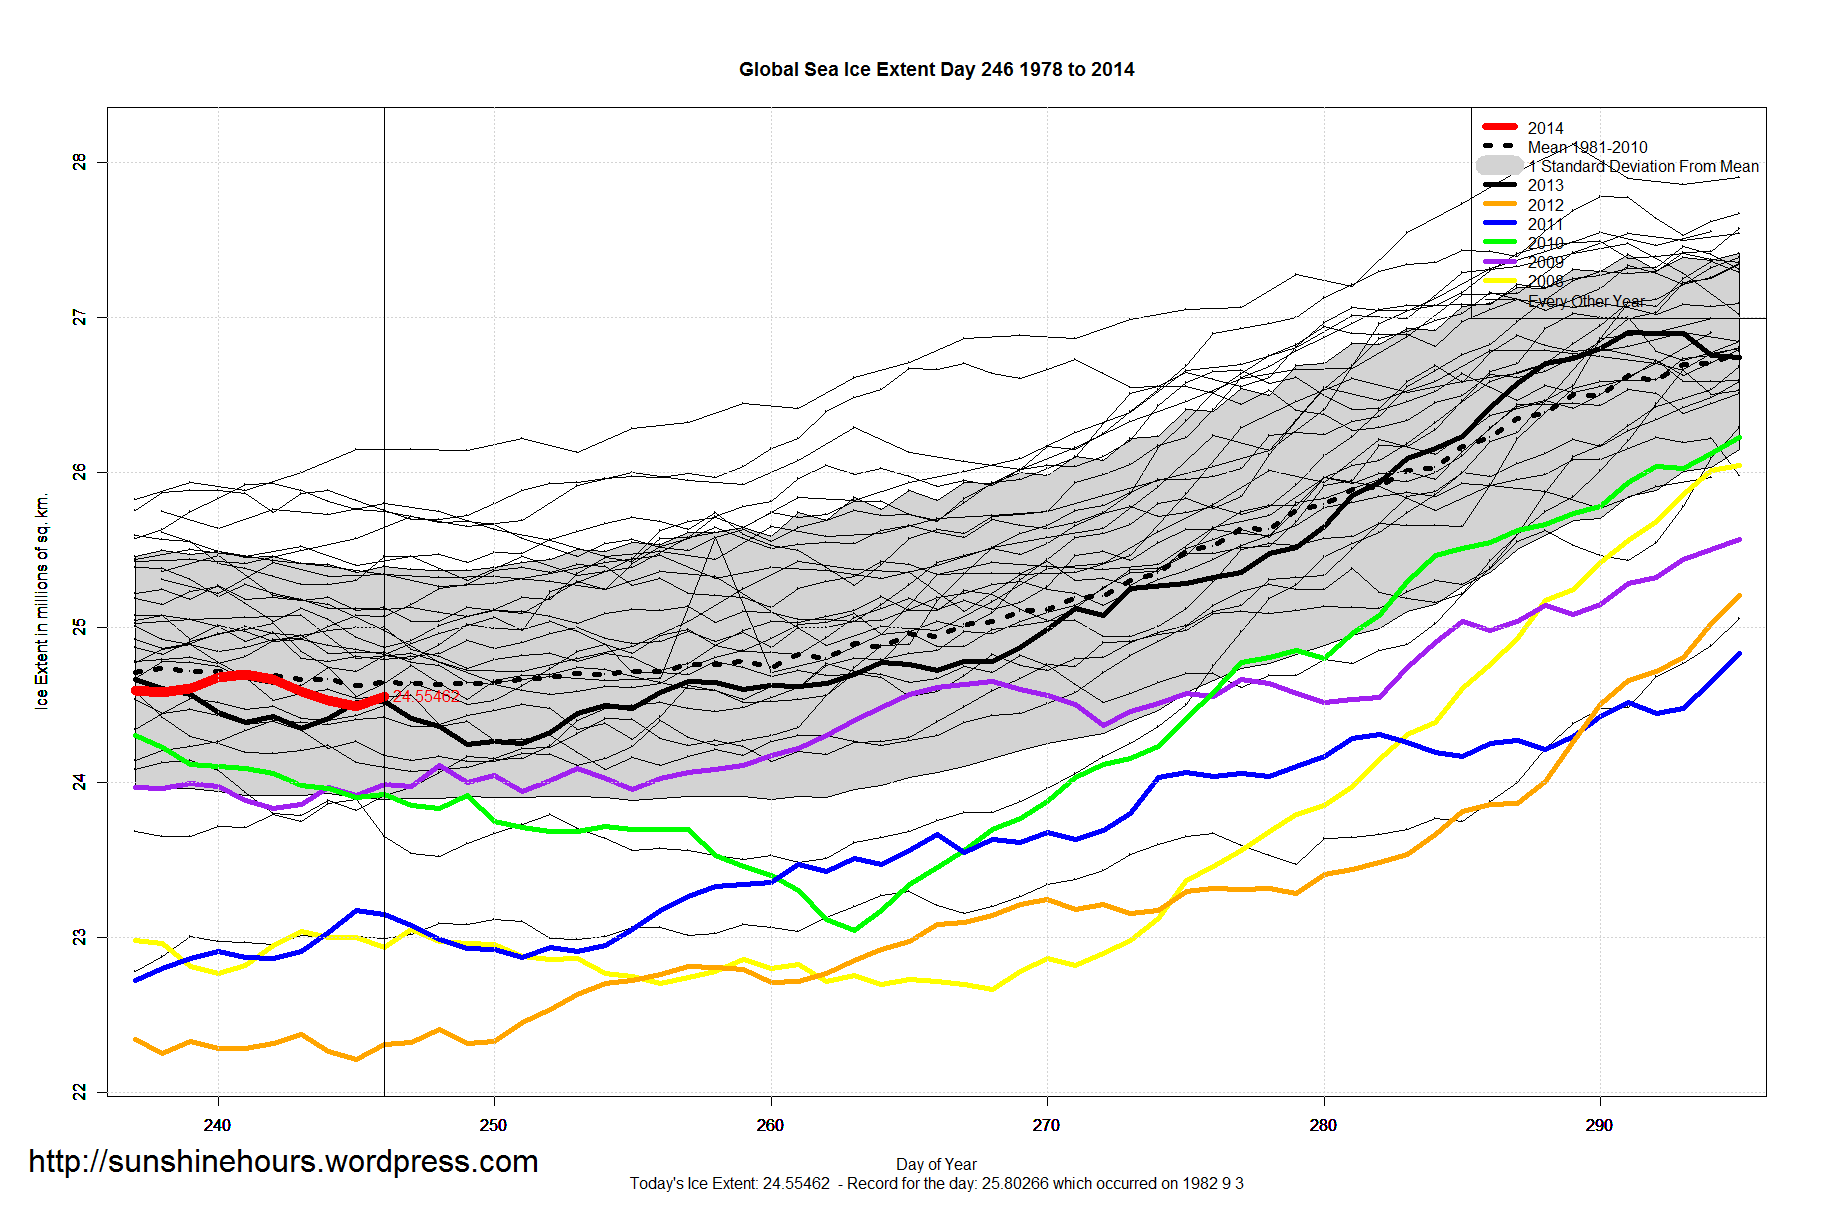
Global Sea Ice Extent Sep 04 2014 – -90,000 sq km below the 1981-2010 mean. Data for Day 246. Data here.
For this day (246) 2014 has more global sea ice than these years: 1990 1995 2001 2002 2003 2005 2007 2008 2009 2010 2011 2012 2013

Antarctic Sea Ice Extent Sep 04 2014 – 839,000 sq km above the 1981-2010 mean. Data for Day 246. Data here.
After a few days of decline, the climb is resuming.

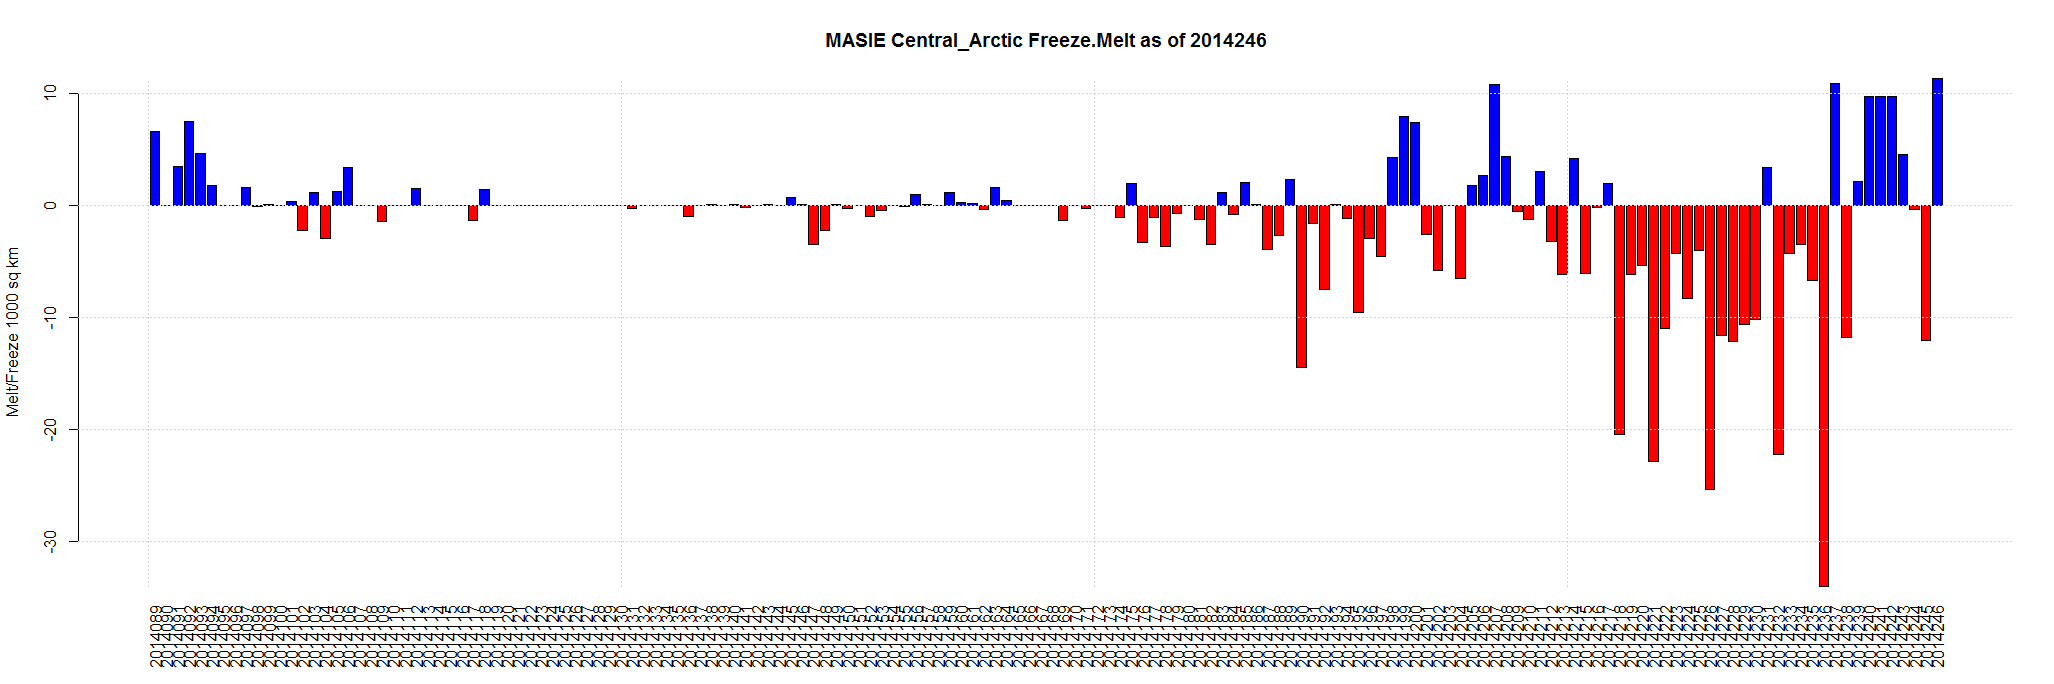
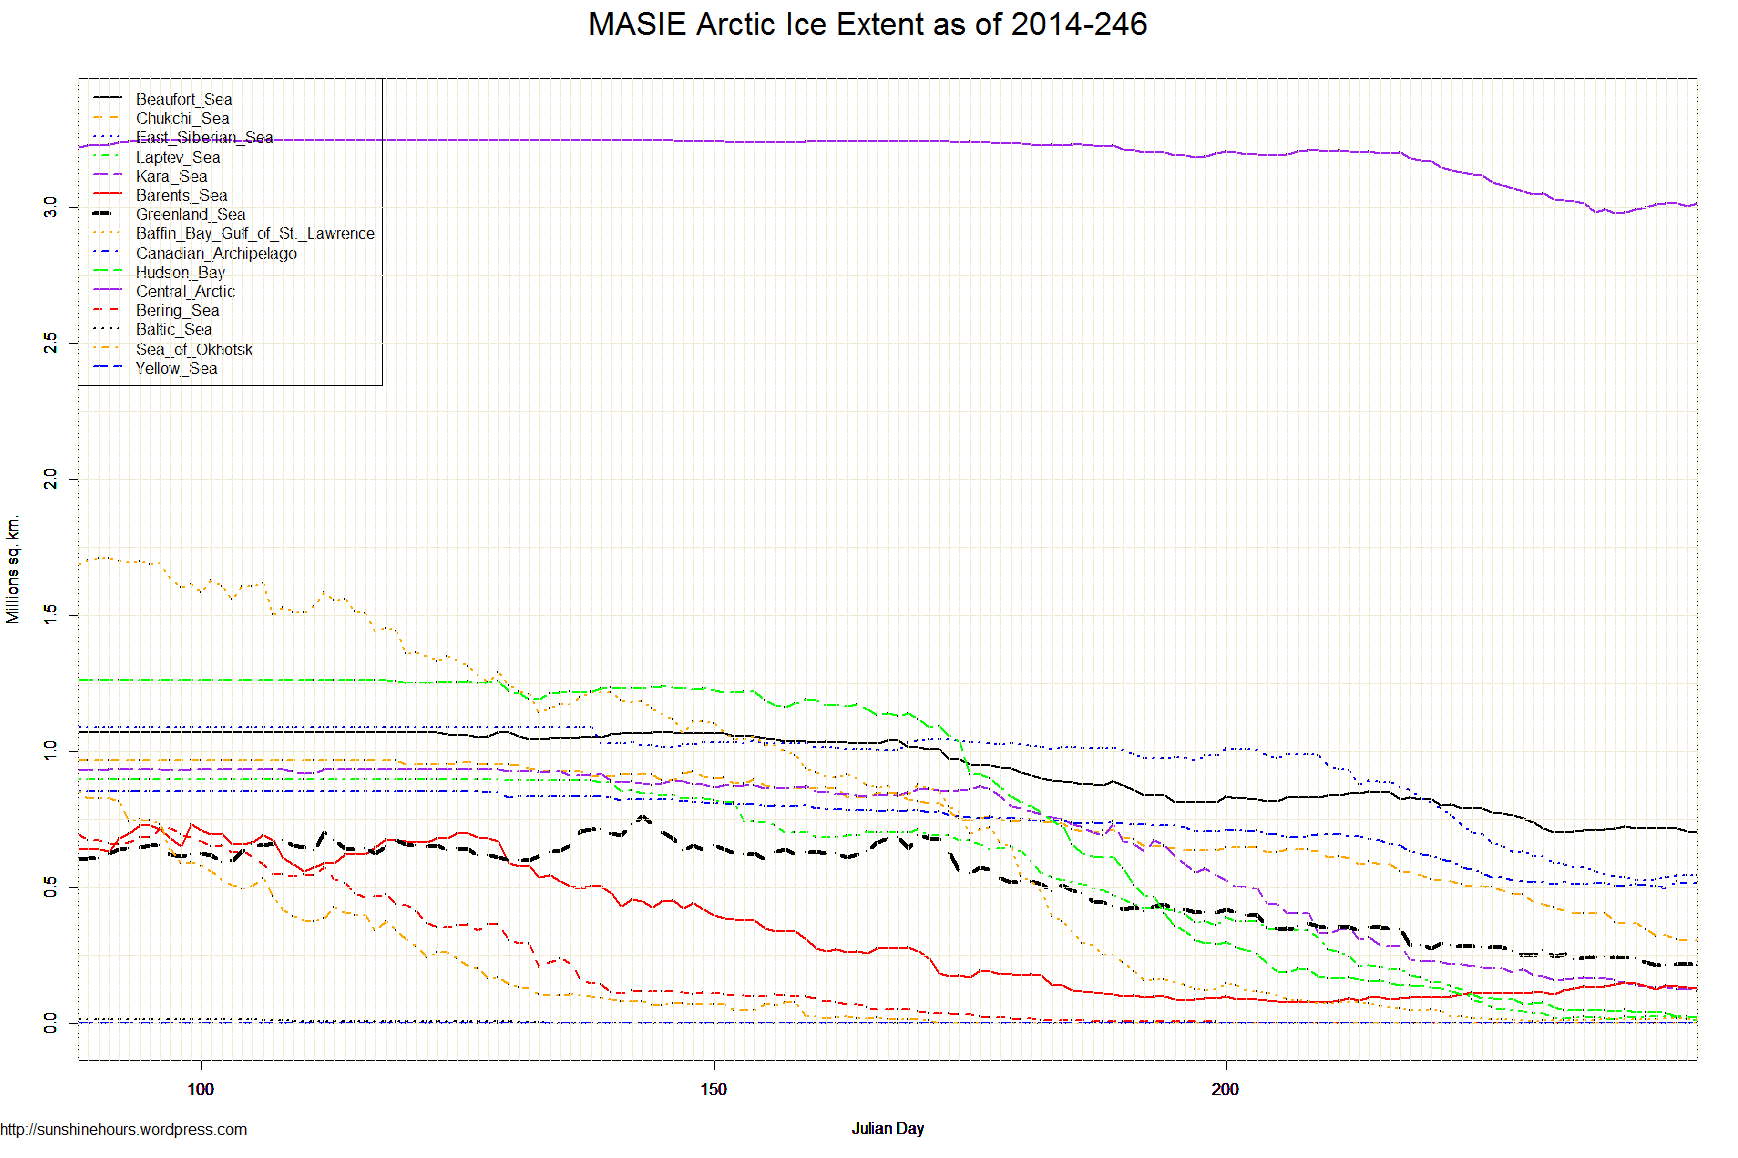
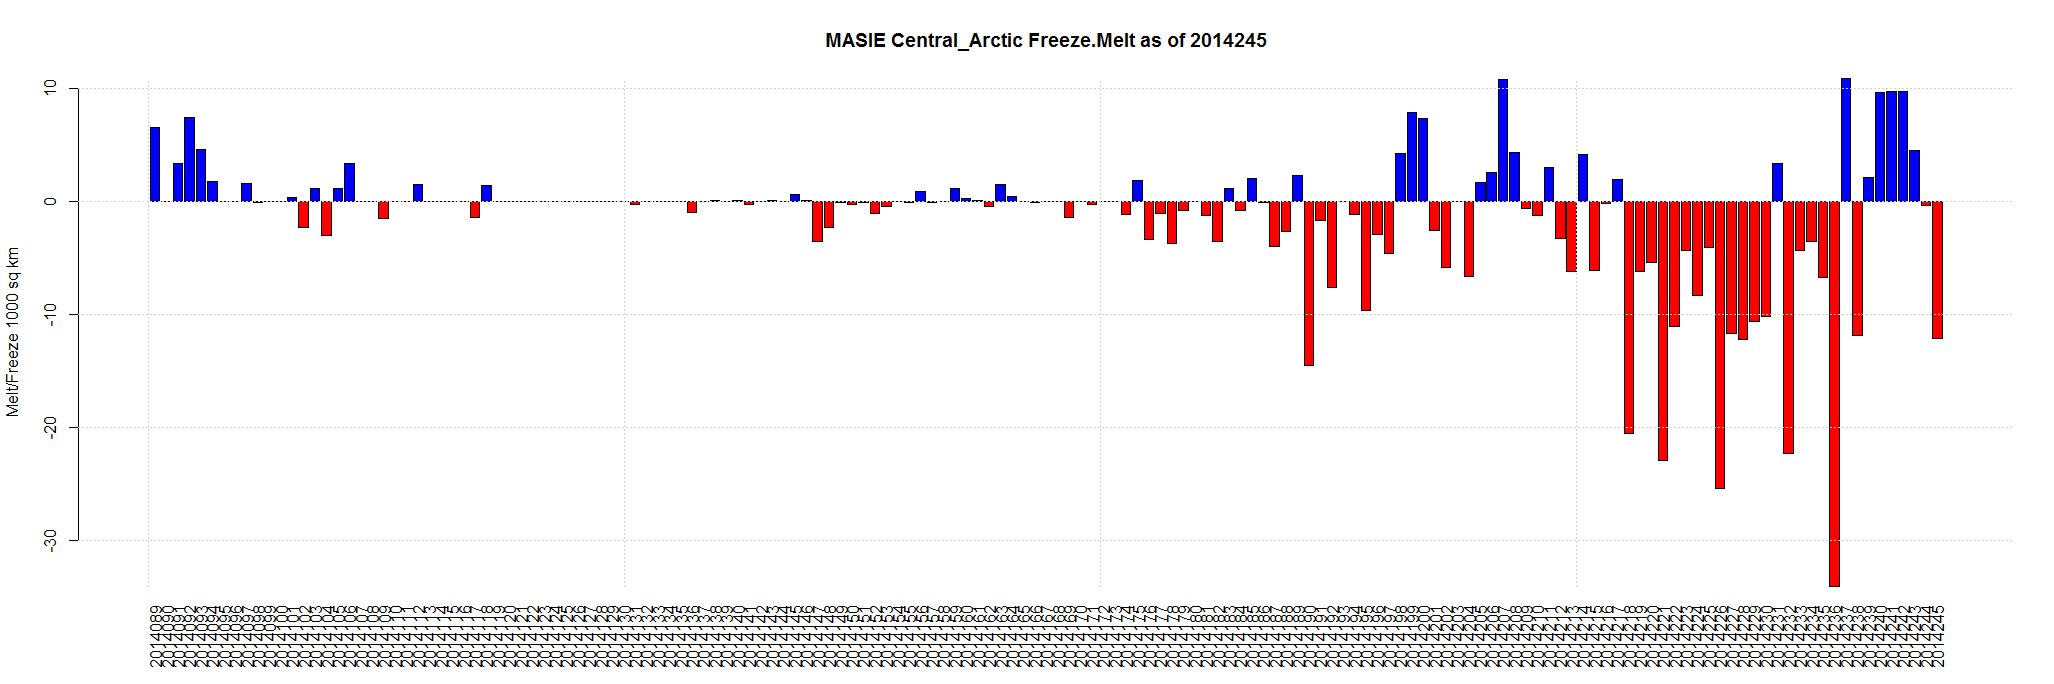
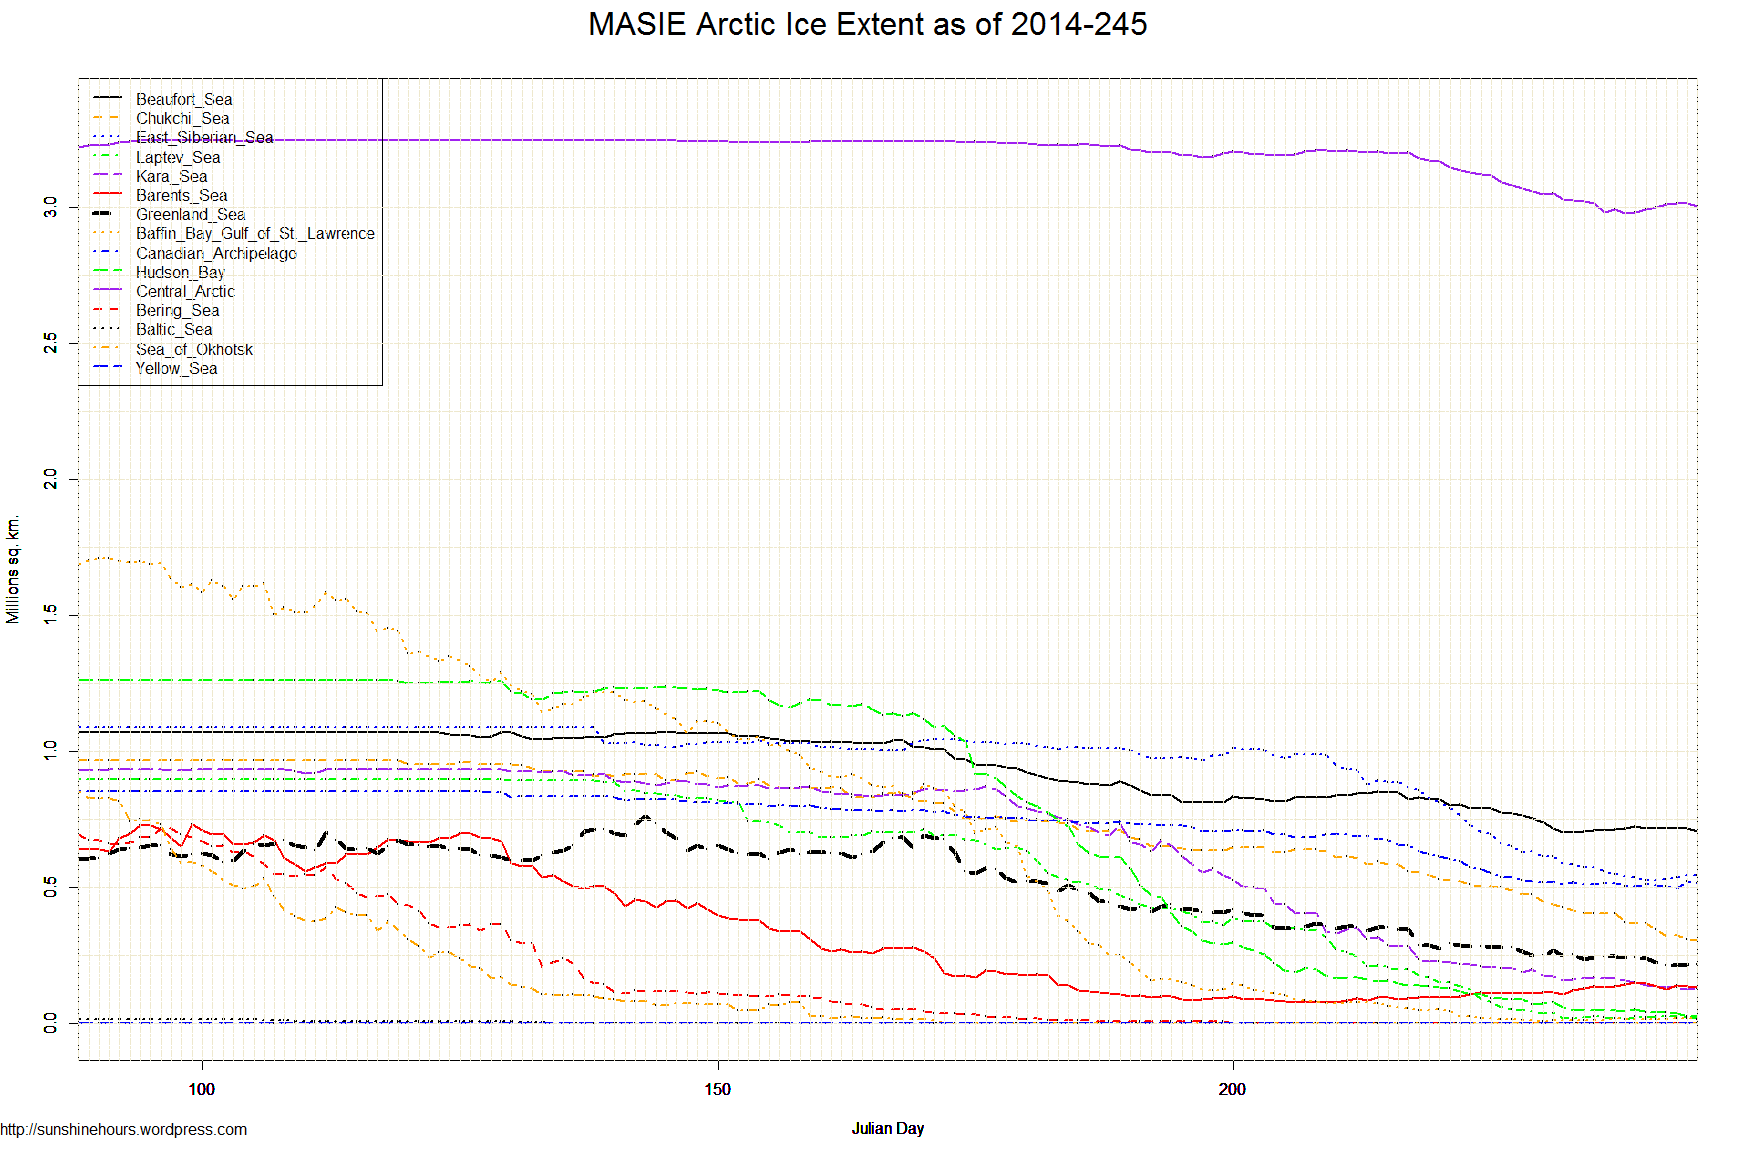
Sept 4 2014 MASIE Update – Tiny Melt – Central Arctic Up –
Data here. Click for bigger.
| Region | 159 days ago | End | Last 158 | Last 28 | Last 14 | Last 7 | Last 3 | Last 1 |
| Kara Sea | 933,859 | 119,969 | -813,890 | -114,911 | -37,590 | -30,727 | -11,437 | -8,935 |
| Laptev Sea | 897,845 | 12,289 | -885,556 | -165,768 | -6,774 | -12,837 | -14,783 | -5,179 |
| Hudson Bay | 1,260,903 | 22,601 | -1,238,303 | -117,548 | -36,542 | -28,844 | -16,160 | -5,024 |
| Barents Sea | 645,917 | 130,386 | -515,531 | 32,669 | 21,125 | -21,179 | -8,970 | -4,235 |
| Beaufort Sea | 1,070,445 | 704,681 | -365,764 | -126,294 | 954 | -18,528 | -13,253 | -2,233 |
| Greenland Sea | 603,416 | 215,742 | -387,674 | -70,759 | -33,057 | -27,558 | 1,389 | -778 |
| Chukchi Sea | 966,006 | 304,755 | -661,251 | -251,048 | -120,906 | -65,064 | -20,155 | -747 |
| Bering Sea | 697,324 | 0 | -697,324 | 0 | 0 | 0 | 0 | 0 |
| Baltic Sea | 15,337 | 0 | -15,337 | 0 | 0 | 0 | 0 | 0 |
| Sea of Okhotsk | 853,240 | 0 | -853,240 | 0 | 0 | 0 | 0 | 0 |
| Yellow Sea | 0 | 0 | 0 | 0 | 0 | 0 | 0 | 0 |
| Baffin Bay Gulf of St. Lawrence | 1,688,530 | 14,971 | -1,673,560 | -34,928 | 4,814 | 527 | -2,508 | 224 |
| Canadian Archipelago | 853,214 | 515,437 | -337,777 | -117,207 | 4,407 | 9,885 | 20,019 | 484 |
| East Siberian Sea | 1,087,137 | 545,338 | -541,800 | -312,116 | -43,178 | 9,623 | 5,997 | 1,781 |
| Central Arctic | 3,221,921 | 3,014,133 | -207,788 | -166,082 | -15,008 | 32,399 | -1,144 | 11,281 |
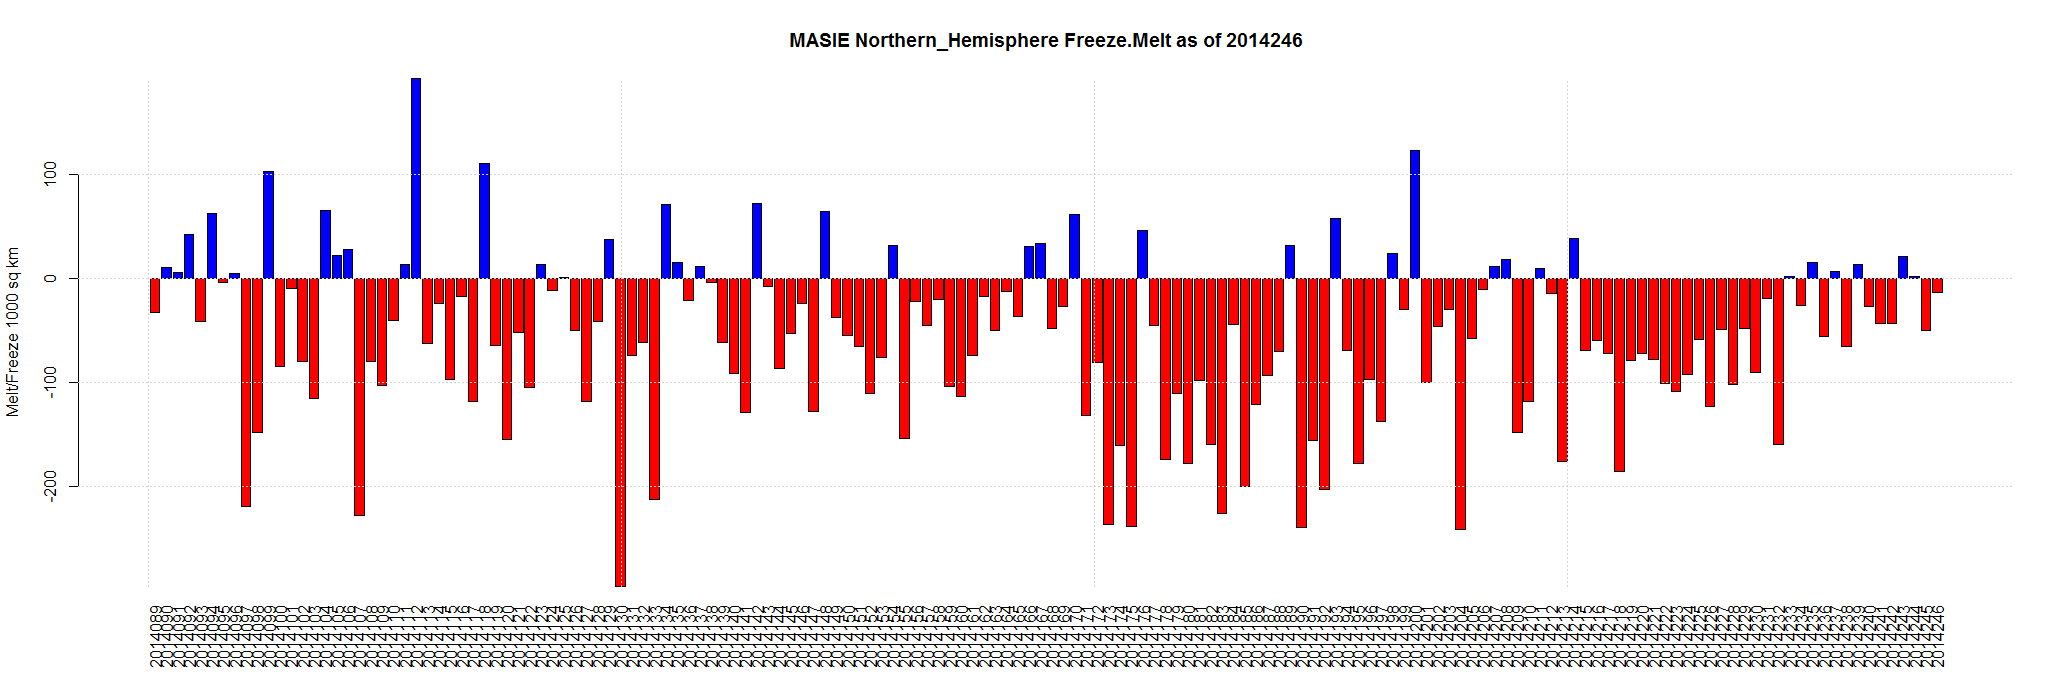
| Northern Hemisphere (Total) | 14,805,115 | 5,601,443 | -9,203,672 | -1,443,991 | -261,754 | -152,302 | -61,005 | -13,361 |
| NH (Average Loss per Day) | -57,885 | -51,571 | -18,697 | -21,757 | -20,335 | -13,361 |
Arctic Sea Ice Extent Sep 04 2014 – -929,000 sq km below the 1981-2010 mean. Data for Day 246. Data here.

China’s economy continues to drive ahead powered by coal. They consume 50% of the world production. The use the cheap electricity produced by burning coal to manufacture inexpensive goods and then sell them all over the world.
Germany, on the other hand, has chosen to use cheap electricity to subsidize wind turbines and solar panels.
“At the center of Europe’s coal renaissance is the region around the German-Polish border, already home to five of Europe’s most polluting coal plants, says the report, which was compiled by CAN Europe, WWF, the European Environmental Bureau, the Health and Environment Alliance and Climate Alliance Germany. Swedish power firm Vattenfall GmbH is now planning to expand the number of open-cast mines in the Lausitz area to exploit its deposits of lignite, a particularly polluting type of coal.
Vattenfall says the Lausitz mines, with their vast deposits, are there to take up the slack when renewable energy sources fail to meet Germany’s needs. “Without flexible and reliable brown coal, we wouldn’t be able to provide stable electricity supplies at stable prices,” the company says on its website.”
http://www.thegwpf.com/europes-coal-renaissance-undermines-it-green-credentials/
Sept 3 2014 MASIE Update – NH Down – Central Arctic Down
Data here. Click for bigger.

| Region | 158 days ago | End | Last 157 | Last 28 | Last 14 | Last 7 | Last 3 | Last 1 |
| Beaufort Sea | 1,070,445 | 706,914 | -363,531 | -115,531 | -9,078 | -10,448 | -10,434 | -12,506 |
| Central Arctic | 3,221,921 | 3,002,852 | -219,069 | -197,839 | -48,579 | 23,263 | -7,941 | -12,077 |
| Canadian Archipelago | 853,214 | 514,953 | -338,261 | -141,608 | -4,576 | 10,800 | 9,671 | -7,988 |
| Laptev Sea | 897,845 | 17,468 | -880,376 | -182,315 | -20,487 | 2,307 | -9,706 | -6,500 |
| Chukchi Sea | 966,006 | 305,501 | -660,505 | -255,760 | -132,078 | -68,205 | -16,772 | -5,280 |
| Baffin Bay Gulf of St. Lawrence | 1,688,530 | 14,747 | -1,673,783 | -40,930 | 3,666 | -2,166 | 285 | -3,473 |
| Barents Sea | 645,917 | 134,621 | -511,297 | 40,303 | 20,893 | -9,036 | 9,140 | -2,712 |
| East Siberian Sea | 1,087,137 | 543,557 | -543,580 | -325,227 | -70,484 | 2,390 | 15,083 | -1,379 |
| Greenland Sea | 603,416 | 216,520 | -386,896 | -130,527 | -53,267 | -26,916 | 2,158 | -179 |
| Bering Sea | 697,324 | 0 | -697,324 | 0 | 0 | 0 | 0 | 0 |
| Baltic Sea | 15,337 | 0 | -15,337 | 0 | 0 | 0 | 0 | 0 |
| Sea of Okhotsk | 853,240 | 0 | -853,240 | 0 | 0 | 0 | 0 | 0 |
| Yellow Sea | 0 | 0 | 0 | 0 | 0 | 0 | 0 | 0 |
| Hudson Bay | 1,260,903 | 27,625 | -1,233,279 | -112,541 | -48,860 | -17,652 | -14,242 | 188 |
| Kara Sea | 933,859 | 128,904 | -804,955 | -153,964 | -44,747 | -29,573 | -3,245 | 2,266 |
| Northern Hemisphere (Total) | 14,805,115 | 5,614,804 | -9,190,310 | -1,615,939 | -407,598 | -125,236 | -26,002 | -49,640 |
| NH (Average Loss per Day) | -58,167 | -57,712 | -29,114 | -17,891 | -8,667 | -49,640 |
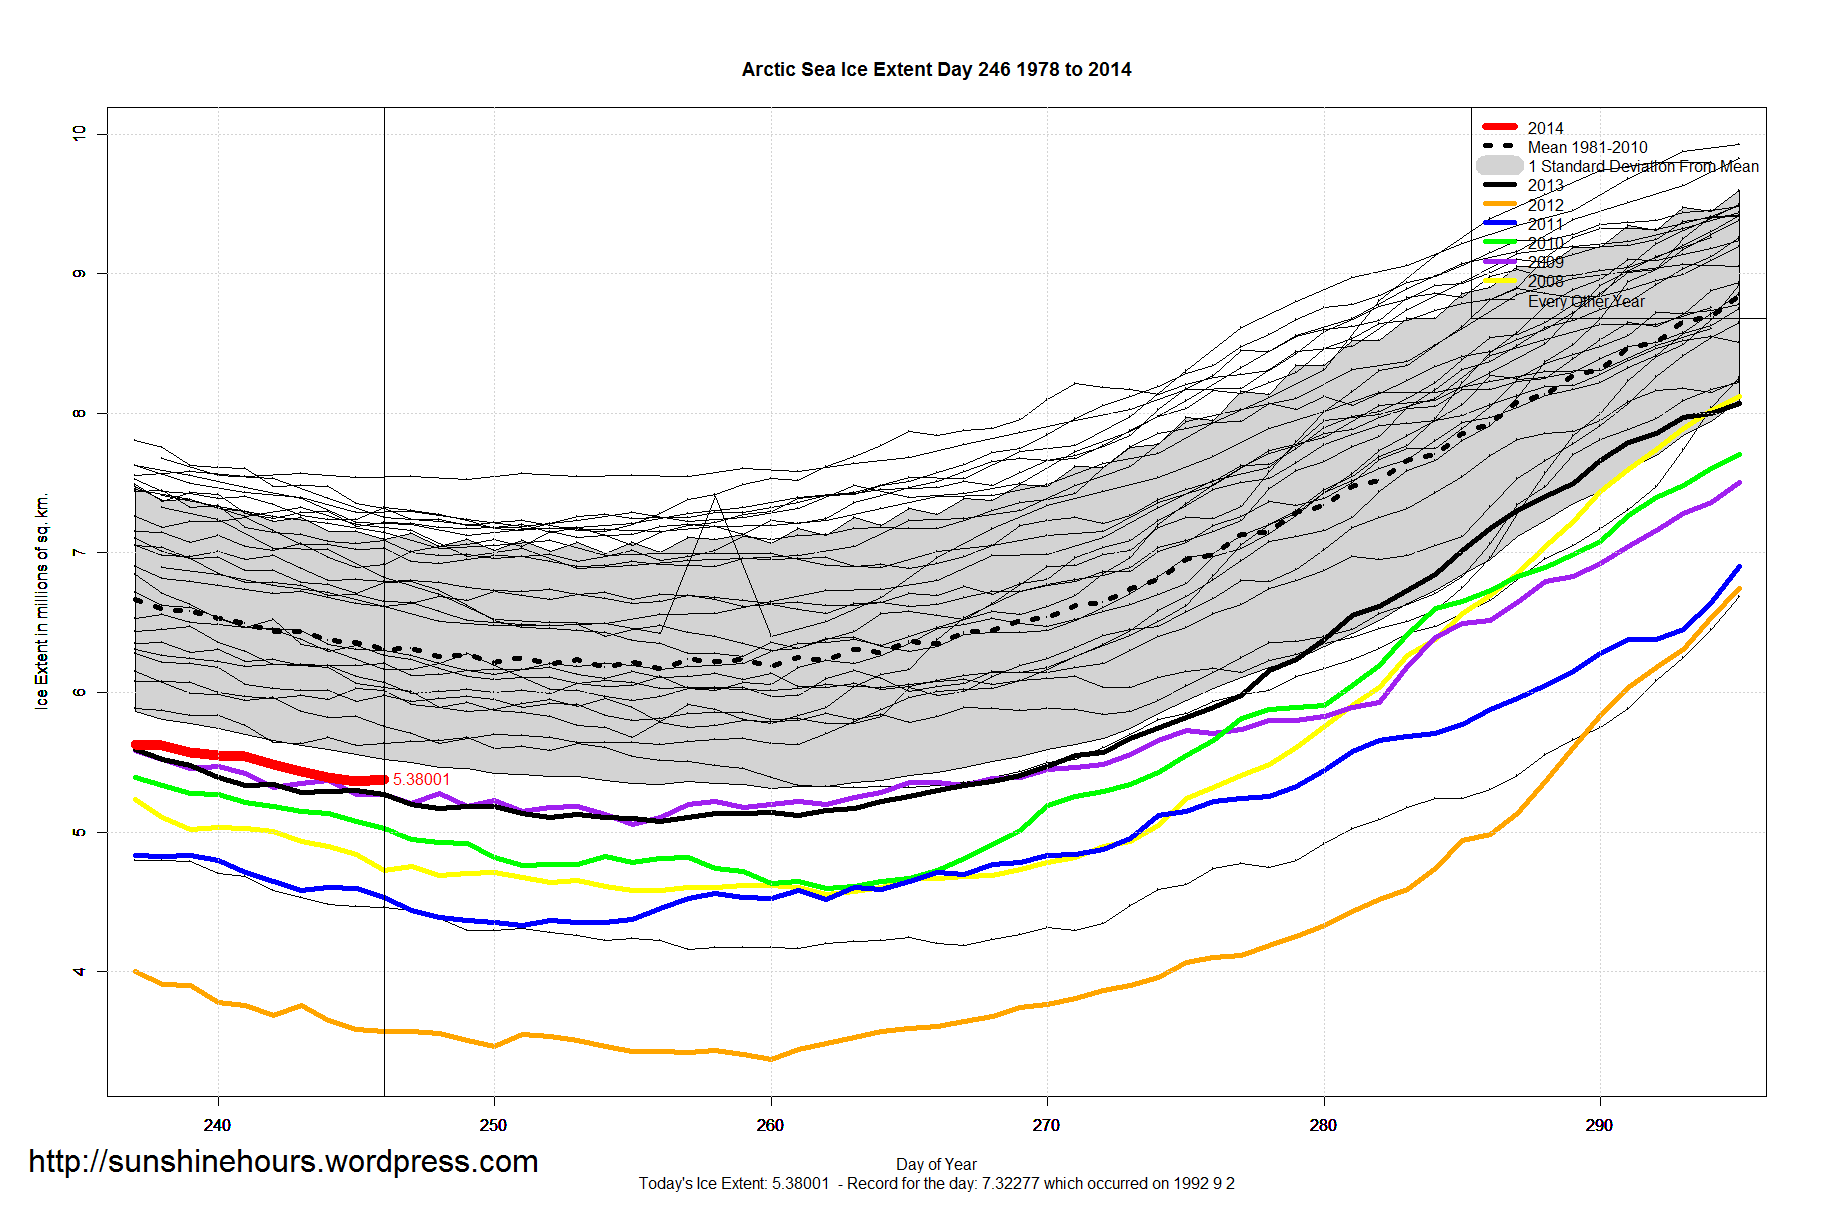
Arctic Sea Ice Extent Sep 03 2014 – -992,000 sq km below the 1981-2010 mean. Data for Day 245. Data here.
Click on the graph for full size to make the minimums easier to read. 2014 is on there, but I suspect it will change.
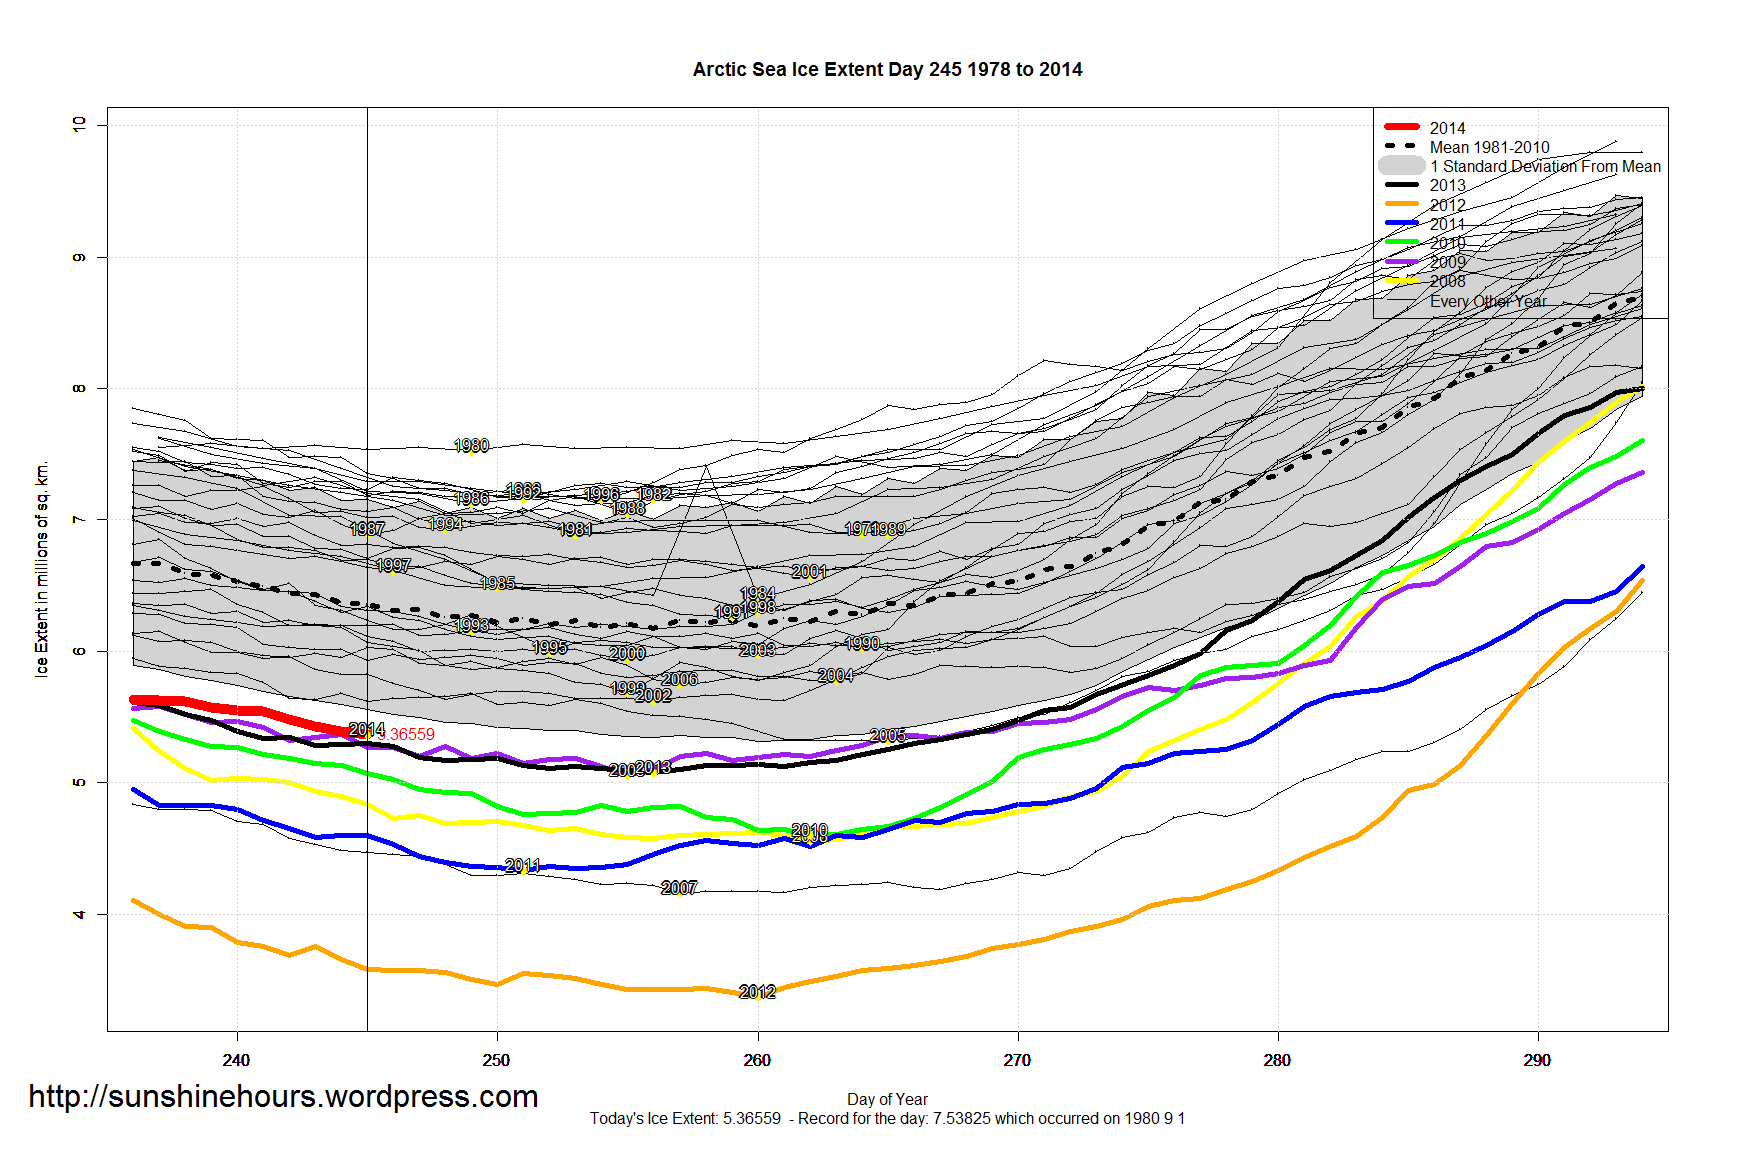

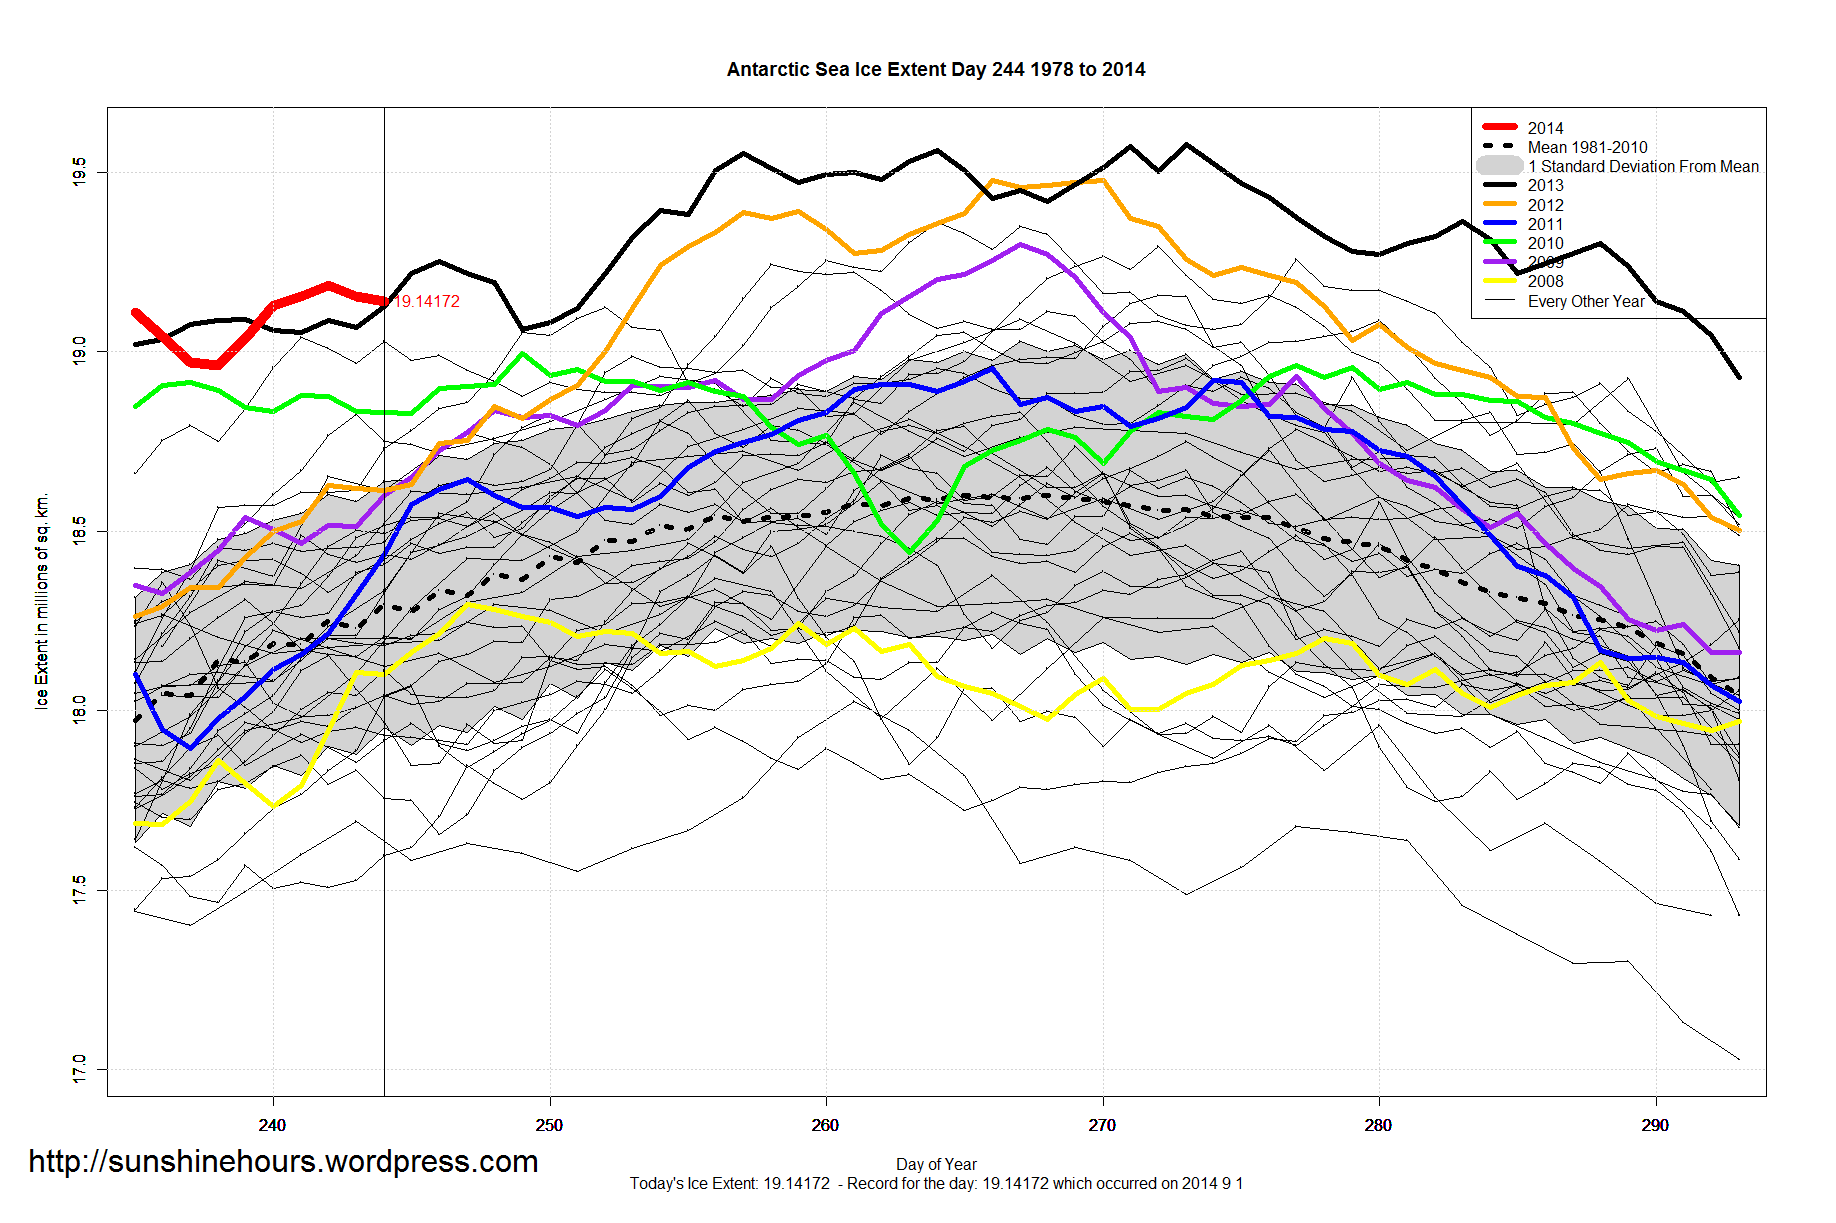
Antarctic Sea Ice Extent Sep 02 2014 – 846,000 sq km above the 1981-2010 mean. Data for Day 244. Data here.
In case you are wondering, 2014 is slightly above 2013.