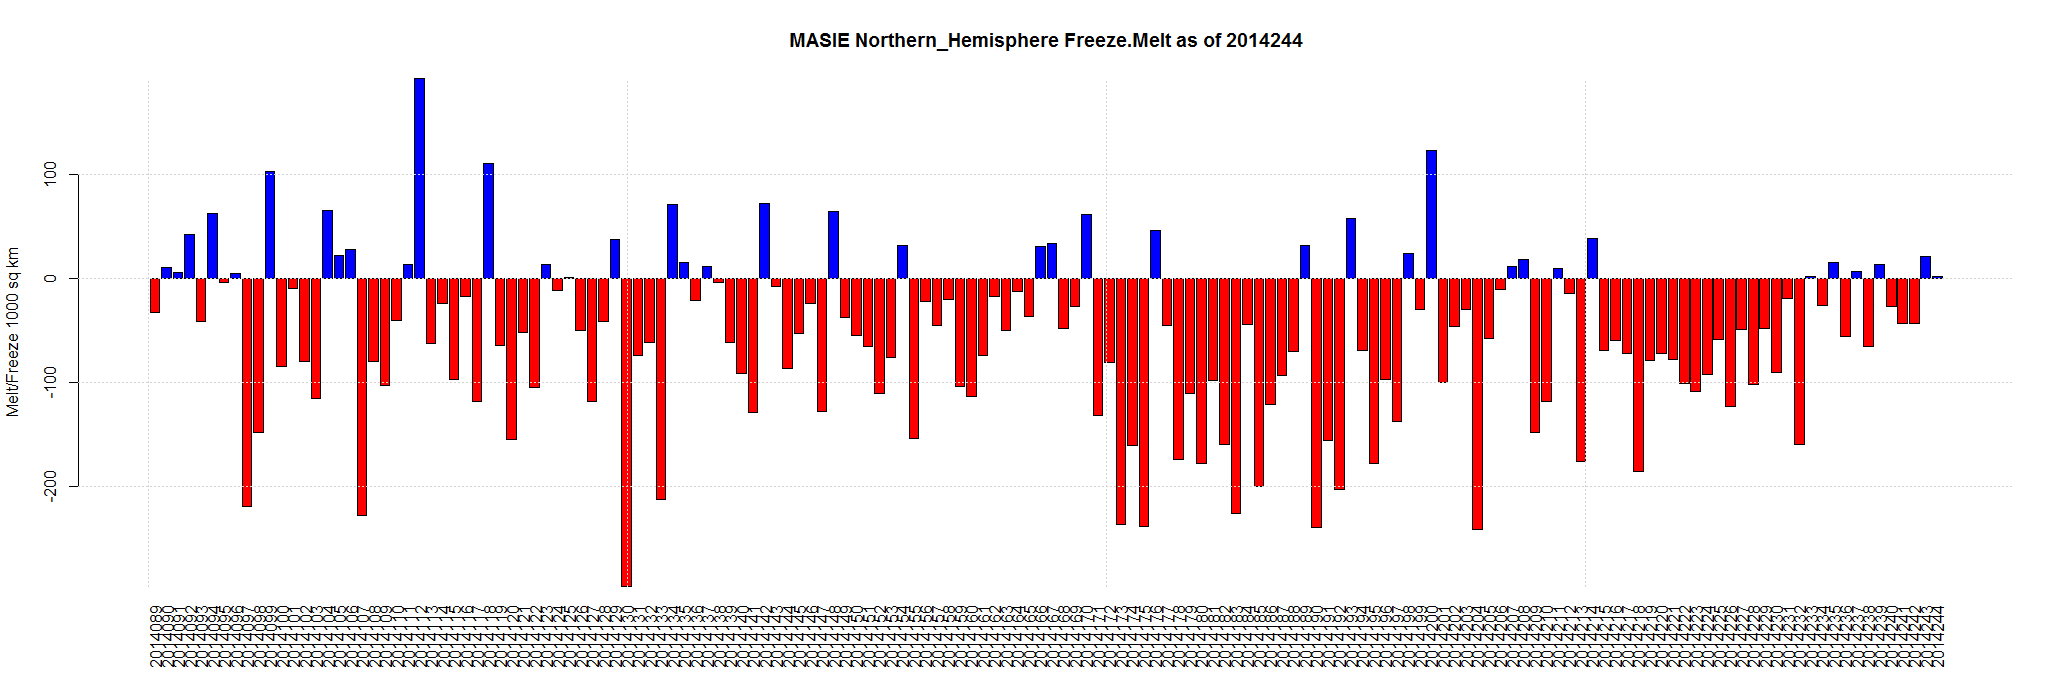
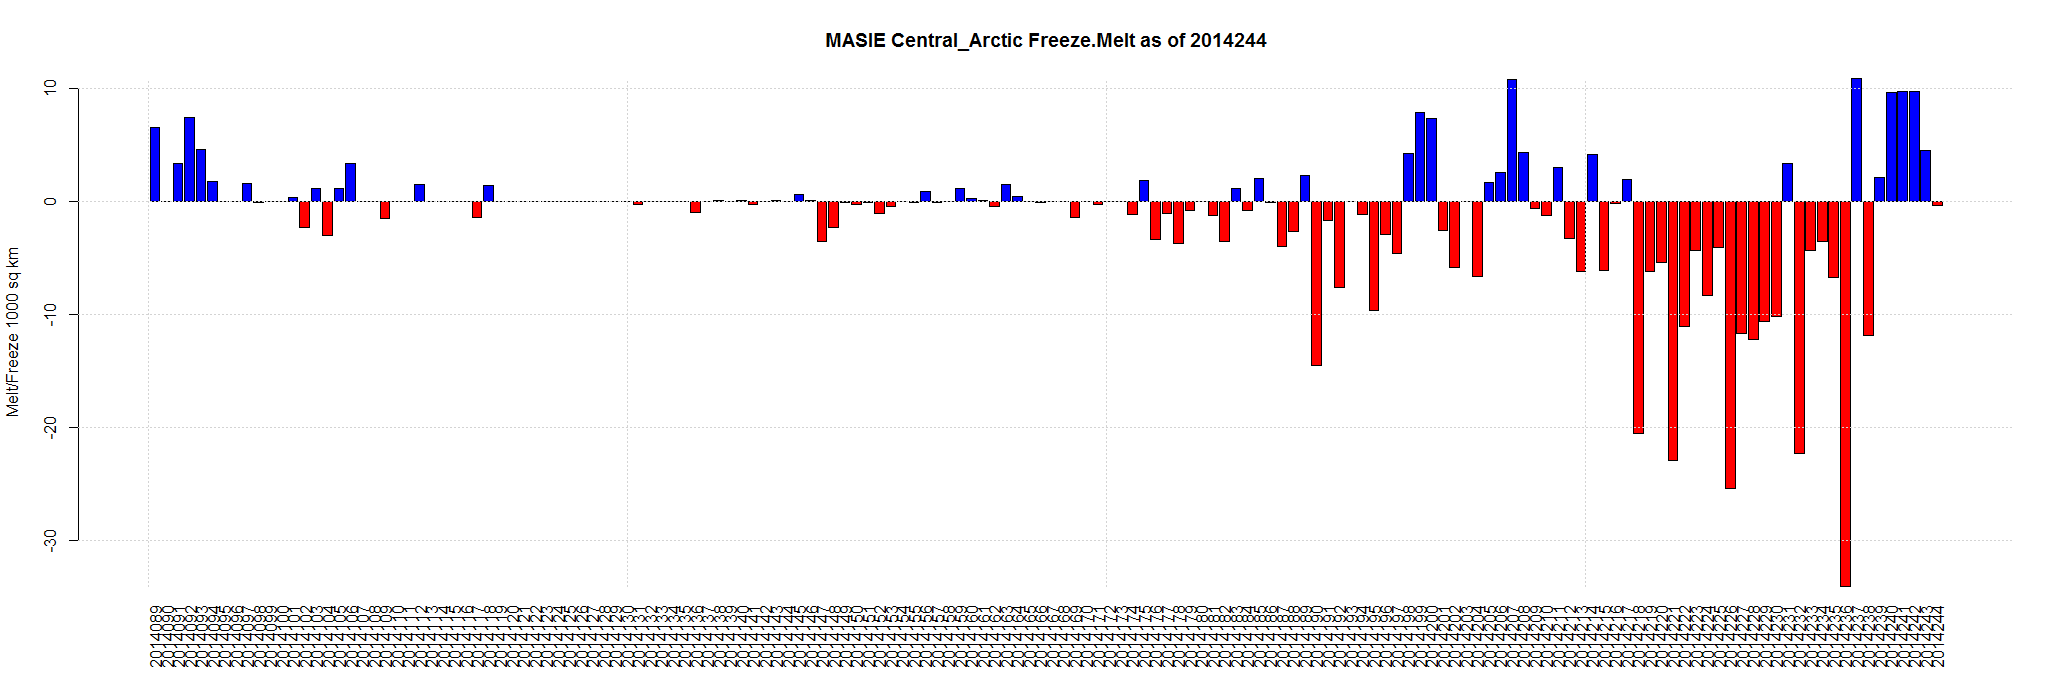
Sep 2 2014 MASIE Update – Melting has stopped for 2 days
Data here. Click for bigger.
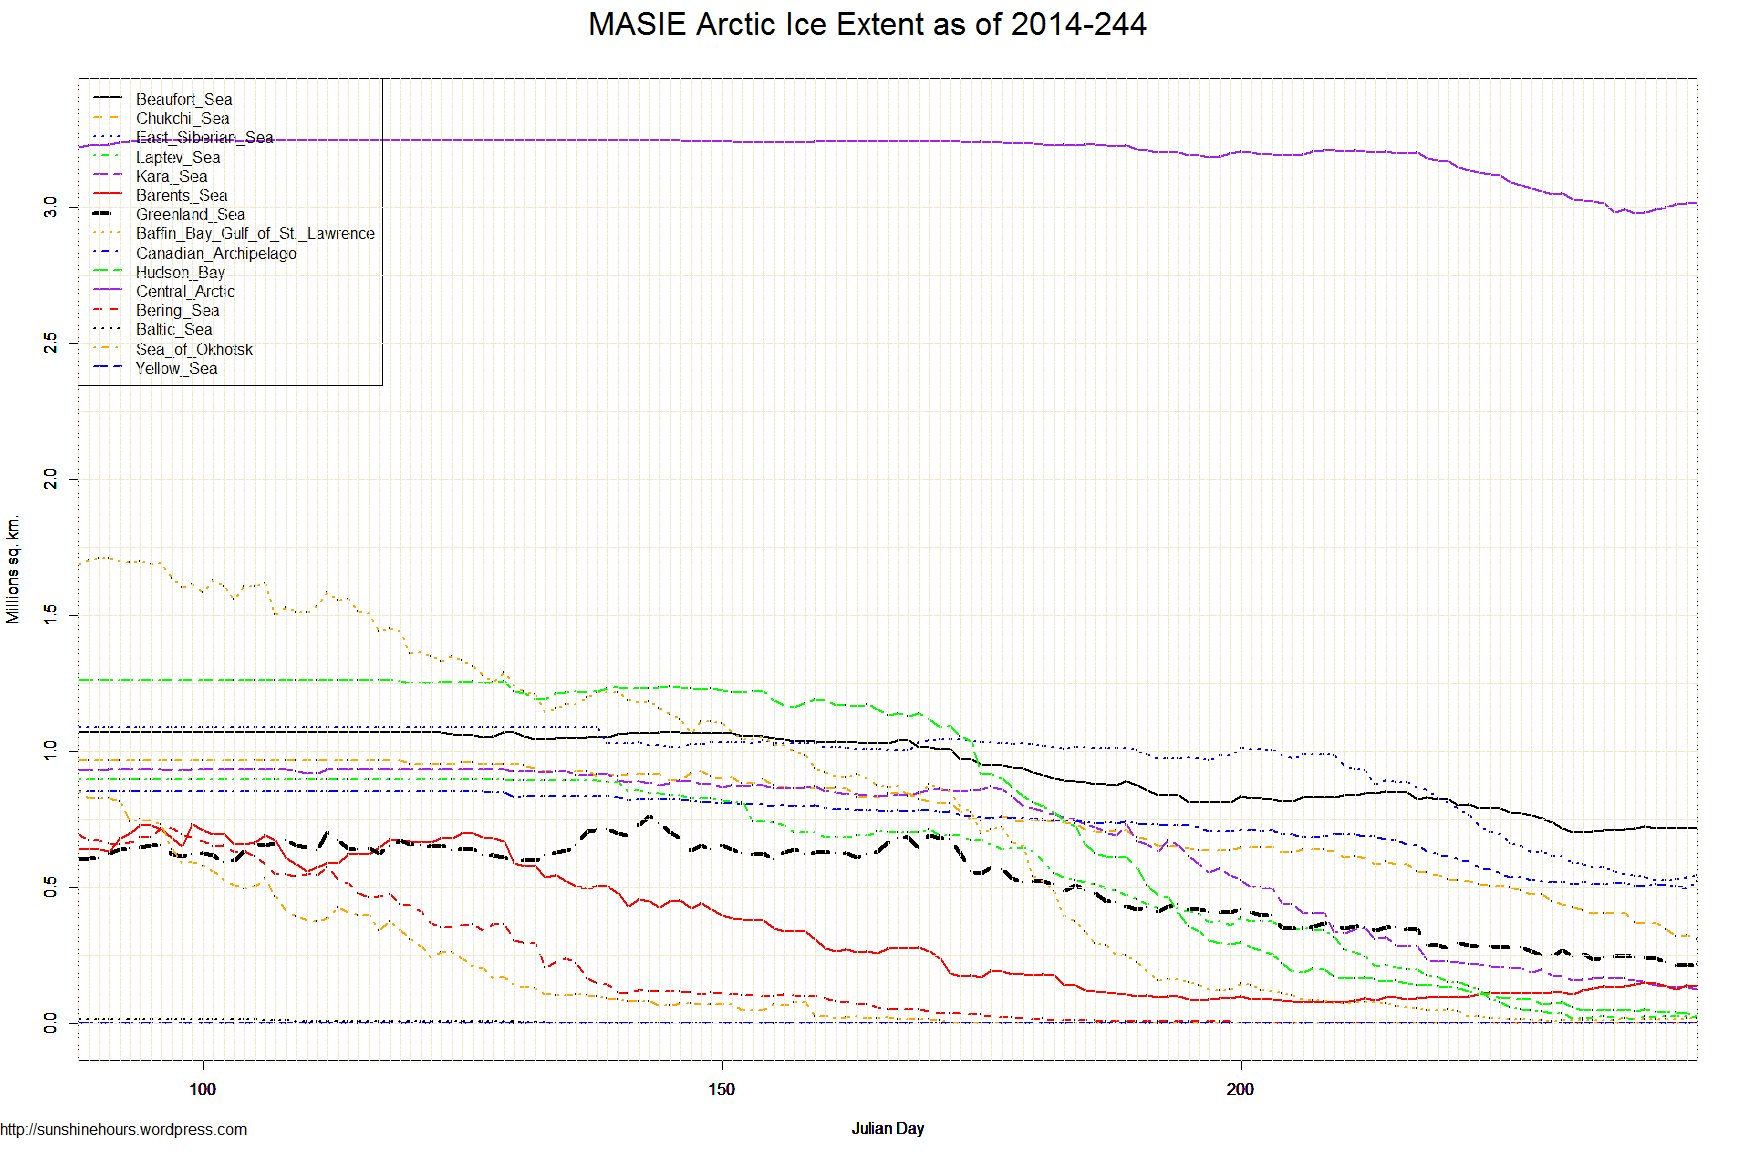
| Region | 157 days ago | End | Last 156 | Last 28 | Last 14 | Last 7 | Last 3 | Last 1 |
| Chukchi Sea | 966,006 | 310,781 | -655,225 | -272,835 | -140,273 | -94,780 | -35,052 | -14,128 |
| Hudson Bay | 1,260,903 | 27,437 | -1,233,467 | -118,835 | -48,542 | -22,301 | -14,827 | -11,324 |
| Kara Sea | 933,859 | 126,637 | -807,222 | -156,230 | -50,304 | -37,917 | -10,217 | -4,768 |
| Laptev Sea | 897,845 | 23,968 | -873,876 | -174,345 | -14,258 | 4,246 | -1,189 | -3,104 |
| Barents Sea | 645,917 | 137,333 | -508,584 | 47,041 | 23,606 | 75 | 1,513 | -2,023 |
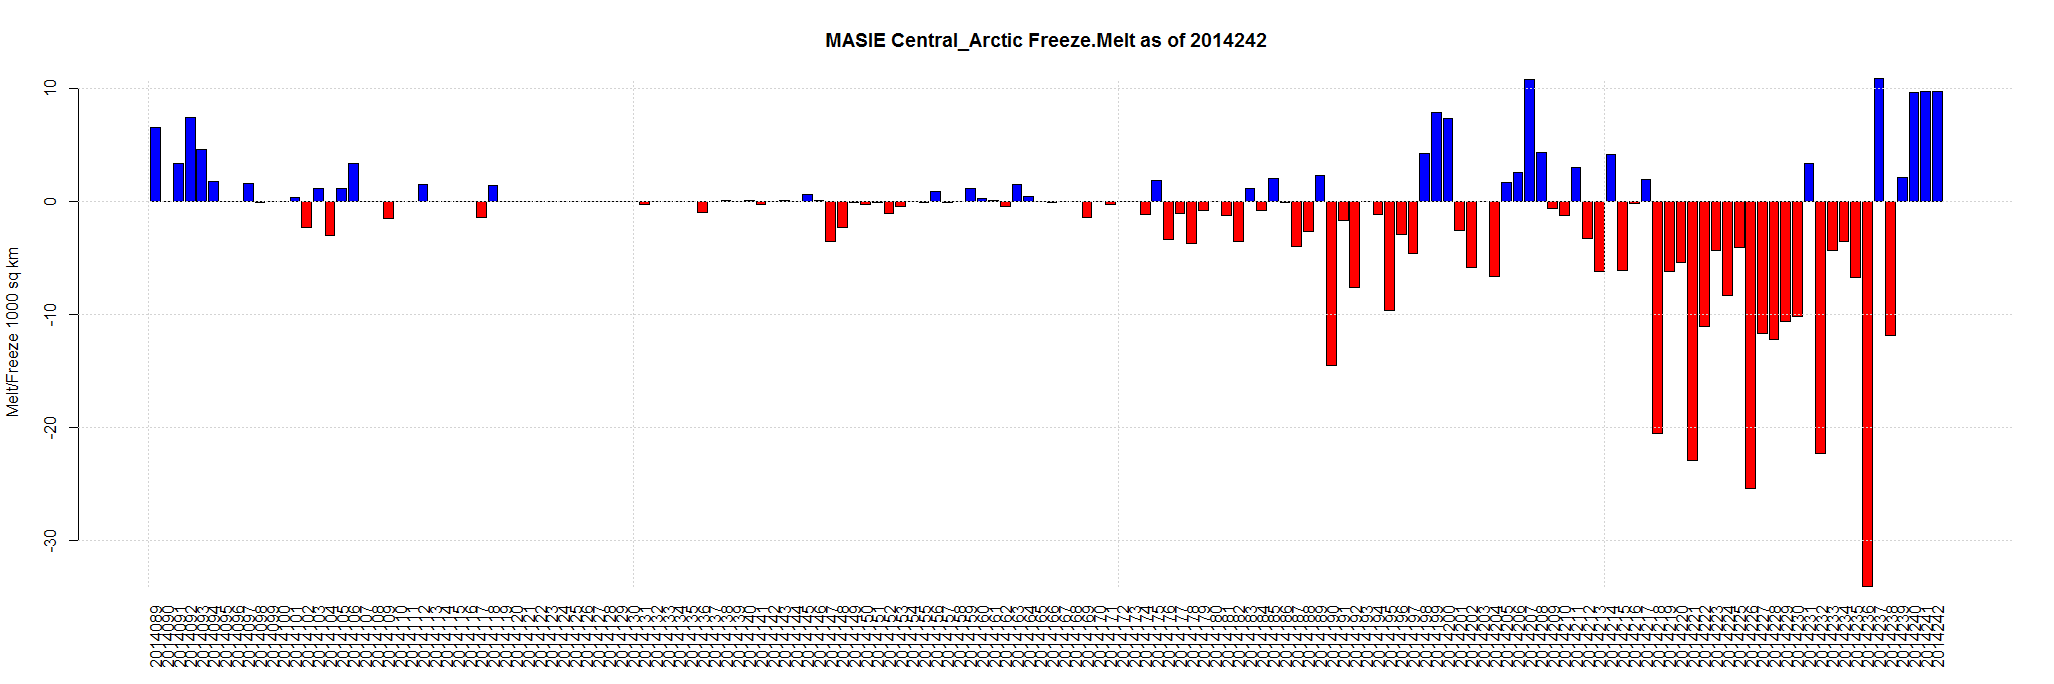
| Central Arctic | 3,221,921 | 3,014,929 | -206,992 | -183,800 | -33,133 | 23,529 | 13,836 | -348 |
| Bering Sea | 697,324 | 0 | -697,324 | 0 | 0 | 0 | 0 | 0 |
| Baltic Sea | 15,337 | 0 | -15,337 | 0 | 0 | 0 | 0 | 0 |
| Sea of Okhotsk | 853,240 | 0 | -853,240 | 0 | 0 | 0 | 0 | 0 |
| Yellow Sea | 0 | 0 | 0 | 0 | 0 | 0 | 0 | 0 |
| Baffin Bay Gulf of St. Lawrence | 1,688,530 | 18,220 | -1,670,310 | -40,563 | 8,444 | 798 | 3,767 | 741 |
| Beaufort Sea | 1,070,445 | 719,419 | -351,026 | -131,590 | -21,198 | 7,301 | 1,100 | 1,485 |
| Greenland Sea | 603,416 | 216,699 | -386,716 | -129,315 | -34,501 | -29,130 | -9,463 | 2,347 |
| East Siberian Sea | 1,087,137 | 544,936 | -542,201 | -341,332 | -69,682 | -1,791 | 17,434 | 5,595 |
| Canadian Archipelago | 853,214 | 522,941 | -330,273 | -136,823 | 2,661 | 8,992 | 13,815 | 27,523 |
| Northern Hemisphere (Total) | 14,805,115 | 5,664,444 | -9,140,671 | -1,638,628 | -377,181 | -140,980 | -19,281 | 1,996 |
| NH (Average Loss per Day) | -58,221 | -58,522 | -26,942 | -20,140 | -6,427 | 1,996 |