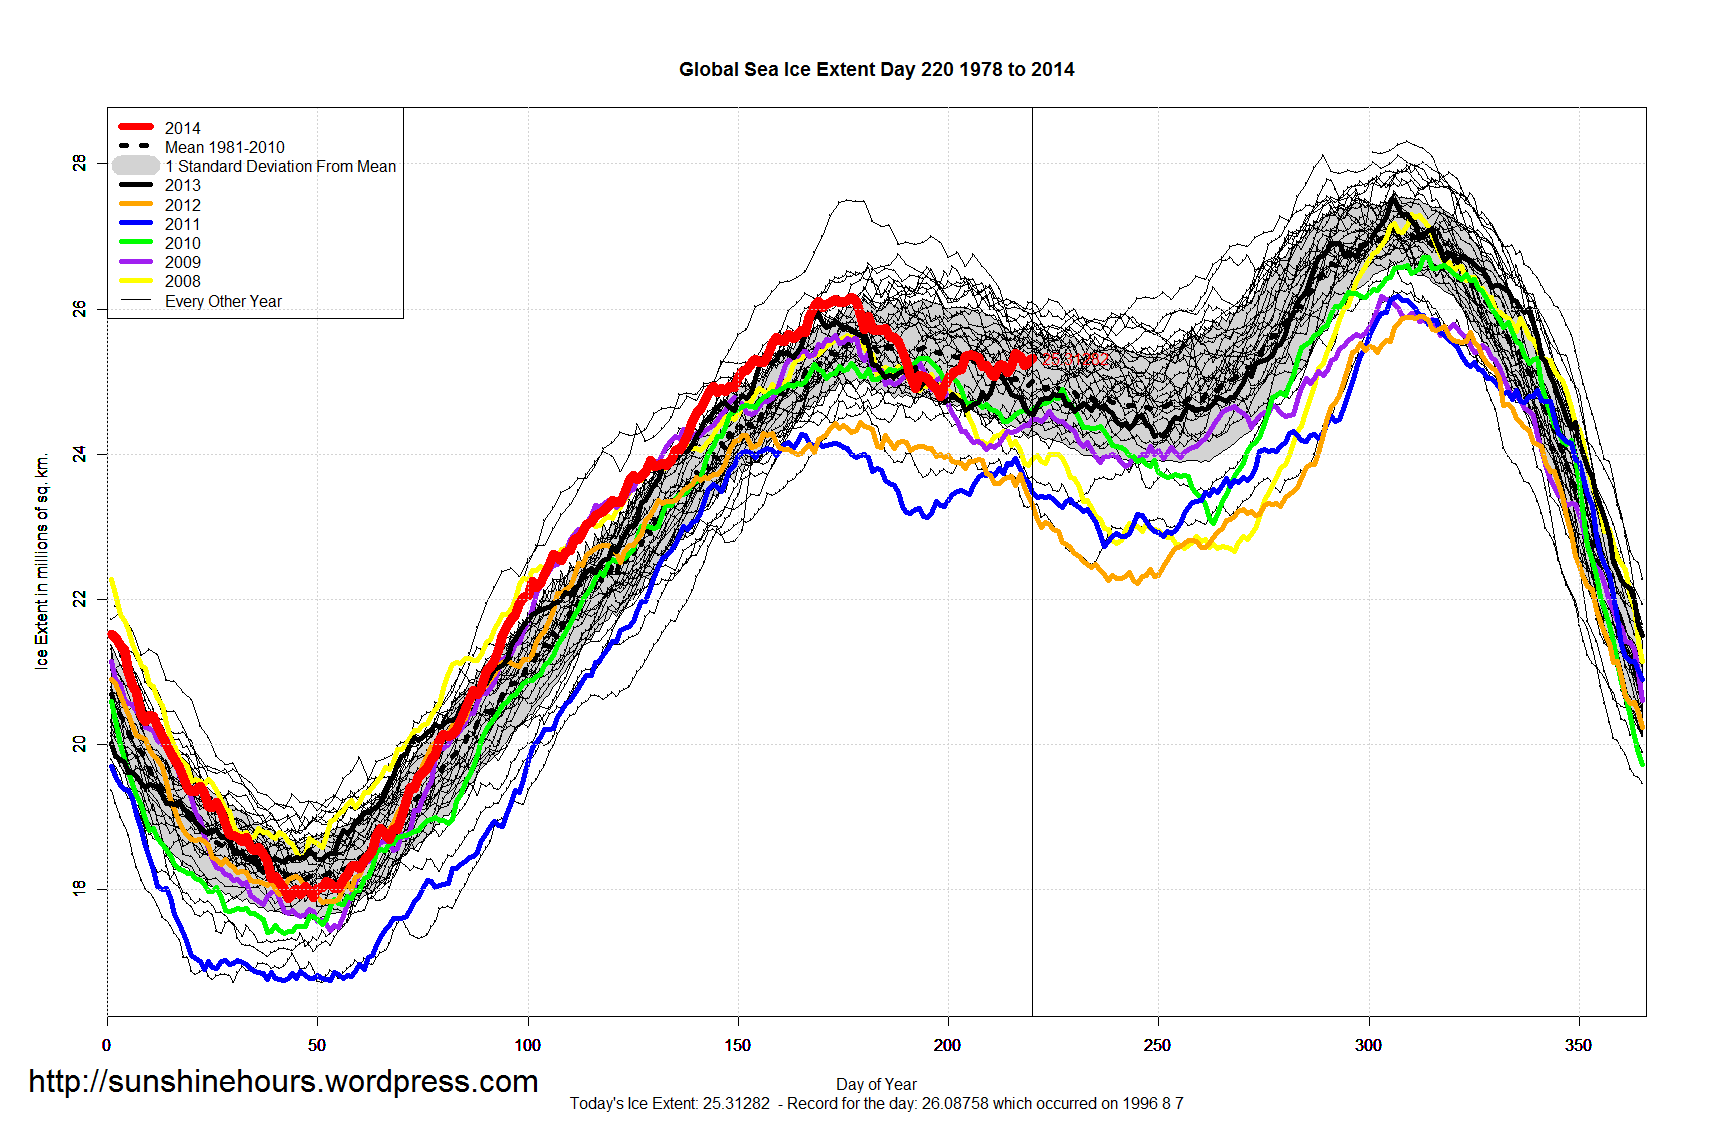
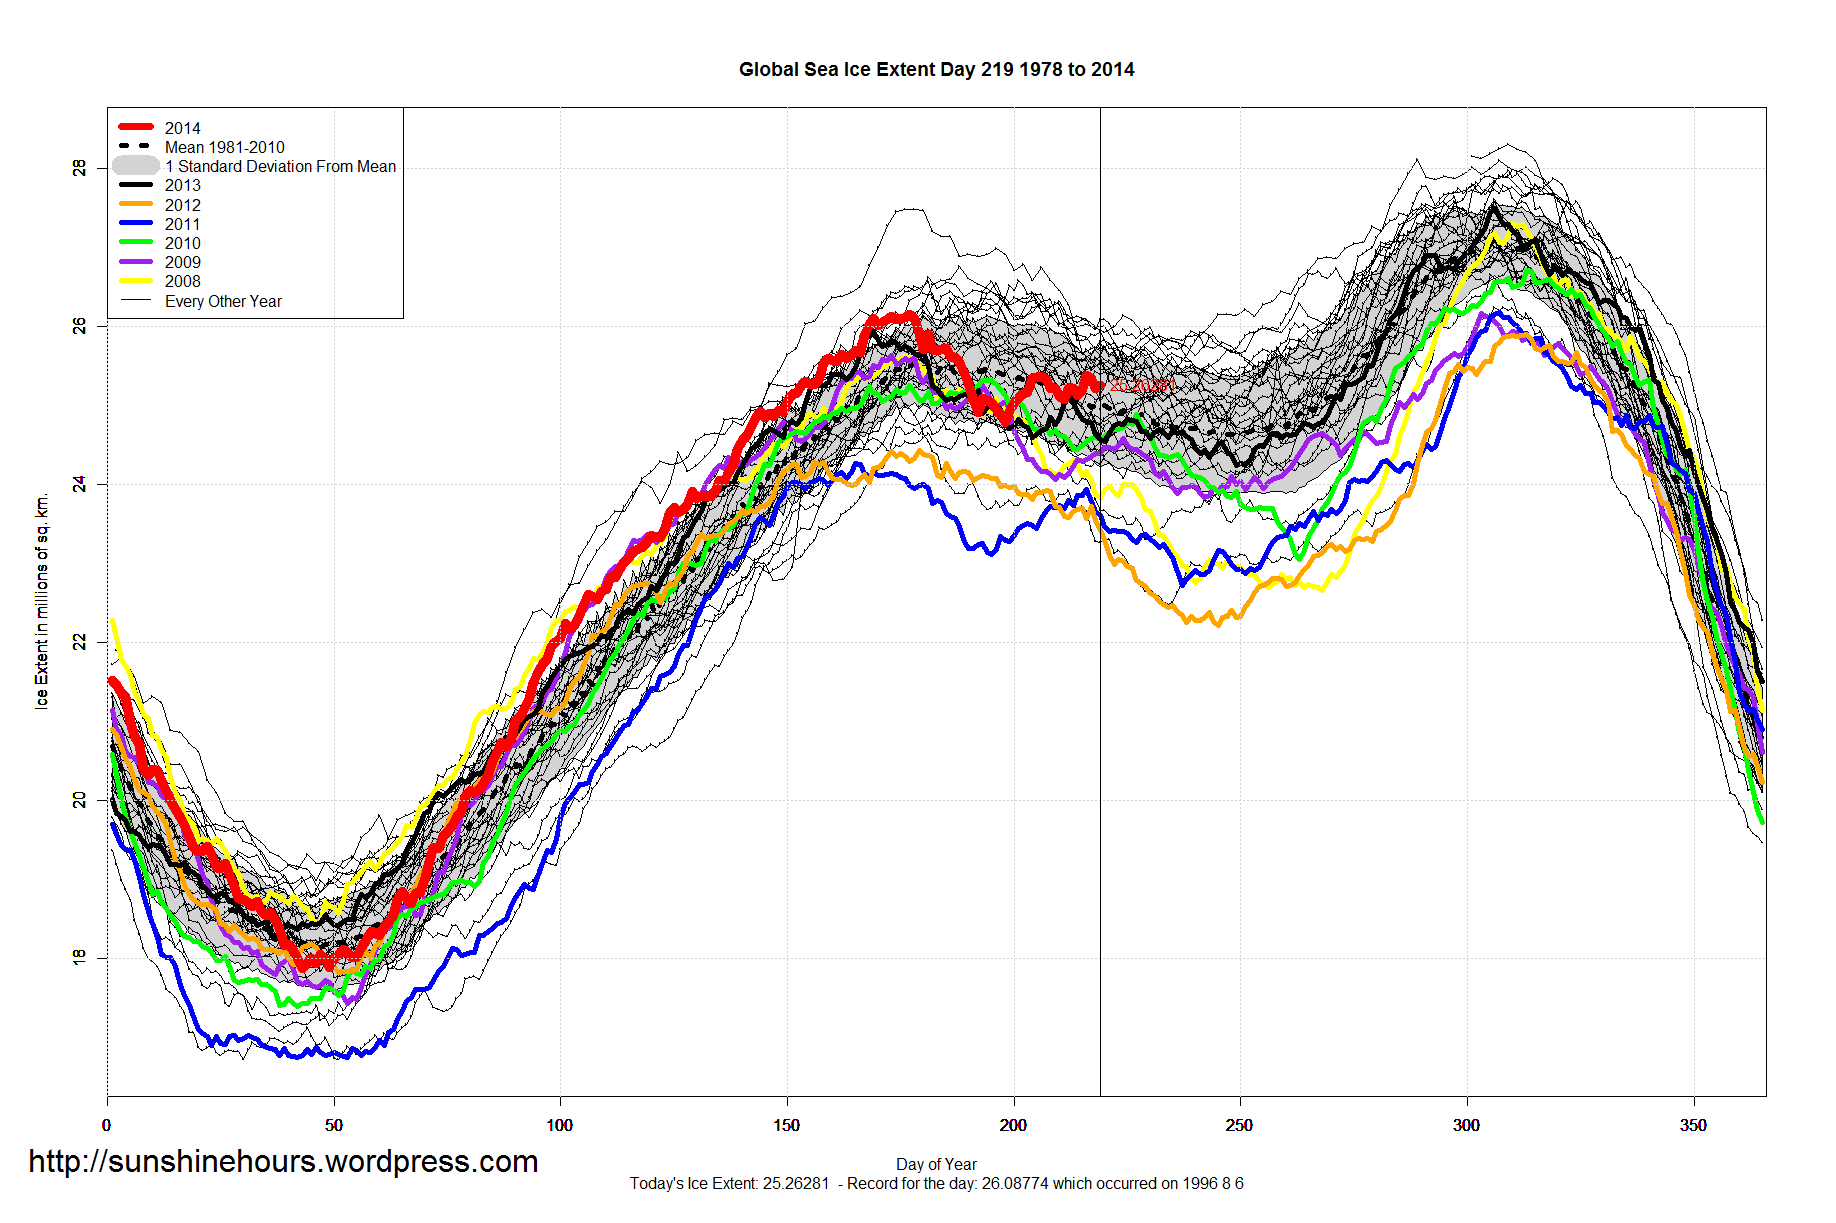
Global Sea Ice Extent Aug 8 2014 – 288,000 sq km Above Normal
Global Sea Ice Extent is 288,000 sq km above the 1981-2010 mean. Still higher than any year (for day 217) since 2000.
These years had less global sea ice at the same day: 1985 1986 1990 1991 1993 1995 1997 2001 2002 2003 2004 2005 2006 2007 2008 2009 2010 2011 2012 2013
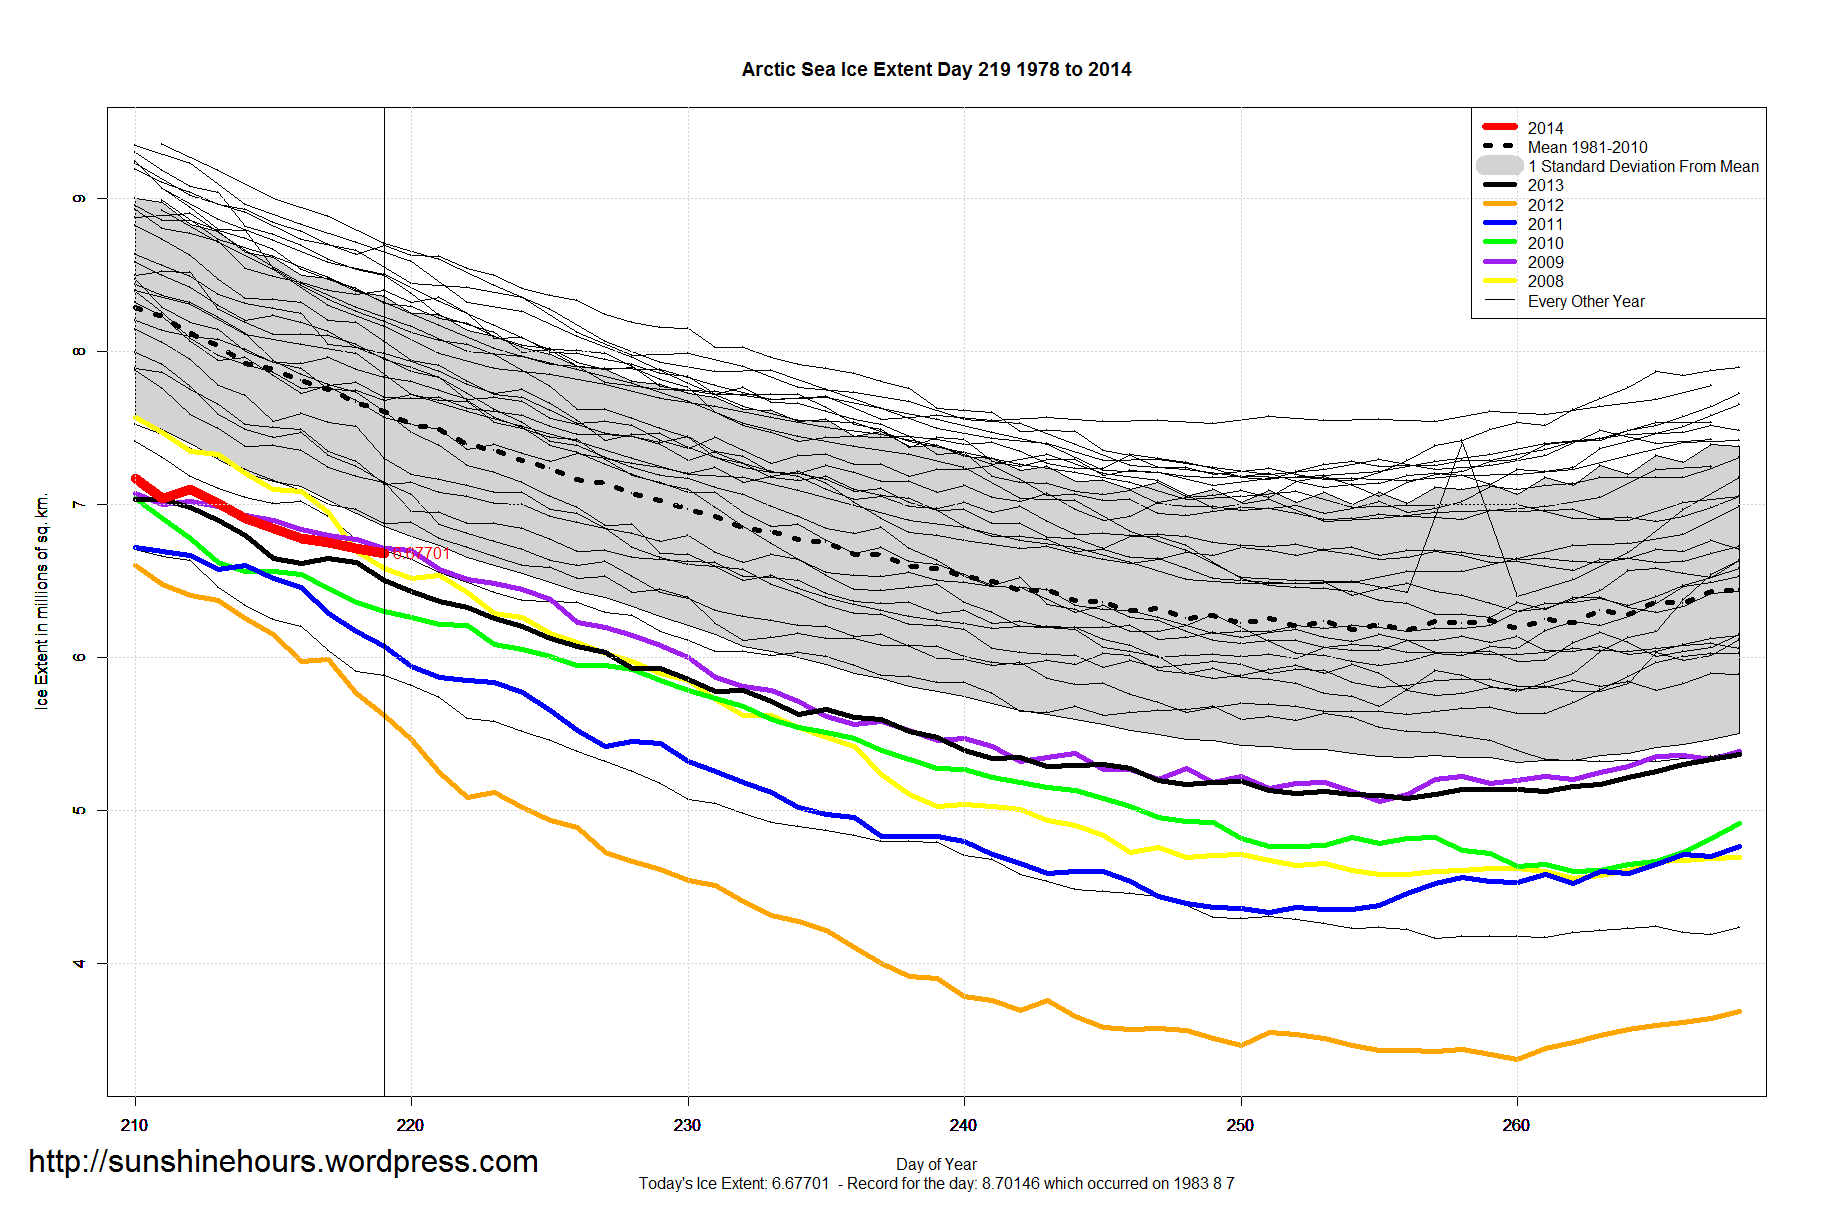
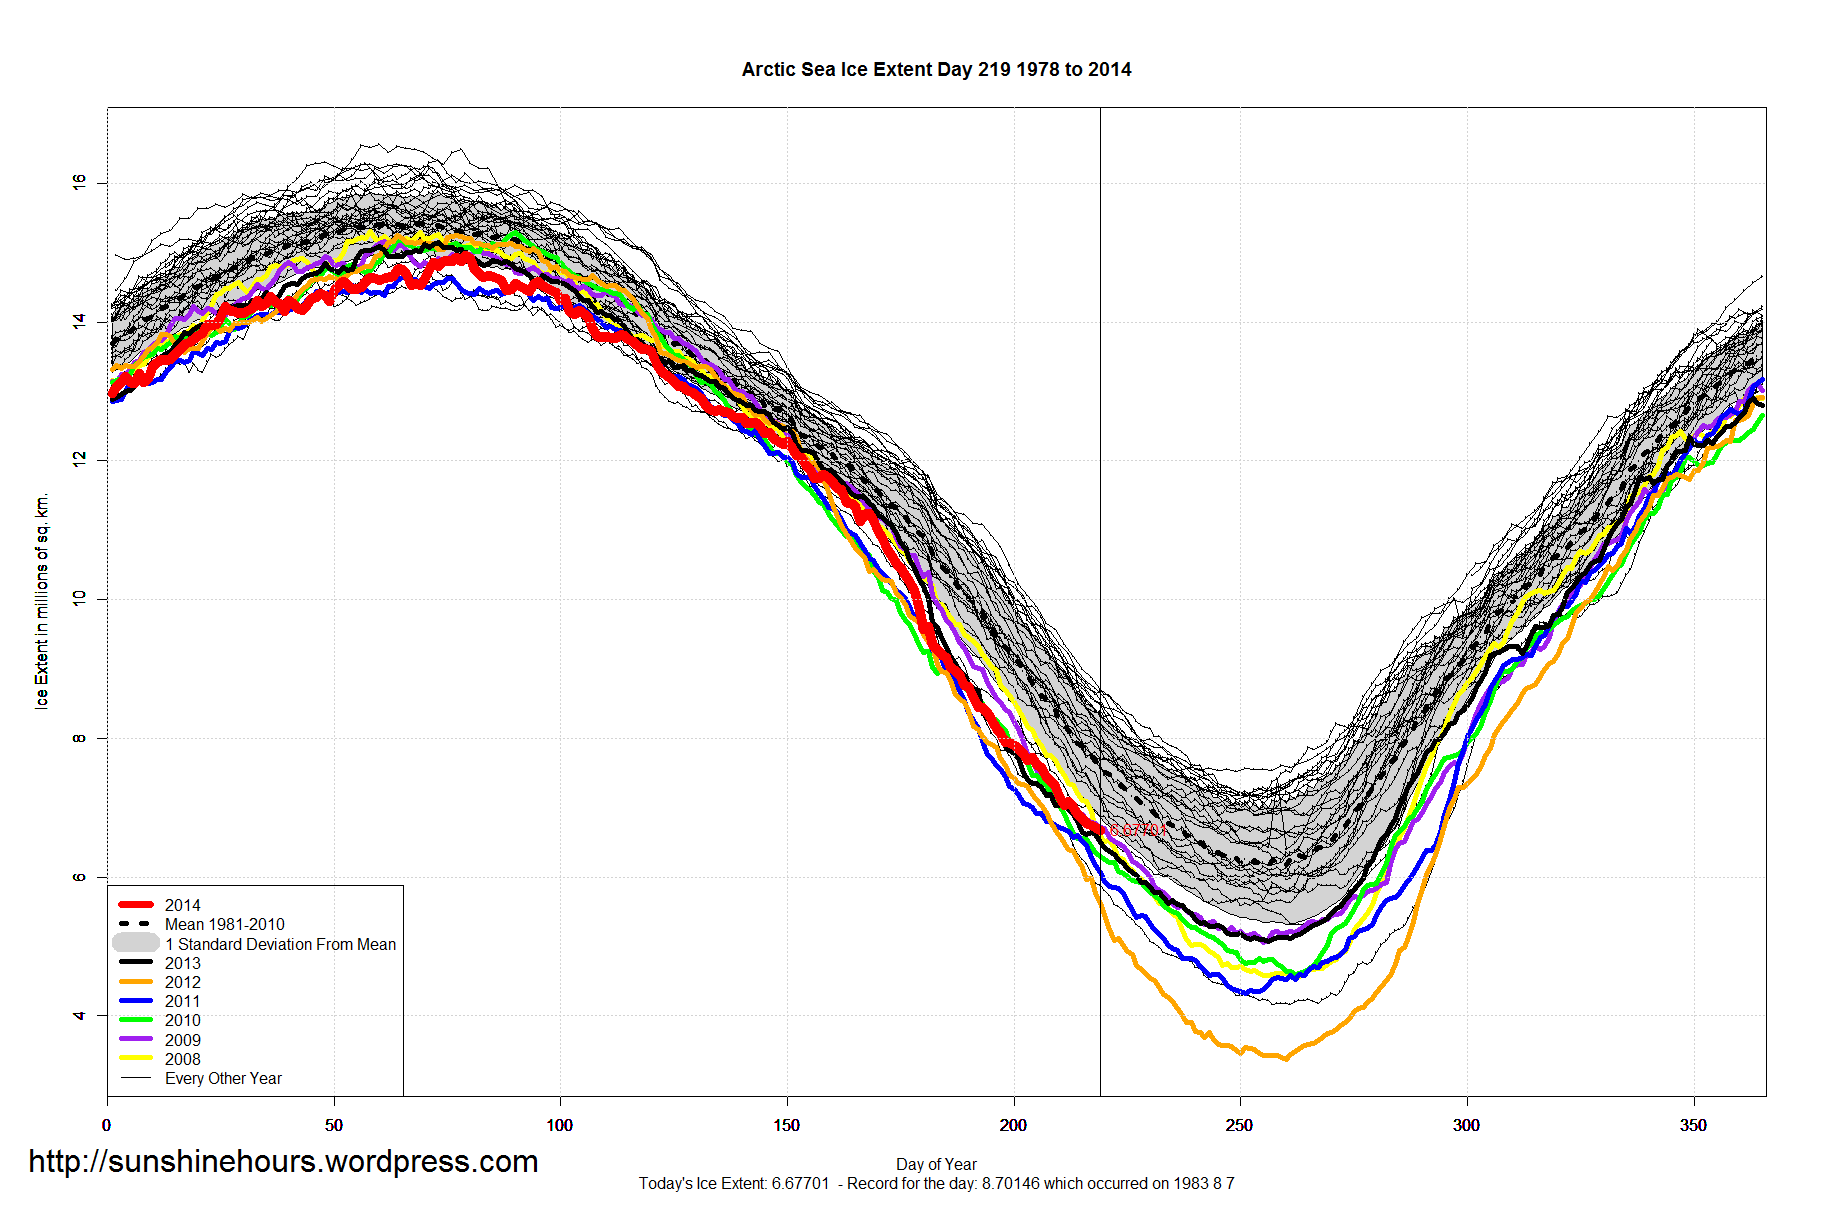
Arctic Sea Ice Extent – Aug 8 2014 – Almost Within One Standard Deviation
Arctic Sea Ice Extent is -986,000 sq km below the 1981-2010 mean. Very slowly approaching the Standard Deviation bounds.

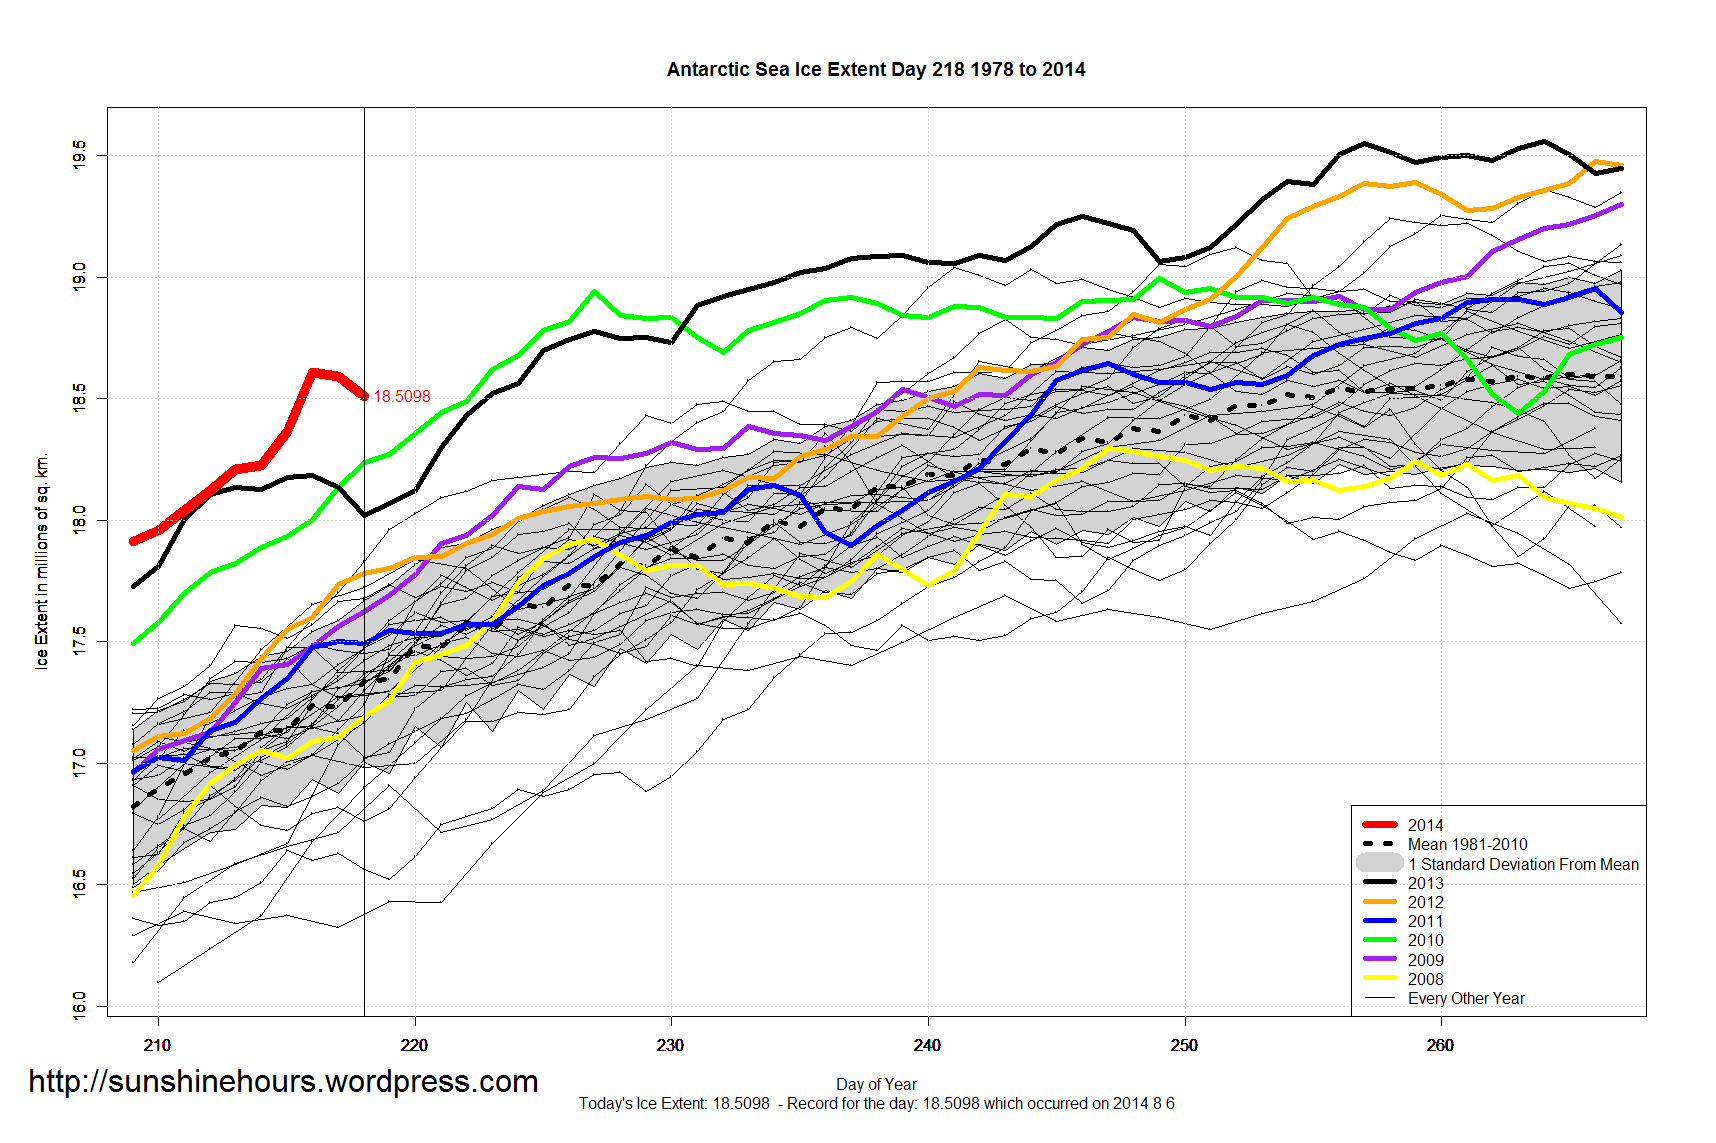
Antarctic Sea Ice Extent Aug 9 2014 – 1,274,000 sq km Above Normal – Amazing Climb!
Antarctic Sea Ice Extent is 1,274,000 sq km above the 1981-2010 mean. That is the 142nd daily record for 2014.
Amazing climb has resumed. 180,000 sq km in last two days. 300,000 sq km above previous record for the same day in 2010.
The Great ‘Green’ Diesel Car Scam Was a Killer
I’ve mentioned this from time. The AGW cult heavily promoted diesel cars to save us from evil CO2 and in return they actually ruined the air quality of the countries that were dumb enough to fear CO2 more than filthy air.
The great irony is now that the CO2 scam is falling apart, governments are now punishing the owners of diesel cars for being dumb enough to trust the governments recommendations to buy diesel care.
Here is the sad truth about diesel cars in the UK.
“While diesel produces lower emissions of three greenhouse gases (carbon dioxide, methane and nitrous oxide), the report said, it produces larger emissions of ‘nitrogen oxides’ and ‘most importantly, far larger emissions of particulate matter and black smoke’.
These, it transpires, are the ingredients now causing such concern about diesel cars. Nitrogen oxides have been linked to bronchitis and heart disease, the black smoke can exacerbate asthma, while the ultra-fine particles can penetrate deep into the lungs and bloodstream.
In 2012, the World Health Organisation classified diesel fume particulates as a carcinogen, while other research suggests that they can cause brain damage and autism.
According to Professor Frank Kelly, chairman of the Department of Health’s committee on air pollution, diesel engines could be responsible for more than 7,000 deaths a year.”
And now owners will be punished:
“Islington council in London is introducing £20 on-the-spot fines for any diesel driver caught with his engine running when stationary.
Mayor of London Boris Johnson has announced, in response to the threat of fines from the EU for breaching air pollution limits, that from 2020 diesel owners driving into the capital will have to pay a £10 pollution premium.”
(h/t Climate Realists)
Previous interesting stories:
““Successive governments knew more than 10 years ago that diesel was producing all these harmful pollutants, but they myopically plowed on with their CO2 agenda,” said Simon Birkett, founder of Clean Air in London, a nonprofit group. “It’s been a catastrophe for air pollution, and that’s not too strong a word. It’s a public-health catastrophe.””
“The small particles blighting the air of Delhi and other leading developing cities around the world are often dust from construction sites, pollution from diesel engines or industrial emissions.”
Canada ‘Normals’ July 2014 West to East and North to South
These are just the stations deemed ‘Normals” by Environment Canada. The temperature is the departure from the 1971-2000 average in Celsius. I’m using monthly summary.
This graphs data is sorted by Longitude (West to East) and By Name. Click for bigger.

This graphs data is sorted by Latitude (North to South) and By Name. Click for bigger.

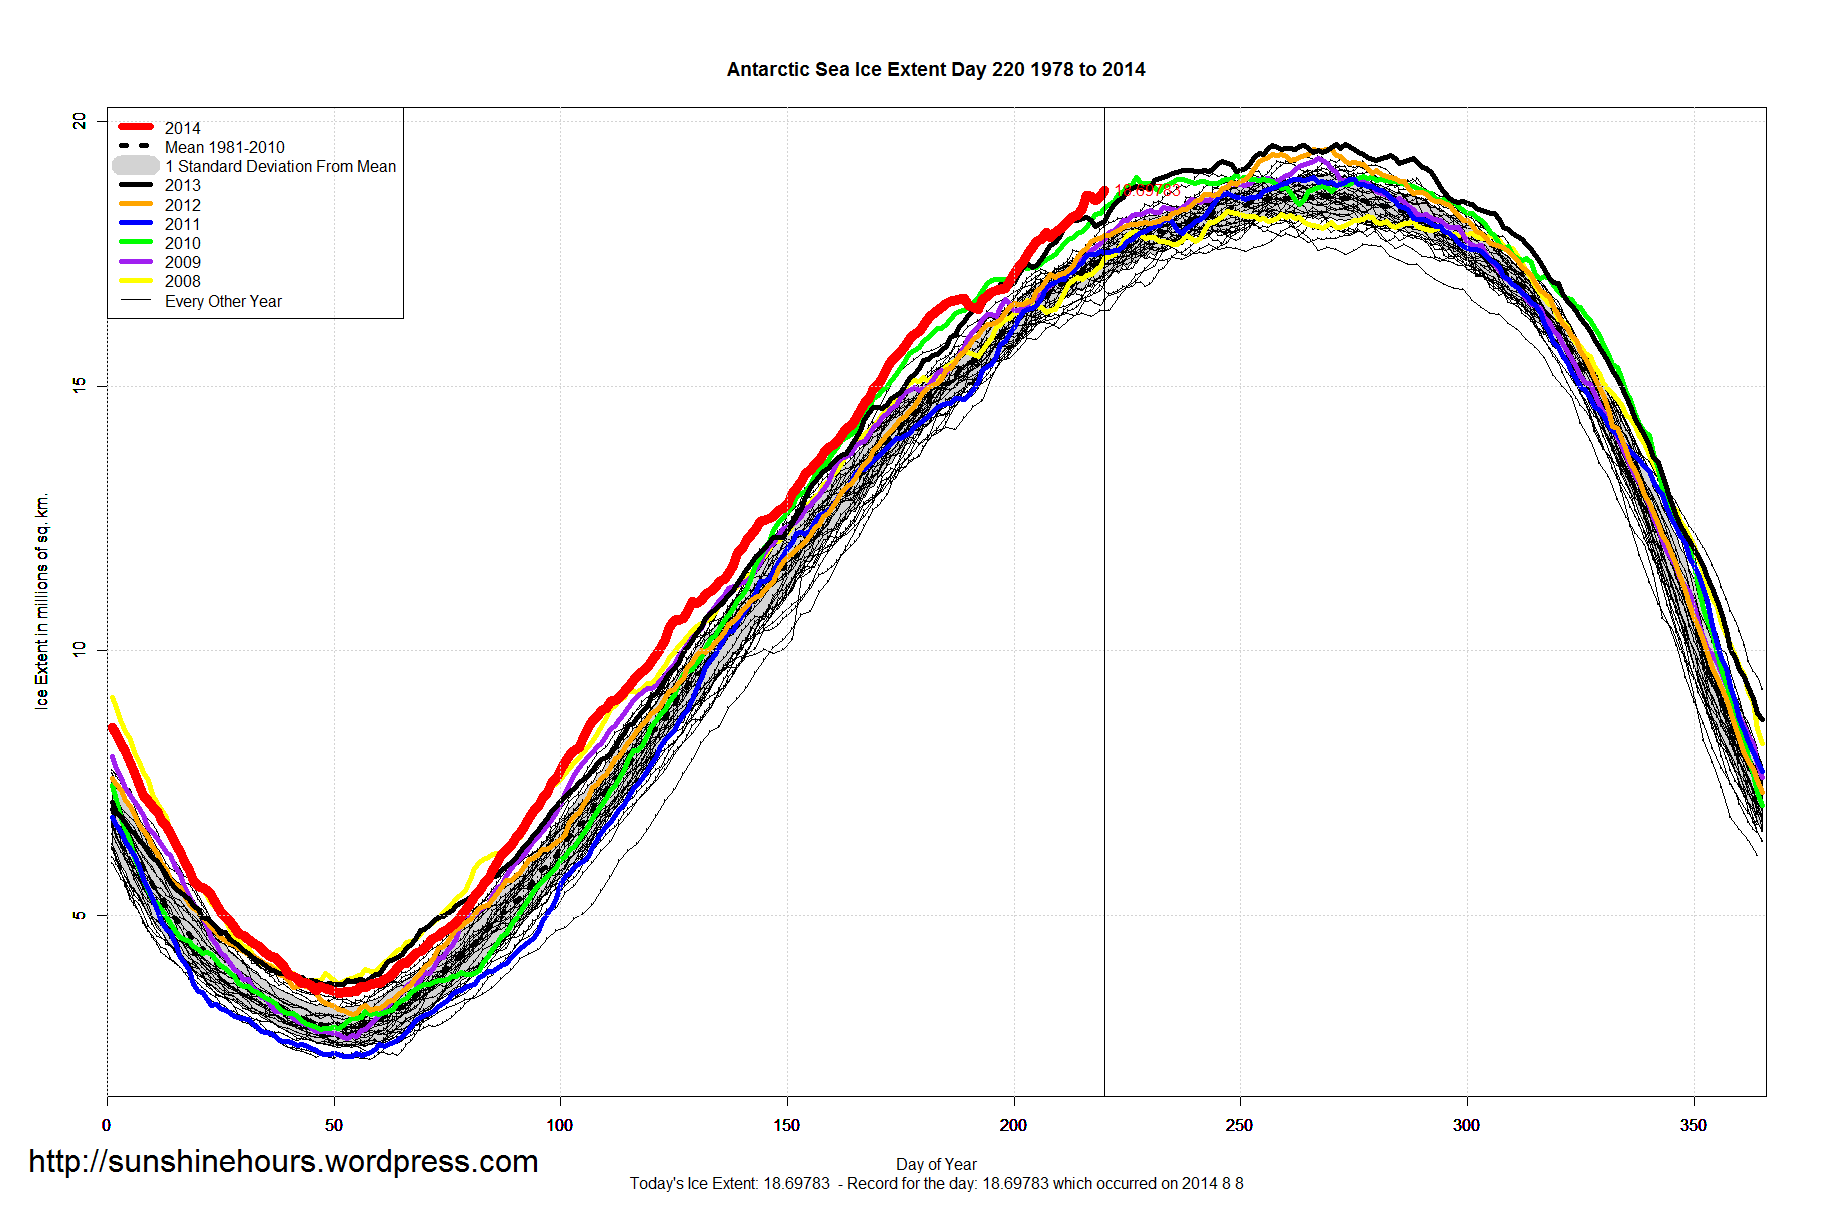
Antarctic Sea Ice Extent Aug 8 2014 – 1,235,000 sq km Above Normal – 141st Daily Record
Antarctic Sea Ice Extent is 1,235,000 sq km above the 1981-2010 mean. That is the 141st daily record for 2014.

Arctic Sea Ice Extent – Aug 8 2014 – Still Approaching One STD
Arctic Sea Ice Extent is -990,000 sq km below the 1981-2010 mean. Very slowly approaching the Standard Deviation bounds.
The latest data is from day 219. Day 245 was the earliest minimum in 1987 and day 265 was the latest minimum in 2005.
Global Sea Ice Extent Aug 8 2014 – 245,000 sq km Above Normal
Global Sea Ice Extent is 245,000 sq km above the 1981-2010 mean. The last year it was higher on this day was back in 2000.
This is the list of years with LESS global sea ice extent on day 219;
1985 1986 1990 1991 1993 1995 1997 2001 2002 2003 2004 2005 2006 2007 2008 2009 2010 2011 2012 2013 2014

Antarctic Sea Ice Extent Aug 7 2014 – 1,223,000 sq km Above Normal – 140th Daily Record
Antarctic Sea Ice Extent is 1,223,000 sq km above the 1981-2010 mean. 140th daily record.