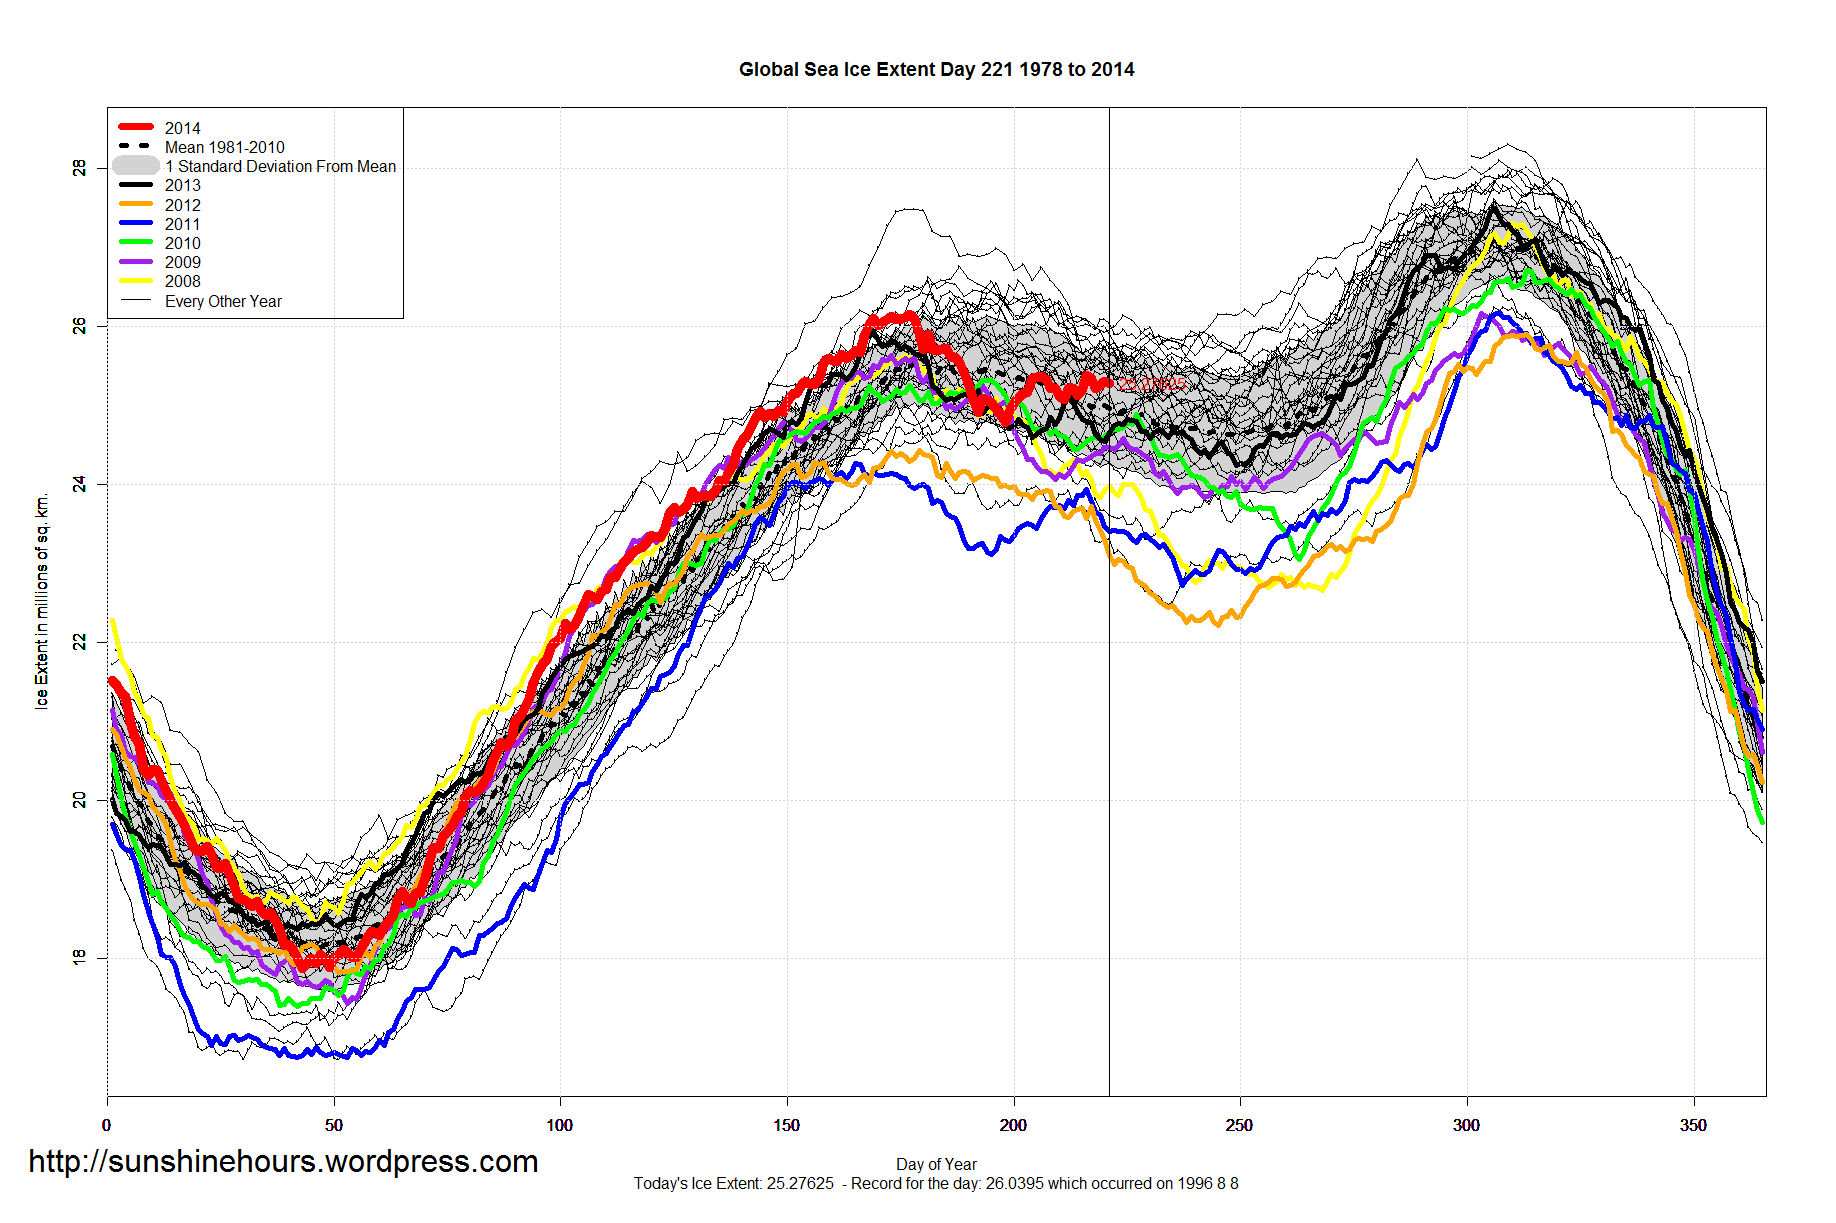
Global Sea Ice Extent is 216,000 sq km above the 1981-2010 mean. Notice how much closer it is to the highest for the day than the lowest.

Global Sea Ice Extent is 216,000 sq km above the 1981-2010 mean. Notice how much closer it is to the highest for the day than the lowest.
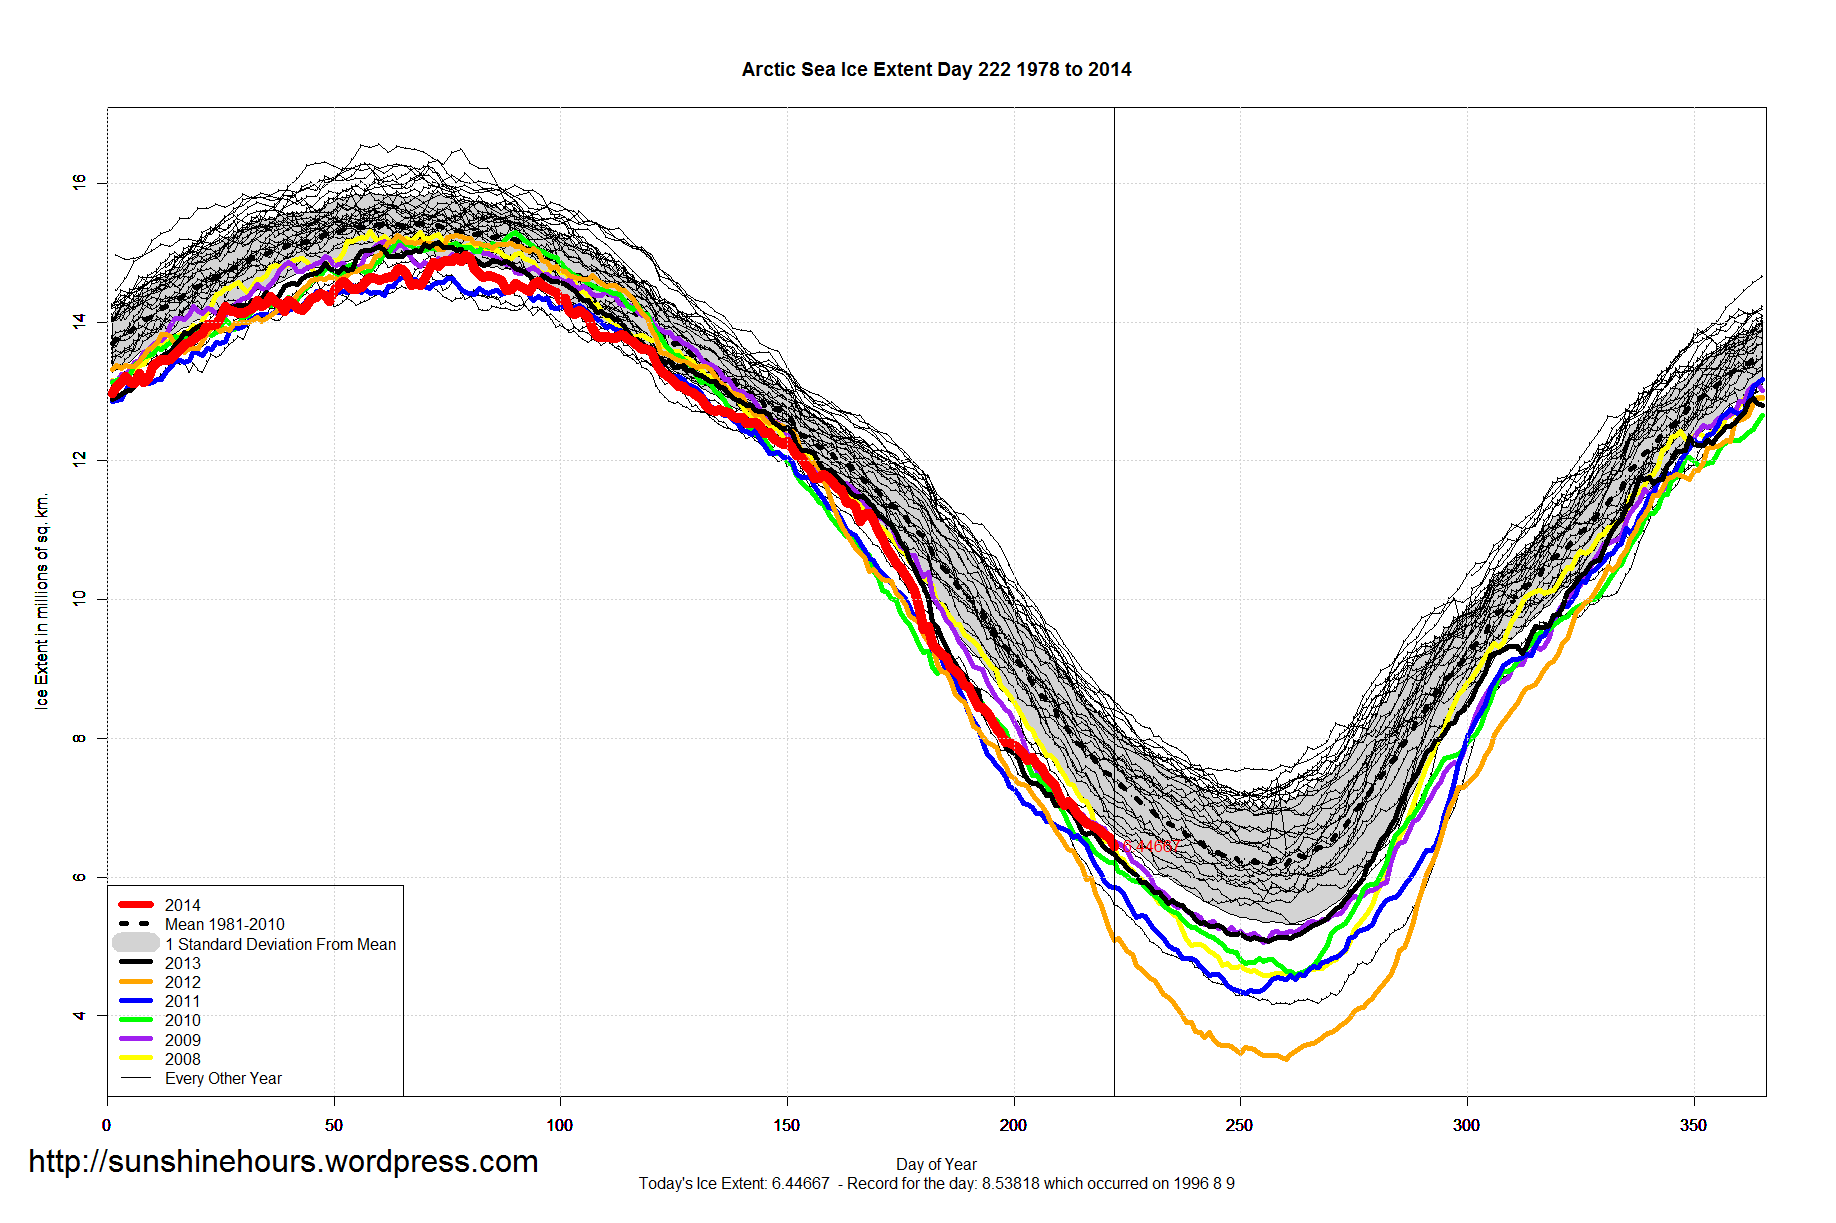
Arctic Sea Ice Extent is -1,025,000 sq km below the 1981-2010 mean.
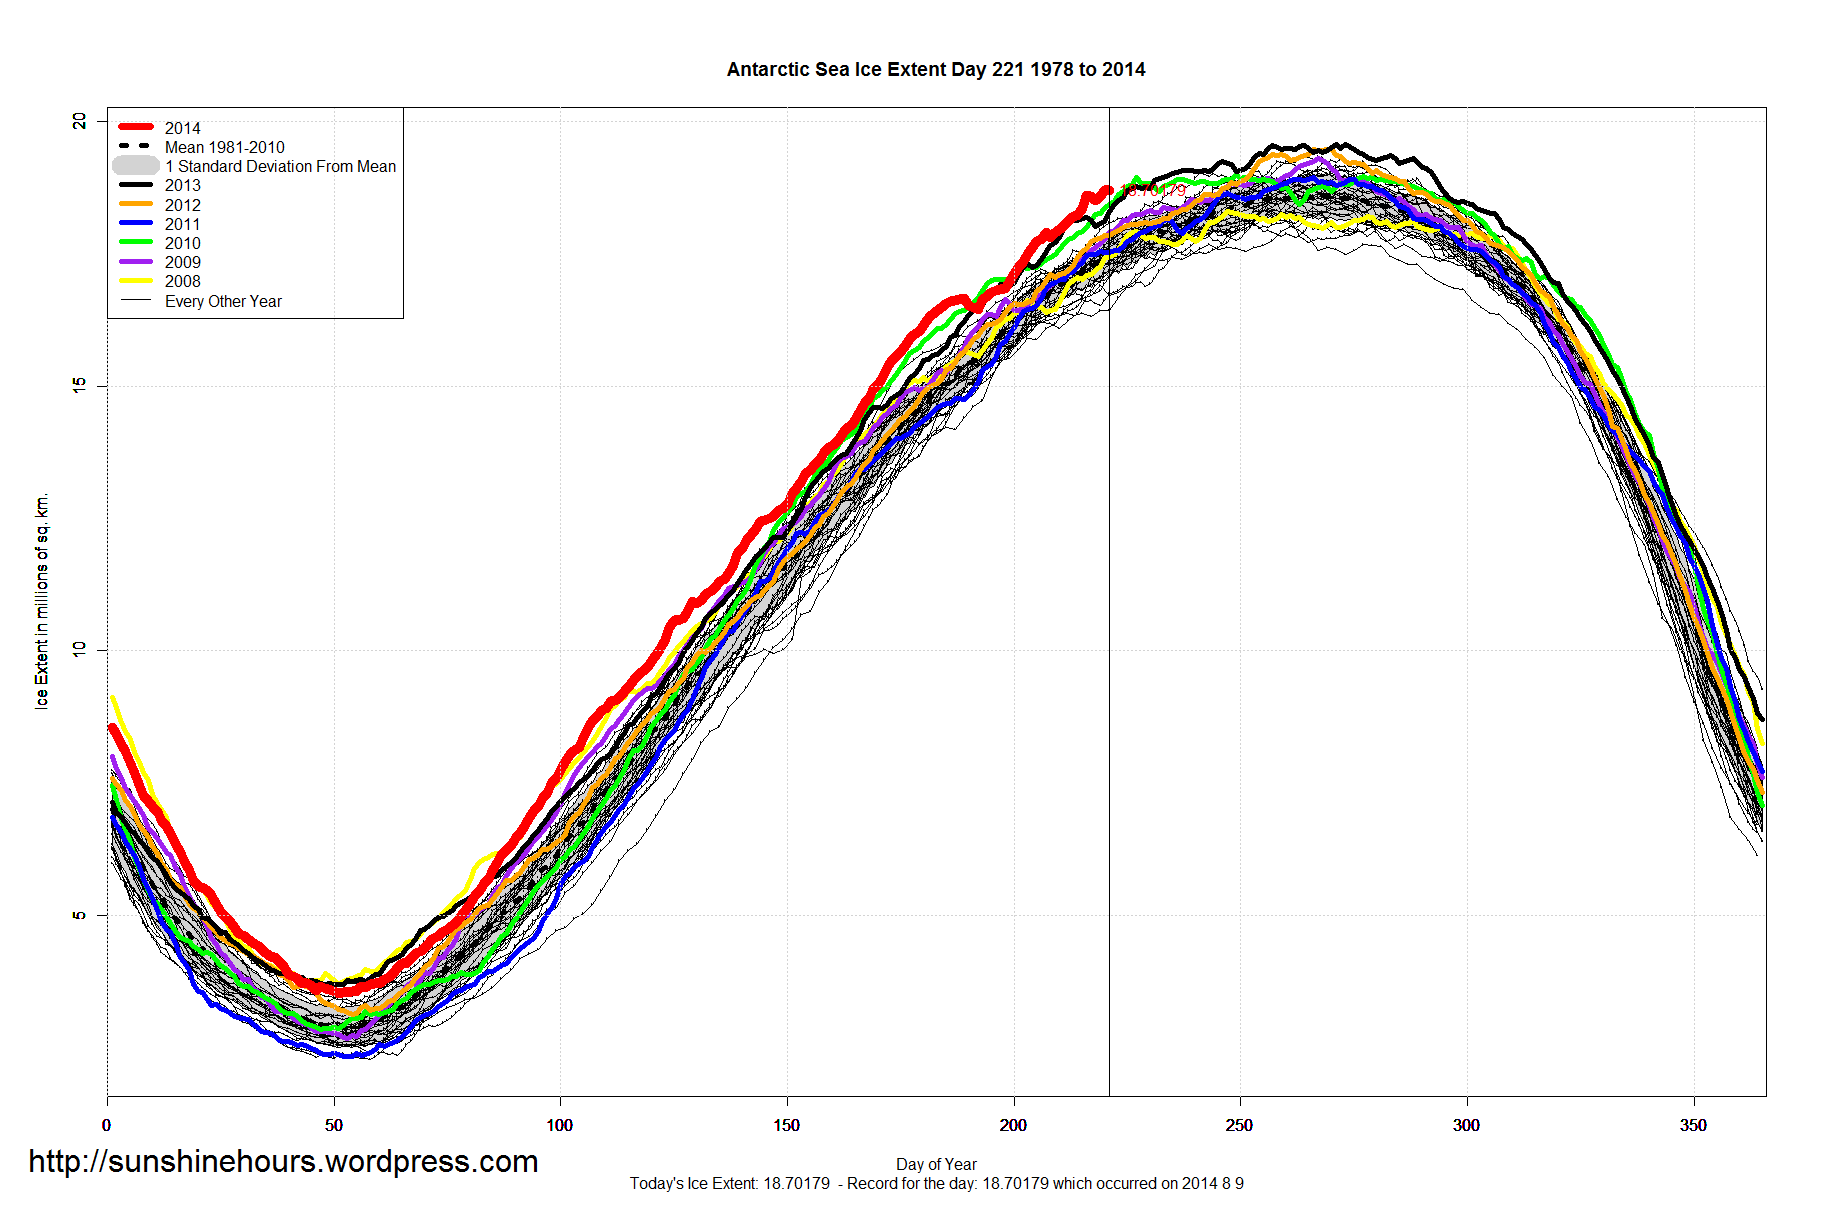
Antarctic Sea Ice Extent is 1,239,000 sq km above the 1981-2010 mean. That is the 144th daily record for 2014.

Global Sea Ice Extent is 215,000 sq km above the 1981-2010 mean. Still higher than any year (for day 222) since 2000. And 2,000,000 sq km higher than 2012.

Aug 10 2014 MASIE Update – Steady Melting … Central Arctic is melting.
Data here. Click for bigger.
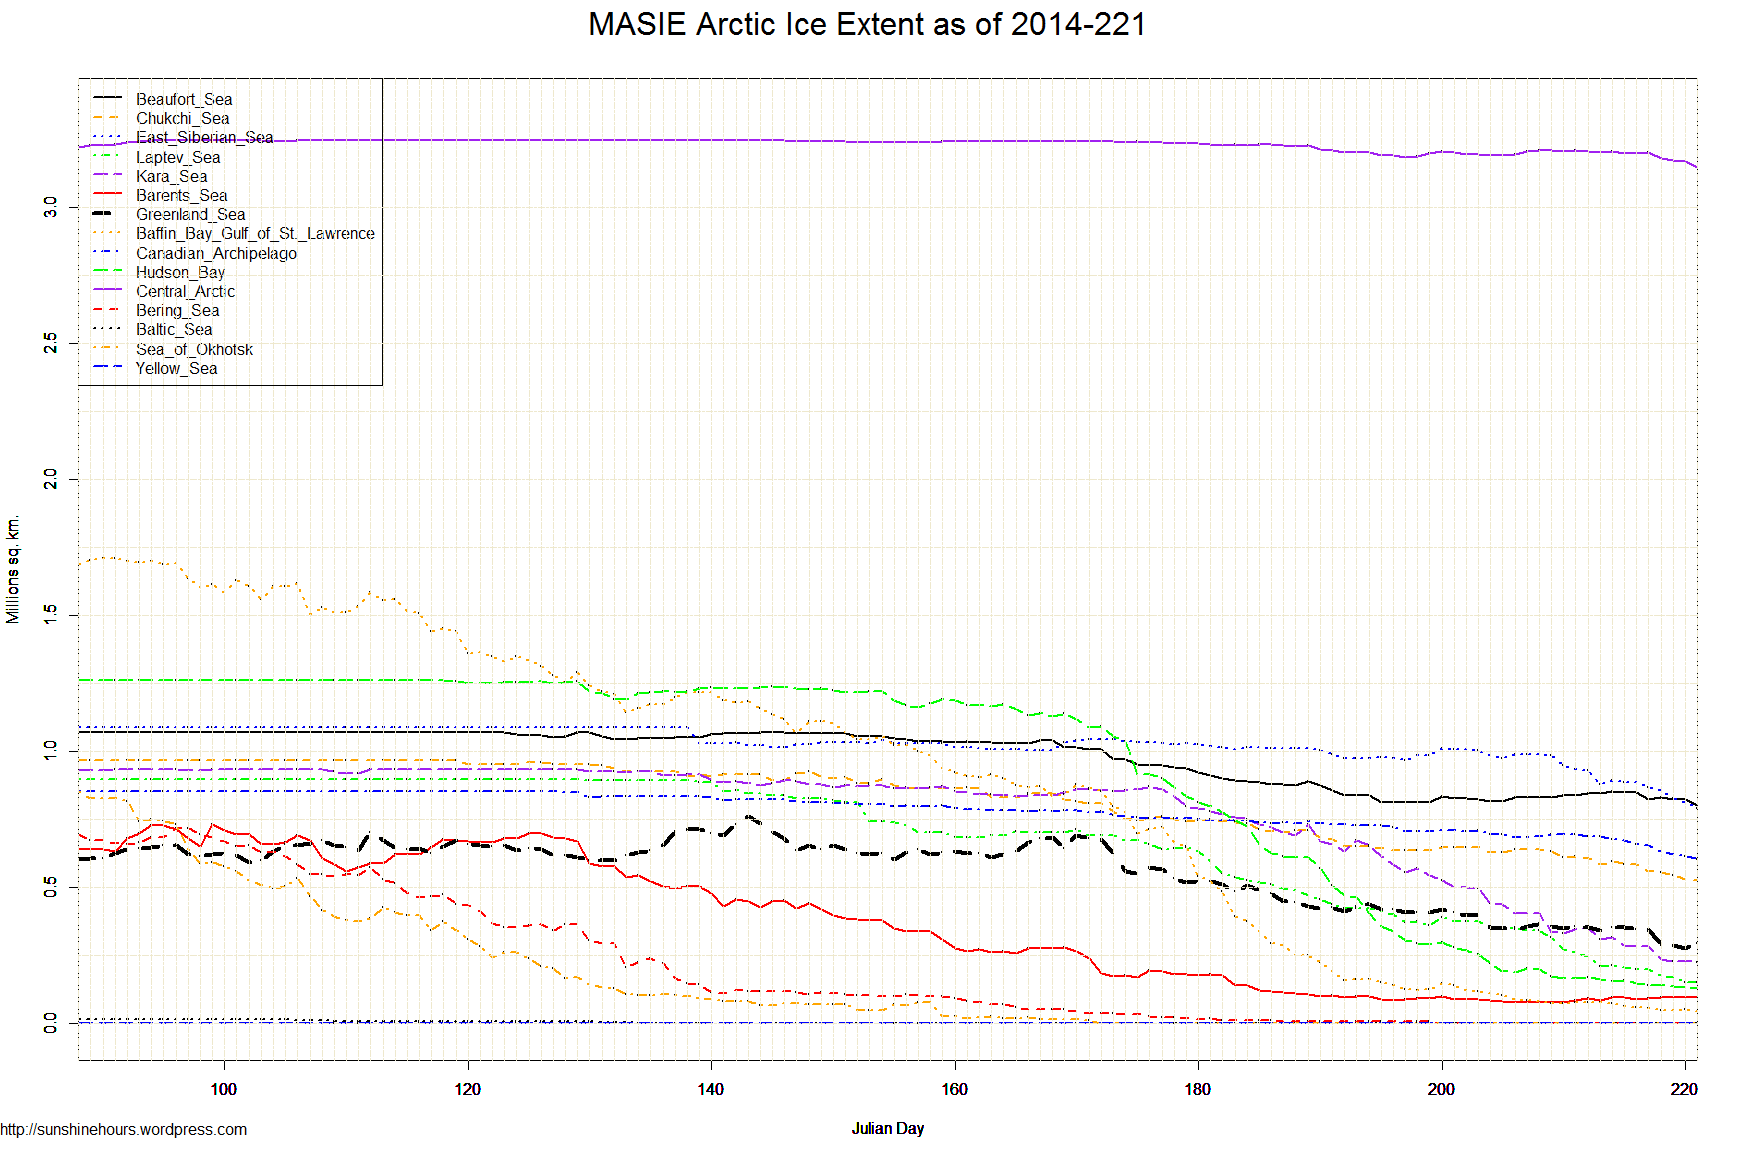


| Region | 134 days ago | End | Last 133 | Last 28 | Last 14 | Last 7 | Last 3 | Last 1 |
| Central Arctic | 3,221,921 | 3,145,737 | -76,184 | -57,678 | -59,038 | -59,251 | -34,477 | -22,901 |
| East Siberian Sea | 1,087,137 | 791,590 | -295,547 | -182,067 | -199,330 | -103,915 | -65,863 | -22,841 |
| Beaufort Sea | 1,070,445 | 803,969 | -266,476 | -36,621 | -27,781 | -49,680 | -27,006 | -20,195 |
| Canadian Archipelago | 853,214 | 604,842 | -248,372 | -123,937 | -78,833 | -73,380 | -27,803 | -10,425 |
| Baffin Bay Gulf of St. Lawrence | 1,688,530 | 46,363 | -1,642,168 | -116,552 | -38,384 | -26,186 | -3,536 | -6,523 |
| Hudson Bay | 1,260,903 | 128,016 | -1,132,887 | -337,806 | -73,619 | -26,852 | -12,132 | -5,433 |
| Chukchi Sea | 966,006 | 525,015 | -440,991 | -125,838 | -116,792 | -70,511 | -30,787 | -4,666 |
| Kara Sea | 933,859 | 224,726 | -709,133 | -447,050 | -179,922 | -91,361 | -10,154 | -4,101 |
| Barents Sea | 645,917 | 96,613 | -549,304 | -1,960 | 16,766 | 1,995 | -1,104 | 0 |
| Bering Sea | 697,324 | 0 | -697,324 | -8,658 | -15 | 0 | 0 | 0 |
| Baltic Sea | 15,337 | 0 | -15,337 | 0 | 0 | 0 | 0 | 0 |
| Sea of Okhotsk | 853,240 | 0 | -853,240 | 0 | 0 | 0 | 0 | 0 |
| Yellow Sea | 0 | 0 | 0 | 0 | 0 | 0 | 0 | 0 |
| Laptev Sea | 897,845 | 151,499 | -746,346 | -270,255 | -189,584 | -61,540 | -26,558 | 383 |
| Greenland Sea | 603,416 | 296,306 | -307,110 | -136,411 | -60,481 | -55,724 | 9,806 | 18,966 |
| Northern Hemisphere (Total) | 14,805,115 | 6,815,819 | -7,989,295 | -1,844,834 | -1,007,014 | -616,403 | -229,614 | -77,737 |
| NH (Average Loss per Day) | -59,622 | -65,887 | -71,930 | -88,058 | -76,538 | -77,737 |
Antarctic Sea Ice Extent is 1,221,000 sq km above the 1981-2010 mean. 143rd daily record.
Global Sea Ice Extent is 253,000 sq km above the 1981-2010 mean. Still higher than any year (for day 221) since 2000.
If “global warming” causes drought or floods then certainly when the weather is perfect that too is caused by global warming … right?
“In a typical growing season, at least some corn-growing states would have experienced drought or other production problems. But the 18 states that grow 91 percent of the nation’s corn have experienced nearly ideal conditions this year, as adequate rain fell when plants emerged and cooler summer temperatures minimized heat stress.”
(h/t Suyts)
This is huge. And logical. Only idiots thought plants prefer freezing to death.
“Not all species flee rising temperatures. As the mercury has inched upward across western North America over the last 40 years, many plant species have moved downhill, toward—not away from—warmer climates, according to the results of a new study.
The finding adds to growing evidence that temperature isn’t the only factor influencing how Earth’s life will respond to climate change.”
Isn’t that last sentence hilarious? “Temperature isn’t the only factor …’ Well DUH! But unfortunately the AGW cult has twisted science so much that many are surprised that plants might like it warmer than colder.
“The results of the analysis were unexpected. More than 60% of plants shifted their distributions downward, toward warmer, lower elevations—despite significant climate warming across the regions under study, the team reported online on 24 July in Global Change Biology. Even more striking, all plants within a region—regardless of species—moved in the same direction.”
What a shocker eh? Given a choice between the cold of the 1970s, plants like it warmer. Who would have thought? …. Only people with a brain thought that!
http://www.thegwpf.org/plants-have-unexpected-response-to-climate-change/
http://onlinelibrary.wiley.com/doi/10.1111/gcb.12697/abstract
Arctic Sea Ice Extent is -968,000 sq km below the 1981-2010 mean. Highest for this day since 2006.

