Arctic Sea Ice is 0.83% below the 1981-2010 Mean
Arctic Sea Ice is 0.83% below the 1981-2010 Mean
“The waste heat generated by car engines, power plants, home furnaces and other fossil fuel-burning machinery plays an unappreciated role in influencing regional climates, new computer simulations suggest. By altering atmospheric circulation, human-made heat may raise temperatures by as much as 1 degree Celsius during winter in the northernmost parts of the world.”
http://www.sciencenews.org/view/generic/id/347857/description/Human-made_waste_heat_warms_climate
Citations
G.J. Zhang, M. Cai and A. Hu.
Energy consumption and the unexplained winter warming over northern Asia and North America.
Nature Climate Change. Published online January 27, 2013. doi:10.1038/nclimate1803.
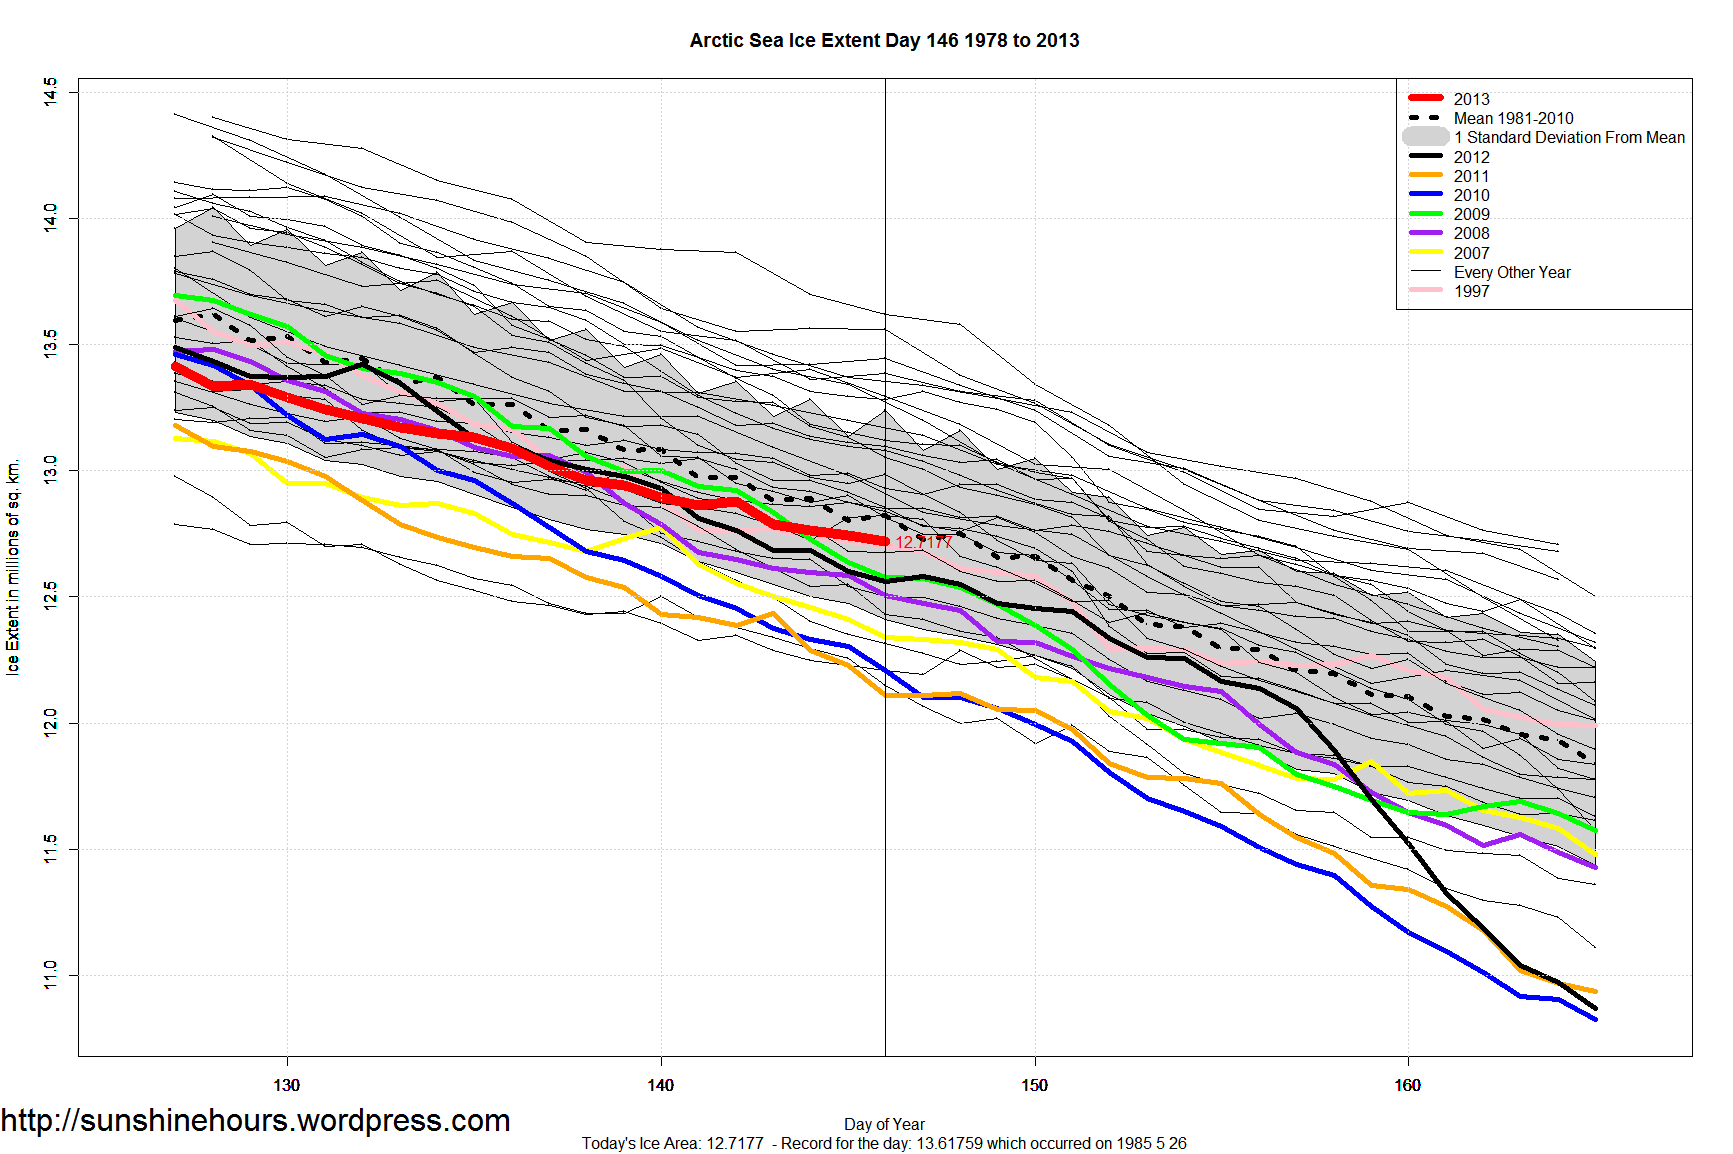
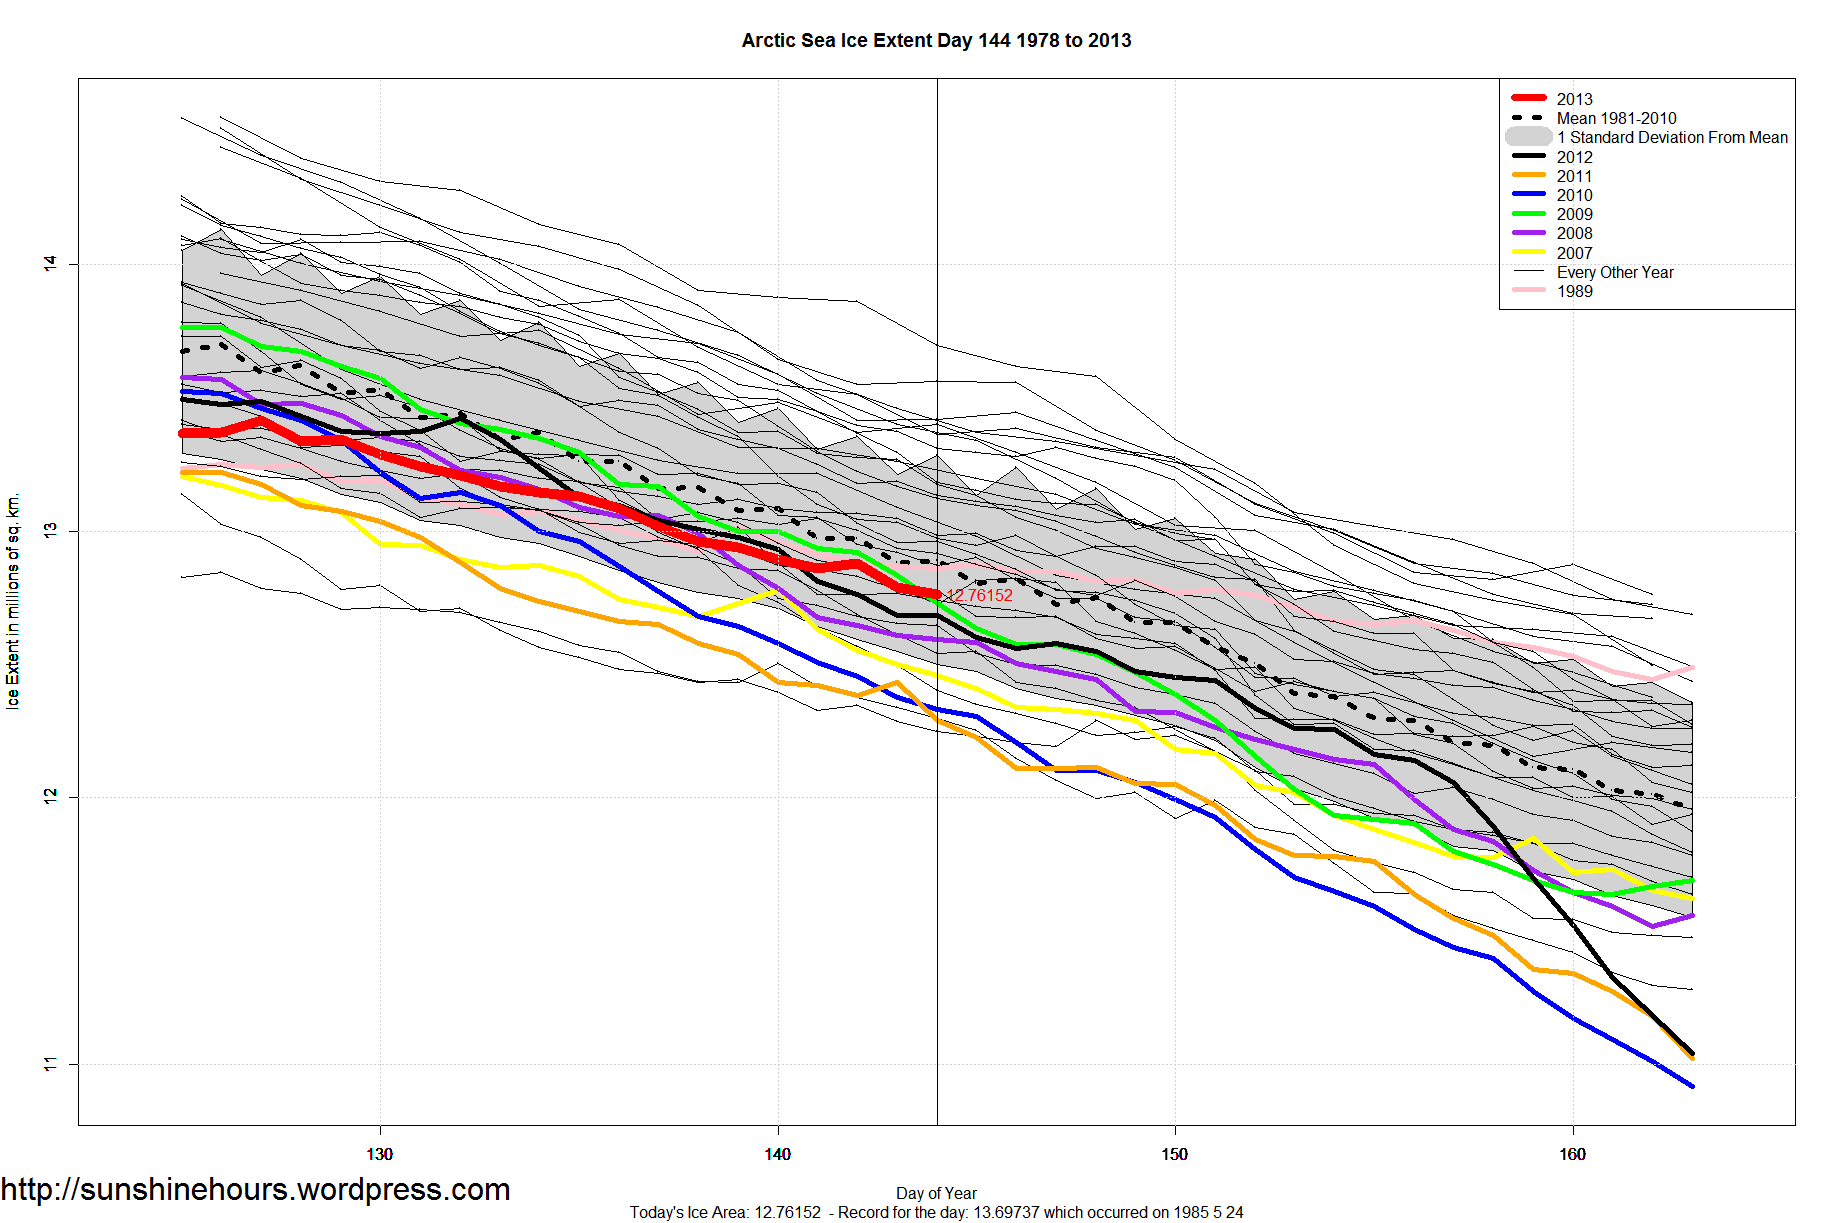
If someone claims Arctic Sea Ice is in a death spiral, you can mention that right now (Day 144 – May 24th) 2013 has the 14th smallest amount of sea ice and not the lowest.
13 Years With Less Arctic Sea Ice on Day 144: 2004, 2011, 2006, 2010, 1995, 2007, 2005, 2008, 2002, 2012, 2000, 2009, 1997
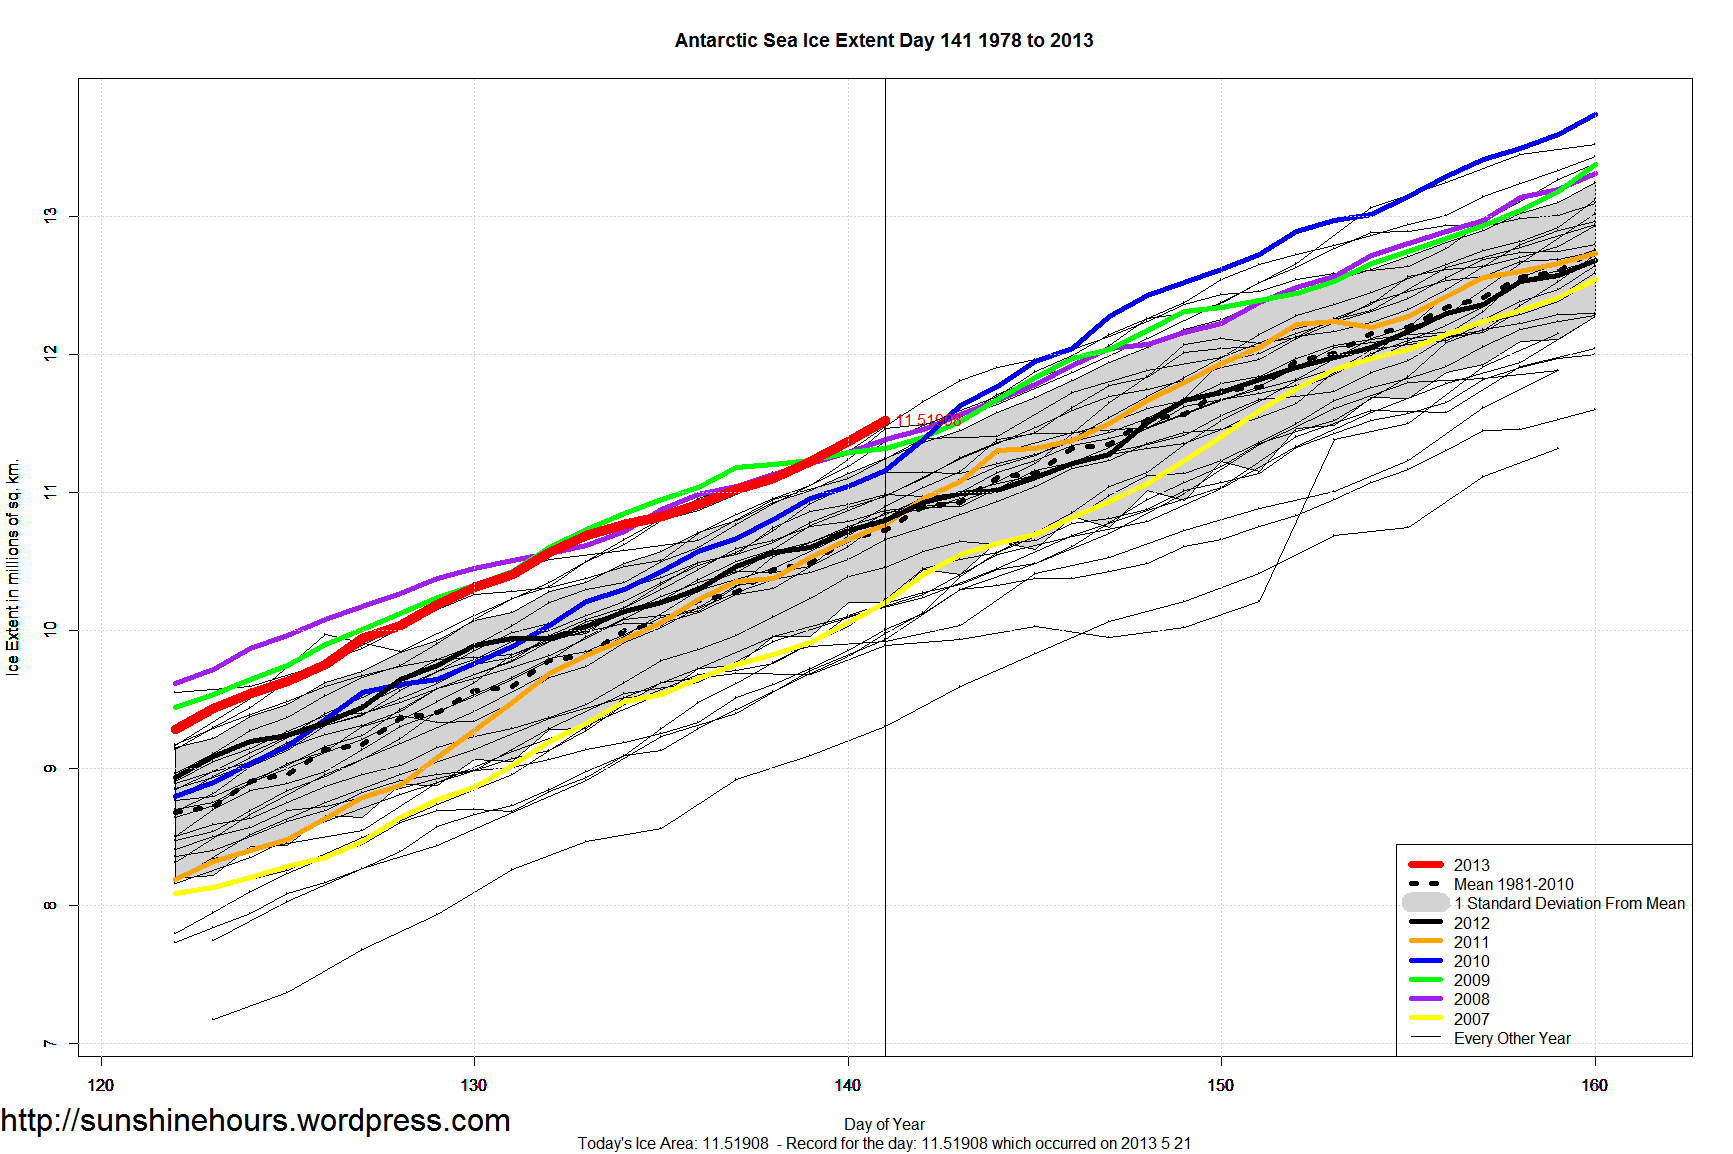
Antarctic Sea Ice Extent set a 2nd daily record in a row on May 22 (day 141 of 2013).
That is the 10th daily record for the year.
| Year | No of Records |
| 2010 | 129 |
| 2008 | 126 |
| 2006 | 29 |
| 2012 | 24 |
| 2007 | 21 |
| 2013 | 10 |
| 2009 | 8 |
| 2000 | 5 |
| 2004 | 5 |
| 1998 | 4 |
| 2005 | 3 |
| 1979 | 2 |
| 1980 | 1 |
After setting 8 daily Antarctic Sea Ice Extent records earlier in the year, 2013 stayed near the top in 2nd, 3rd and 4th place until day 140 (May 20).
Another daily record was set yesterday breaking the old record set in 2000 by 66,000 sq km. 2013 is now in 6th place for daily records set.
| Year | No of Records |
| 2010 | 129 |
| 2008 | 126 |
| 2006 | 29 |
| 2012 | 24 |
| 2007 | 21 |
| 2013 | 9 |
| 2009 | 8 |
| 2000 | 5 |
| 2004 | 5 |
| 1998 | 4 |
| 2005 | 3 |
| 1979 | 2 |
| 1980 | 1 |

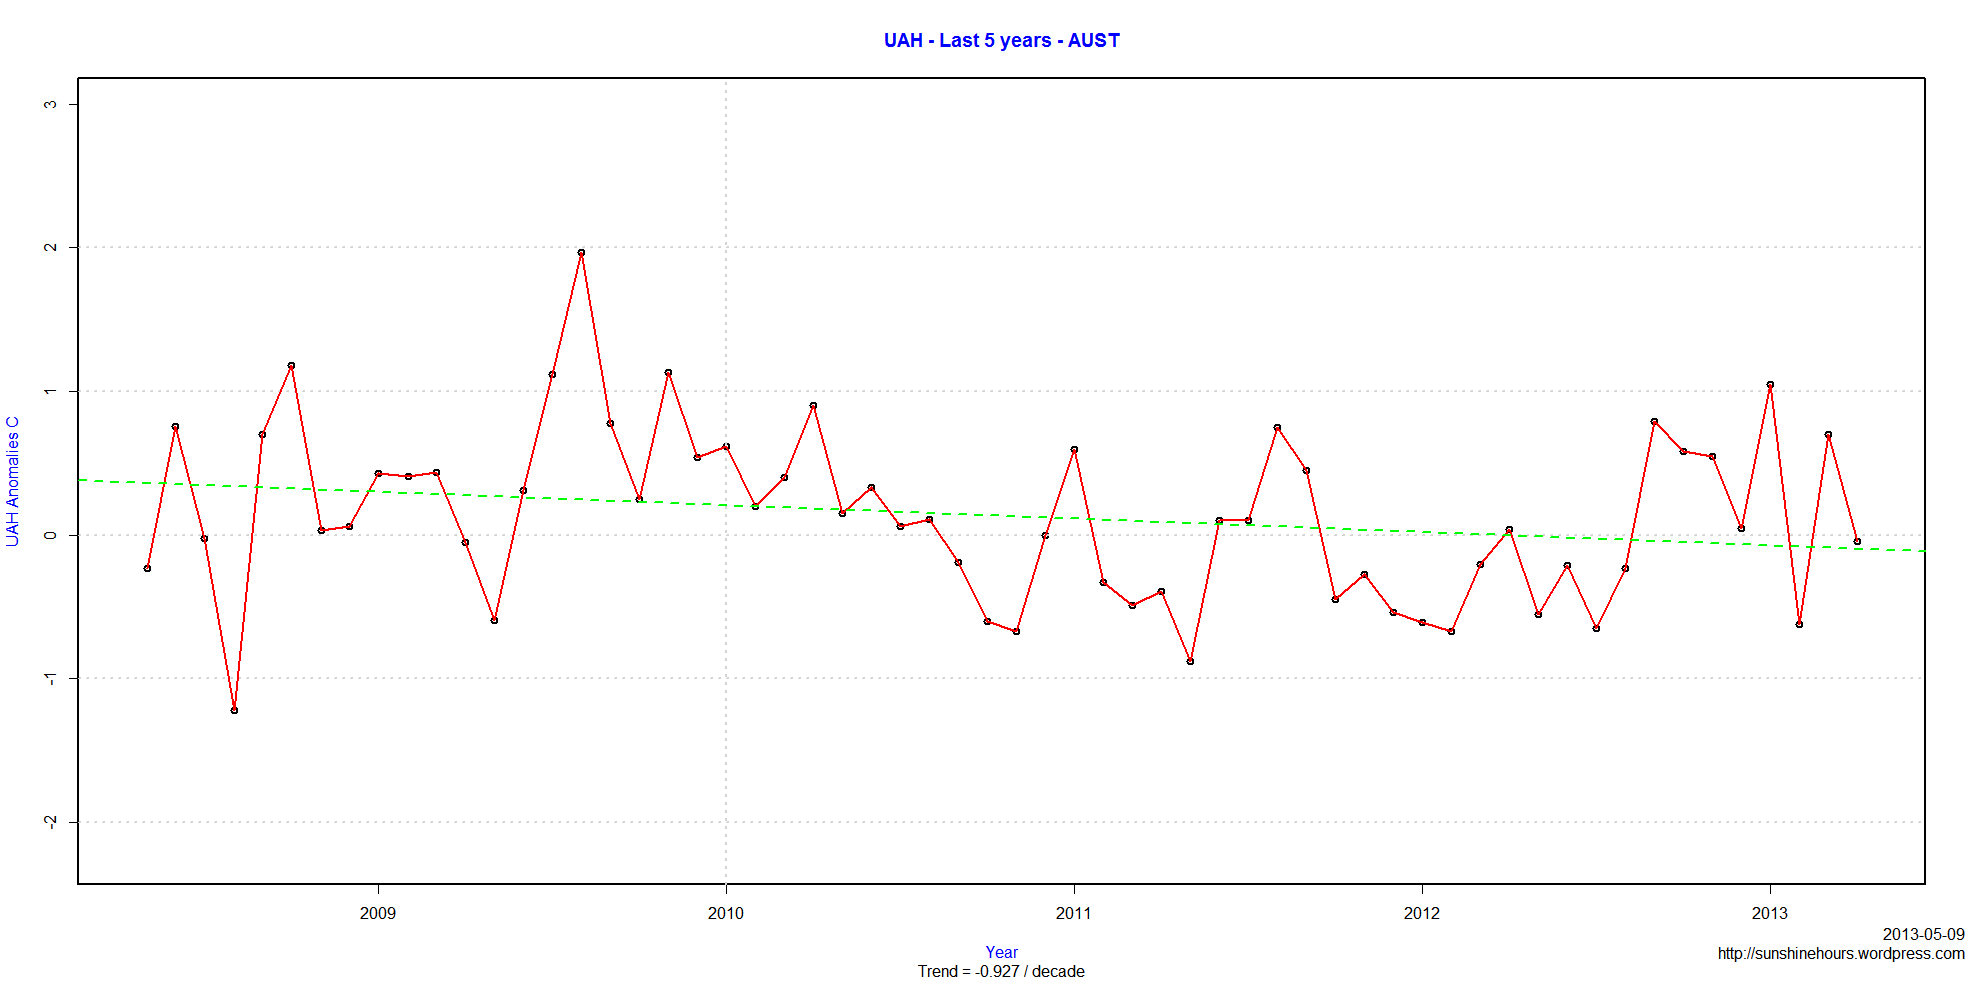
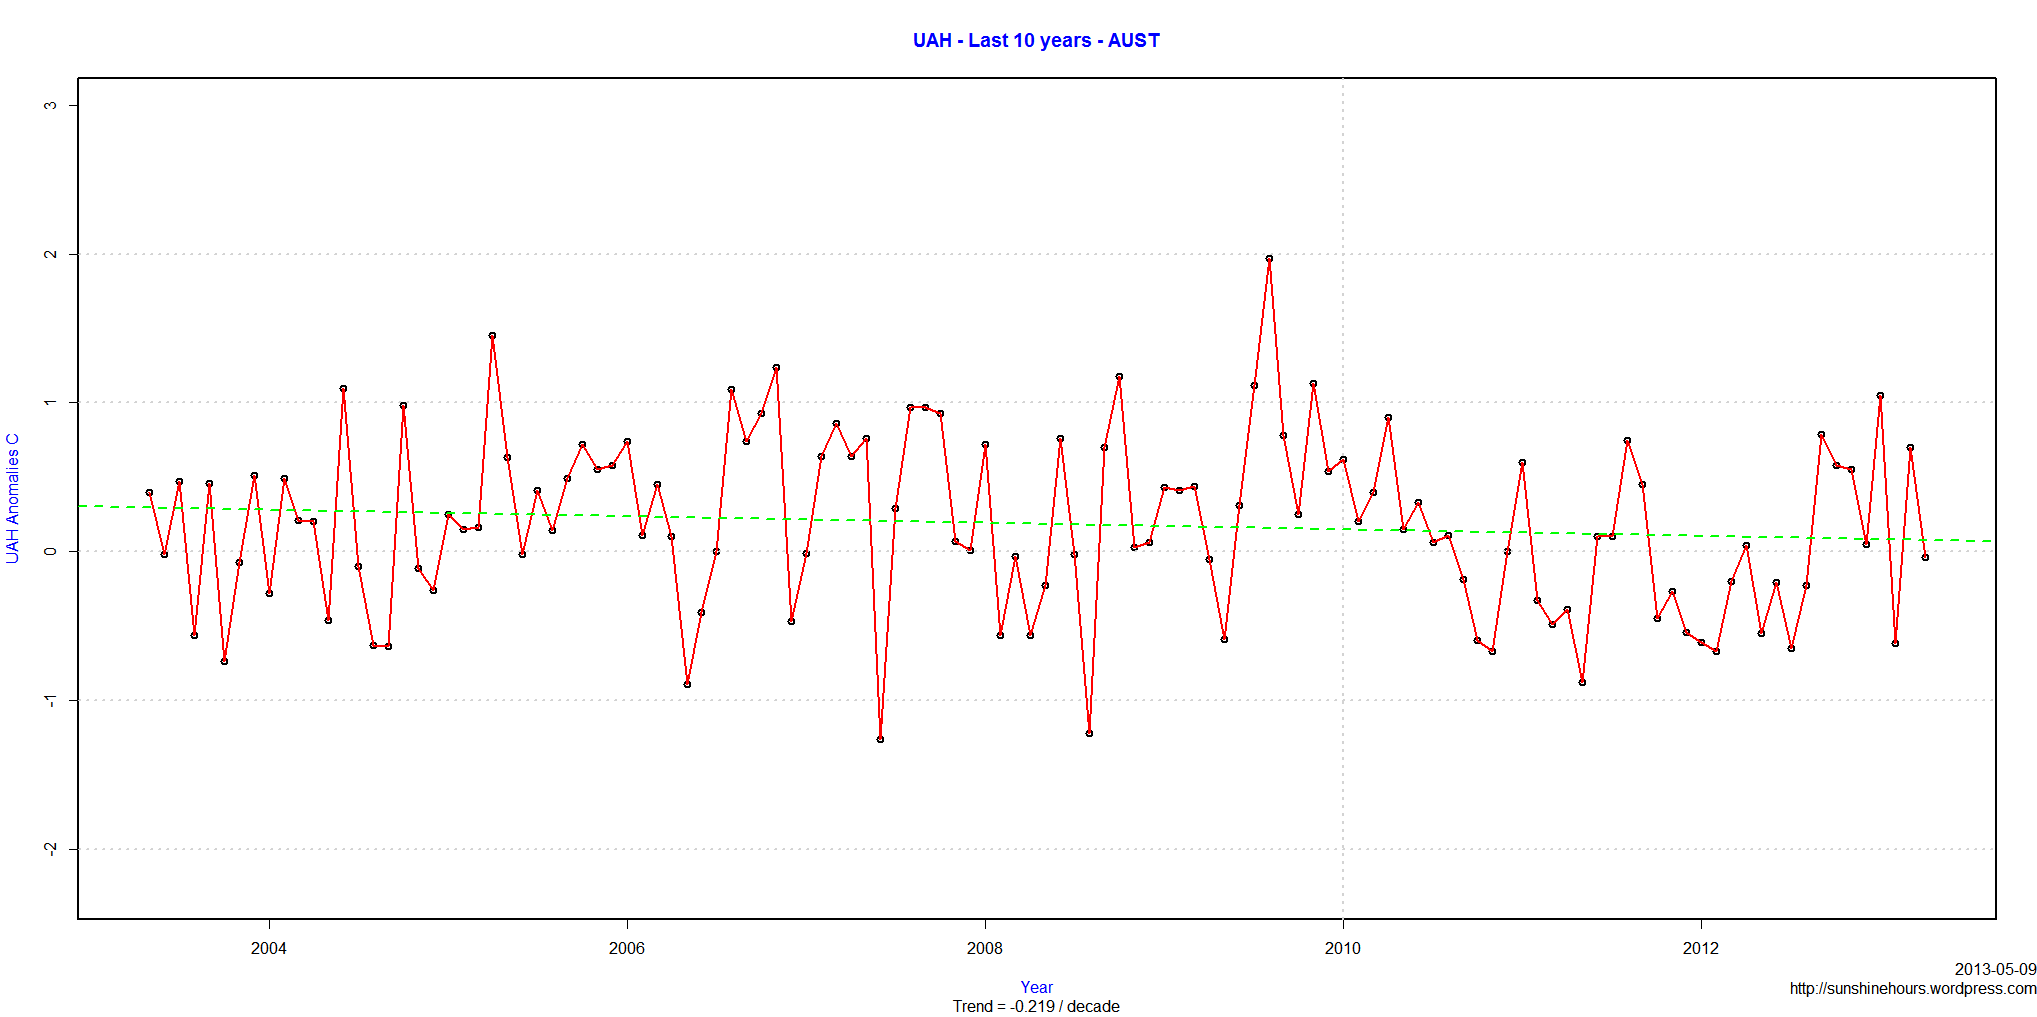
UAH is a satellite temperature dataset, developed at the University of Alabama in Huntsville.
Last month UAH added AUST to its satellite data temperature set. AUST is Australia.
According to UAH, Australia is cooling at -.927C per decade over the last 5 years and cooling at -.291C per decade over the last 10 years.
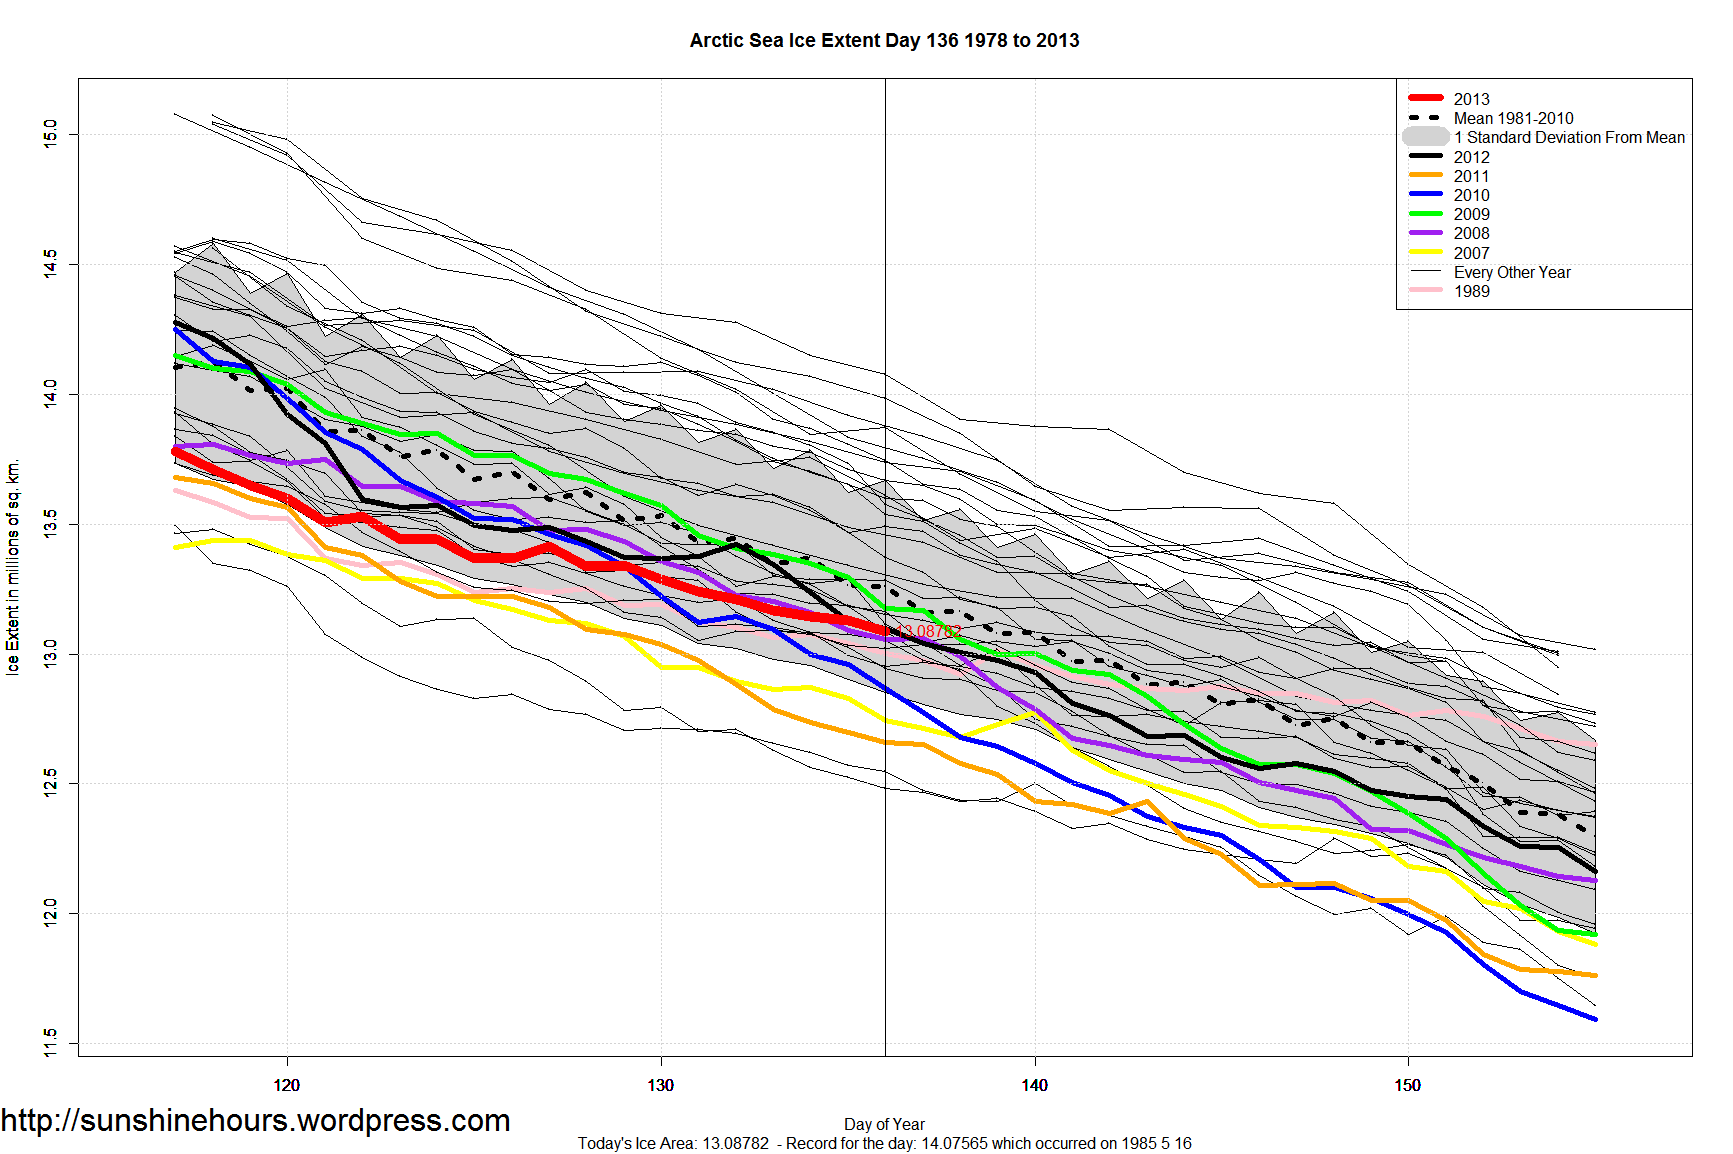
Arctic Sea Ice Extent is 13.09 million sq km on day 136.
Which makes it 170,000 sq km below the average (13.26 million sq km) for the day.
Which means it is a minuscule 1.3% below average.
12 other years on this day had less ice: 2004, 2006, 2011, 2007, 2010, 2005, 2003, 1989, 1996, 2002, 2008, 1995
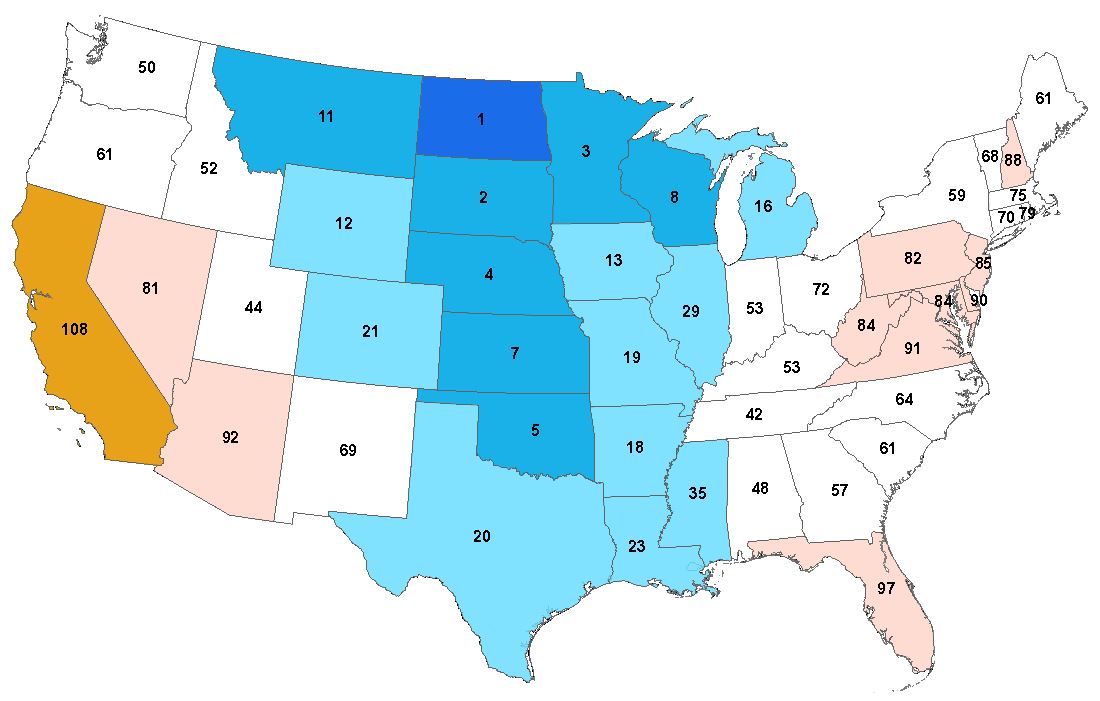
After looking at the national ranking (23rd coldest) it is time to look at the State data:
In the last 119 Aprils, it was the coldest April ever in North Dakota. 2nd coldest ever in South Dakota. 3rd coldest ever in Minnesota, 4th coldest ever in Nebraska, 7th coldest ever in Oklahoma, 8th coldest ever in Wisconsin.
North Dakota was 18.5F colder than the warmest April (which occurred in 1915).
26 out of 48 states had an April ranked below 60. Which means they were ranked in the bottom half of the 119 Aprils measured by the NOAA.
Only one state (California) had an April in the top 20.
| State | Apr 2013 Avg F | Apr Rank (1=Coldest) | Coldest Apr | Coldest Apr F |
| North Dakota | 31 | 1 | 2013 | 31 |
| South Dakota | 36.7 | 2 | 1920 | 35.6 |
| Minnesota | 33.9 | 3 | 1950 | 32.5 |
| Nebraska | 42.3 | 4 | 1920 | 38.9 |
| Oklahoma | 54.6 | 5 | 1983 | 53.2 |
| Kansas | 48.3 | 7 | 1983 | 46.9 |
| Wisconsin | 37.6 | 8 | 1950 | 35.2 |
| Montana | 37.7 | 11 | 1975 | 33.7 |
| Wyoming | 35.8 | 12 | 1920 | 32.2 |
| Iowa | 43.7 | 13 | 1907 | 40.1 |
| Michigan | 39.1 | 16 | 1907 | 35 |
| Arkansas | 58.4 | 18 | 1907 | 54.1 |
| Missouri | 51.8 | 19 | 1907 | 47.6 |
| Texas | 63.1 | 20 | 1997 | 59.7 |
| Colorado | 40.4 | 21 | 1920 | 34.3 |
| Louisiana | 64.5 | 23 | 1983 | 61.4 |
| Illinois | 49.8 | 29 | 1907 | 43.2 |
| Mississippi | 62.2 | 35 | 1983 | 58.4 |
| Tennessee | 56.9 | 42 | 1907 | 50.6 |
| Utah | 45.6 | 44 | 1975 | 39.9 |
| Alabama | 62.1 | 48 | 1901 | 57.4 |
| Washington | 46.7 | 50 | 1955 | 41.5 |
| Idaho | 42.5 | 52 | 1975 | 36.5 |
| Indiana | 50.7 | 53 | 1907 | 42.2 |
| Kentucky | 54.9 | 53 | 1907 | 46.9 |
| Georgia | 63.1 | 57 | 1901 | 57.4 |
| New York | 43.5 | 59 | 1943 | 36.8 |
| Maine | 39.3 | 60 | 1926 | 33.2 |
| South Carolina | 62.1 | 60 | 1901 | 55.1 |
| Oregon | 46.3 | 61 | 1975 | 40.1 |
| Oregon | 46.3 | 61 | 1967 | 40.1 |
| North Carolina | 58.5 | 63 | 1907 | 51 |
| Vermont | 41.9 | 66 | 1926 | 33.3 |
| Connecticut | 47 | 68 | 1943 | 40 |
| New Mexico | 52.3 | 68 | 1973 | 45.8 |
| Ohio | 50.4 | 71 | 1907 | 41.3 |
| Massachusetts | 46.2 | 75 | 1943 | 40.3 |
| Rhode Island | 47.1 | 79 | 1907 | 40.9 |
| Nevada | 48.5 | 80 | 1967 | 38.6 |
| Pennsylvania | 49 | 80 | 1943 | 41.6 |
| Maryland | 53.7 | 82 | 1907 | 45.9 |
| New Jersey | 51.5 | 83 | 1907 | 44.5 |
| West Virginia | 52.9 | 83 | 1907 | 44.4 |
| New Hampshire | 43.3 | 87 | 1926 | 34.6 |
| Arizona | 59.7 | 89 | 1975 | 50.6 |
| Virginia | 56.2 | 89 | 1907 | 47.1 |
| Delaware | 54.5 | 90 | 1907 | 46.4 |
| Florida | 71.4 | 97 | 1987 | 65.1 |
| Florida | 71.4 | 97 | 1901 | 65.1 |
| California | 59.9 | 108 | 1967 | 46.5 |
After looking at the national ranking (23rd coldest) it is time to look at the State data:
In the last 119 Aprils, it was the coldest April ever in North Dakota. 2nd coldest ever in South Dakota. 3rd coldest ever in Minnesota, 4th coldest ever in Nebraska, 7th coldest ever in Oklahoma, 8th coldest ever in Wisconsin.
North Dakota was 18.5F colder than the warmest April (which occurred in 1915).
26 out of 48 states had an April ranked below 60. Which means they were ranked in the bottom half of the 119 Aprils measured by the NOAA.
Only one state (California) had an April in the top 20.
My rankings are below. You may ask yourself why the table rank doesn’t match the above map from the NOAA?
The answer is ties. NOAA (and I) are counting from 119 to 1 for data table. This is Nebraska (where the two months tied at 4th coldest are ranked 5th):
![]()
I try and keep my table in synch with NOAA’s table. But I will rethink that.
| State | Apr 2013 Average F. | Apr Rank (Coldest = 1) | Warmest April | Warmest April Temp | Difference |
| North Dakota | 31 | 1 | 1915 | 49.5 | 18.5 |
| South Dakota | 36.7 | 2 | 1915 | 52 | 15.3 |
| Minnesota | 33.9 | 3 | 1987 | 50.2 | 16.3 |
| Nebraska | 42.3 | 5 | 1946 | 55 | 12.7 |
| Oklahoma | 54.6 | 6 | 1981 | 65.4 | 10.8 |
| Kansas | 48.3 | 7 | 1948 | 59.8 | 11.5 |
| Wisconsin | 37.6 | 8 | 2010 | 49.8 | 12.2 |
| Montana | 37.7 | 11 | 1910 | 49.1 | 11.4 |
| Wyoming | 35.8 | 12 | 1930 | 46.5 | 10.7 |
| Iowa | 43.7 | 14 | 1955 | 55.2 | 11.5 |
| Michigan | 39.1 | 16 | 1955 | 49.1 | 10 |
| Missouri | 51.8 | 20 | 1954 | 61.2 | 9.4 |
| Arkansas | 58.4 | 21 | 1925 | 66.6 | 8.2 |
| Colorado | 40.4 | 21 | 1981 | 49.3 | 8.9 |
| Texas | 63.1 | 22 | 1967 | 70.8 | 7.7 |
| Louisiana | 64.5 | 24 | 1981 | 71.3 | 6.8 |
| Illinois | 49.8 | 34 | 1955 | 58.2 | 8.4 |
| Mississippi | 62.2 | 36 | 1981 | 68.9 | 6.7 |
| Utah | 45.6 | 44 | 1989 | 52.4 | 6.8 |
| Tennessee | 56.9 | 45 | 1954 | 63.3 | 6.4 |
| Washington | 46.7 | 50 | 1926 | 52.8 | 6.1 |
| Alabama | 62.1 | 51 | 1896 | 67.9 | 5.8 |
| Idaho | 42.5 | 53 | 1987 | 49.5 | 7 |
| Indiana | 50.7 | 53 | 2010 | 57.3 | 6.6 |
| Kentucky | 54.9 | 54 | 1954 | 61.1 | 6.2 |
| Georgia | 63.1 | 57 | 1908 | 67.8 | 4.7 |
| Maine | 39.3 | 61 | 1910 | 44.5 | 5.2 |
| New York | 43.5 | 61 | 2010 | 49.6 | 6.1 |
| Oregon | 46.3 | 61 | 1926 | 52.7 | 6.4 |
| South Carolina | 62.1 | 61 | 1896 | 66.5 | 4.4 |
| North Carolina | 58.5 | 64 | 1954 | 62.5 | 4 |
| Vermont | 41.9 | 67 | 1921 | 47.2 | 5.3 |
| New Mexico | 52.3 | 69 | 1946 | 57.1 | 4.8 |
| Connecticut | 47 | 70 | 1921 | 51.9 | 4.9 |
| Ohio | 50.4 | 72 | 1955 | 55.5 | 5.1 |
| Massachusetts | 46.2 | 75 | 2010 | 50.4 | 4.2 |
| Rhode Island | 47.1 | 79 | 1976 | 51.1 | 4 |
| Nevada | 48.5 | 81 | 1992 | 53.4 | 4.9 |
| Pennsylvania | 49 | 81 | 1941 | 53.3 | 4.3 |
| Maryland | 53.7 | 84 | 2010 | 57.3 | 3.6 |
| New Jersey | 51.5 | 84 | 1921 | 55.6 | 4.1 |
| West Virginia | 52.9 | 84 | 1896 | 56.5 | 3.6 |
| New Hampshire | 43.3 | 88 | 1945 | 46.8 | 3.5 |
| Delaware | 54.5 | 90 | 1994 | 57.9 | 3.4 |
| Virginia | 56.2 | 91 | 1994 | 58.6 | 2.4 |
| Arizona | 59.7 | 92 | 2002 | 63 | 3.3 |
| Florida | 71.4 | 97 | 1947 | 74 | 2.6 |
| California | 59.9 | 108 | 1989 | 62.1 | 2.2 |
According to the NOAA, April 2013 was the 23rd coldest April since 1895.
The following Aprils were warmer: 1895, 1896, 1897, 1898, 1899, 1900, 1902, 1903, 1905, 1906, 1908, 1910, 1911, 1912, 1913, 1914, 1915, 1916, 1919, 1921, 1922, 1923, 1924, 1925, 1926, 1927, 1929, 1930, 1931, 1932, 1933, 1934, 1936, 1937, 1938, 1939, 1940, 1941, 1942, 1943, 1945, 1946, 1947, 1948, 1949, 1951, 1952, 1954, 1955, 1957, 1958, 1959, 1960, 1962, 1963, 1964, 1965, 1966, 1967, 1968, 1969, 1971, 1972, 1974, 1976, 1977, 1978, 1979, 1980, 1981, 1985, 1986, 1987, 1988, 1989, 1990, 1991, 1992, 1993, 1994, 1996, 1998, 1999, 2000, 2001, 2002, 2003, 2004, 2005, 2006, 2007, 2008, 2009, 2010, 2011, 2012
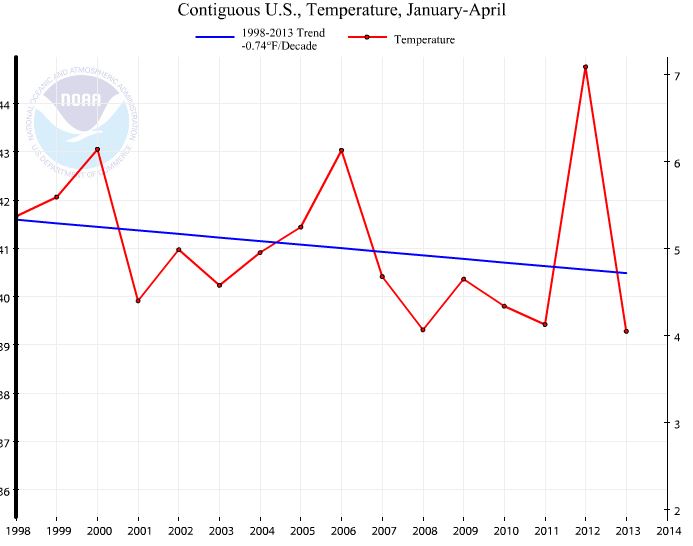
April’s have been cooling at -.21F per Decade since 1998

The January-April period has been cooling at -.74F/decade since 1998