Antarctic Sea Ice Extent is 870,000 sq km above the 1981-2010 average. And only 43,000 sq km below the record for this day of the year.
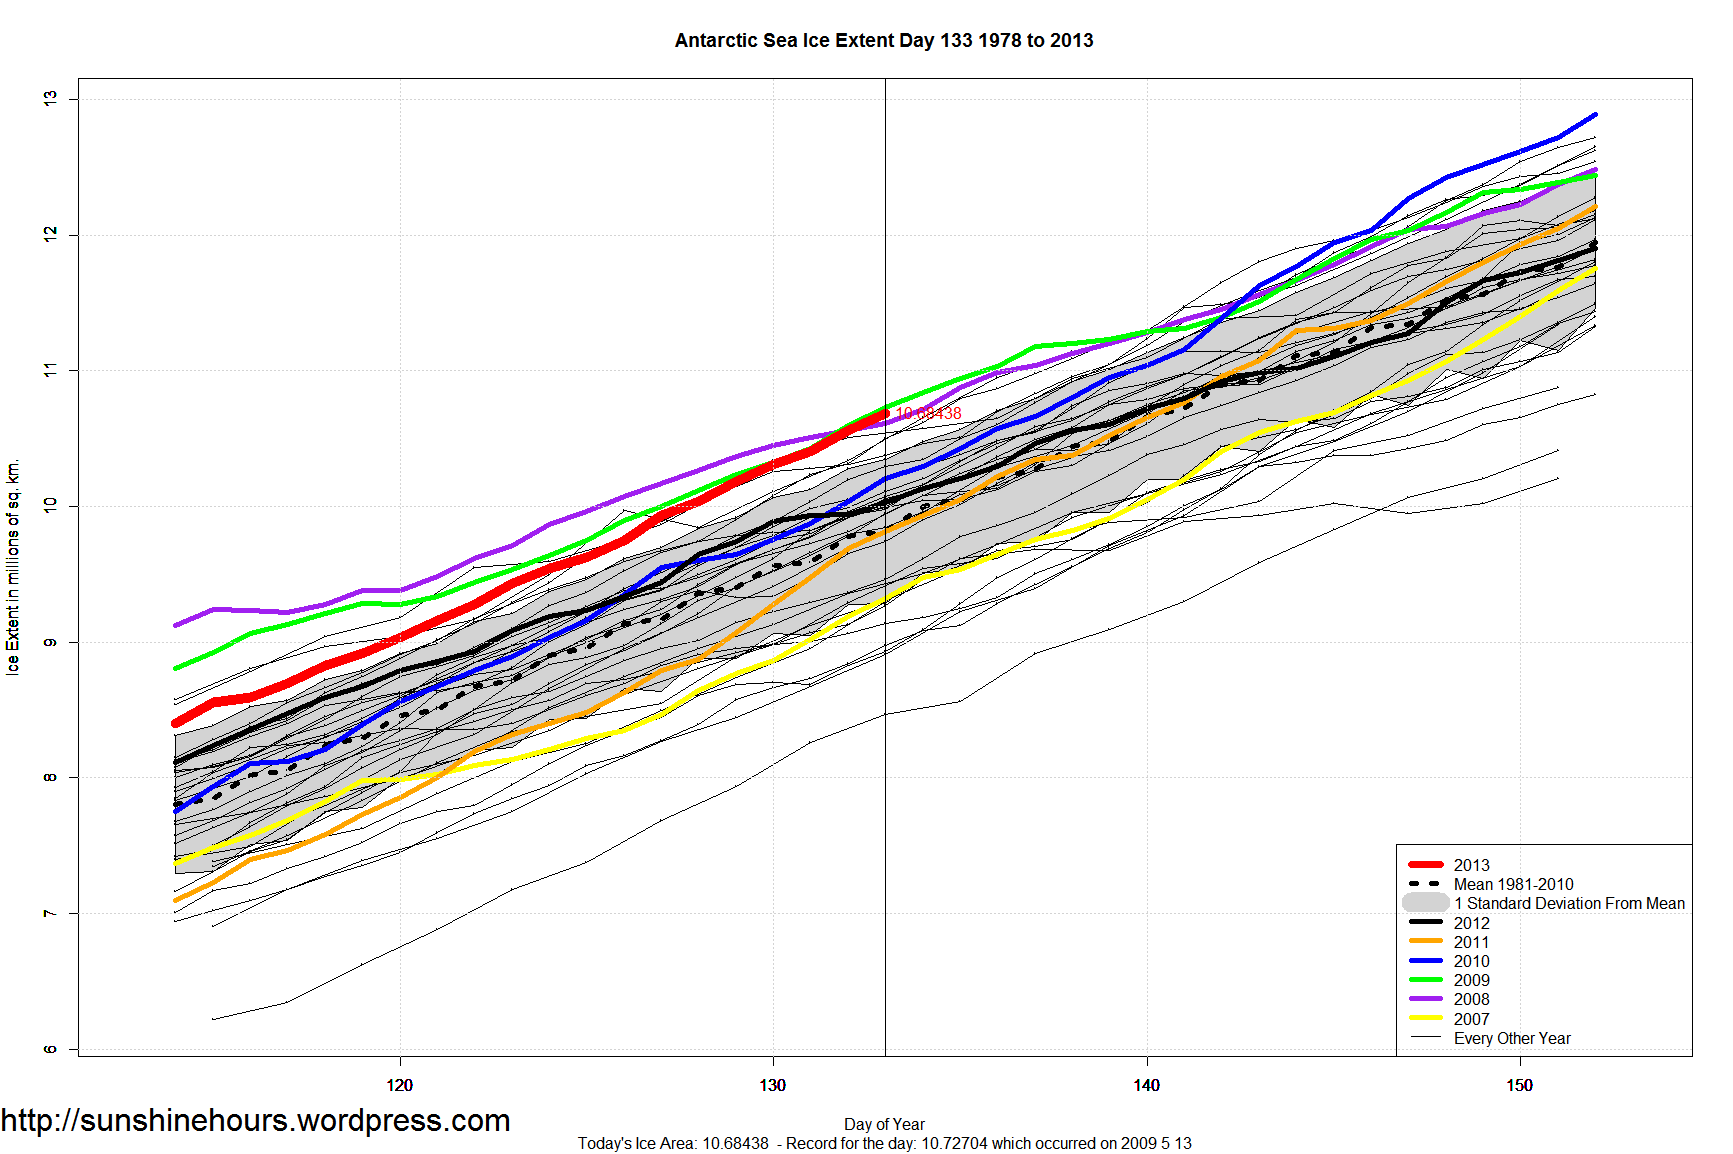
Antarctic Sea Ice Extent is 870,000 sq km above the 1981-2010 average. And only 43,000 sq km below the record for this day of the year.
“It happens about once a month here, on the barren foothills of one of America’s green-energy boomtowns: A soaring golden eagle slams into a wind farm’s spinning turbine and falls, mangled and lifeless, to the ground.
Killing these iconic birds is not just an irreplaceable loss for a vulnerable species. It’s also a federal crime, a charge that the Obama administration has used to prosecute oil companies when birds drown in their waste pits, and power companies when birds are electrocuted by their power lines.
But the administration has never fined or prosecuted a wind-energy company, even those that flout the law repeatedly. Instead, the government is shielding the industry from liability and helping keep the scope of the deaths secret.“
http://abcnews.go.com/Technology/wireStory/ap-impact-wind-farms-pass-eagle-deaths-19173724
While CO2 has increased by 85 ppm from when measurements began in 1958 and are estimated to have risen by 120 ppm since 1750, we should also realize that increases of 80 ppm to 100 pm occurred during the last 3 glaciations without humans burning fossil fuels.
” Air trapped in bubbles in polar ice cores constitutes an archive for the reconstruction of the global carbon cycle and the relation between greenhouse gases and climate in the past. High-resolution records from Antarctic ice cores show that carbon dioxide concentrations increased by 80 to 100 parts per million by volume 600 ± 400 years after the warming of the last three deglaciations. Despite strongly decreasing temperatures, high carbon dioxide concentrations can be sustained for thousands of years during glaciations; the size of this phase lag is probably connected to the duration of the preceding warm period, which controls the change in land ice coverage and the buildup of the terrestrial biosphere.”
http://www.sciencemag.org/content/283/5408/1712.abstract
The USCRN is a new ‘state of the art’ United States Climate Reference Network.
There are 222 stations of which 220 have data for April 2013. Of those 222, only 137 have 5 or more years of data. I’ll be using the 137 list.
41 of those 137 had April 2013 as the coldest April.
9 of those 137 had April 2013 as the warmest April.
Stations with April as Coldest
| State | Stn | Years of Data | April 2013 AVG in C | Coldest April | Coldest April AVG in C | Coldest 5 Aprils |
| AK | Fairbanks_11_NE | 11 | -7.1 | 2013 | -7.1 | 2013,2006,2008,2011,2009 |
| AK | Sitka_1_NE | 8 | 3.1 | 2013 | 3.1 | 2013,2008,2006,2009,2007 |
| AK | St._Paul_4_NE | 8 | -4.2 | 2013 | -4.2 | 2013,2012,2010,2006,2009 |
| AL | Brewton_3_NNE | 6 | 17.7 | 2013 | 17.7 | 2013,2009,2008,2010,2012 |
| AL | Russellville_4_SSE | 7 | 14.8 | 2013 | 14.8 | 2013,2008,2009,2012,2010 |
| AL | Thomasville_2_S | 6 | 17.1 | 2013 | 17.1 | 2013,2009,2008,2010,2012 |
| CO | Boulder_14_W | 10 | -3.2 | 2013 | -3.2 | 2013,2008,2011,2010,2009 |
| CO | La_Junta_17_WSW | 9 | 8 | 2013 | 8 | 2013,2007,2005,2008,2009 |
| CO | Nunn_7_NNE | 10 | 3.5 | 2013 | 3.5 | 2013,2009,2008,2011,2007 |
| IL | Shabbona_5_NNE | 10 | 7.4 | 2013 | 7.4 | 2013,2007,2009,2011,2008 |
| KS | Manhattan_6_SSW | 10 | 10.1 | 2013 | 10.1 | 2013,2008,2007,2009,2004 |
| KS | Oakley_19_SSW | 8 | 7.8 | 2013 | 7.8 | 2013,2007,2008,2009,2011 |
| MI | Chatham_1_SE | 9 | 1.2 | 2013 | 1.2 | 2013,2007,2011,2009,2008 |
| MI | Gaylord_9_SSW | 6 | 2.5 | 2013 | 2.5 | 2013,2011,2009,2012,2008 |
| MN | Goodridge_12_NNW | 10 | -0.2 | 2013 | -0.2 | 2013,2008,2004,2007,2009 |
| MN | Sandstone_6_W | 6 | 2.2 | 2013 | 2.2 | 2013,2008,2011,2009,2012 |
| MO | Chillicothe_22_ENE | 8 | 9.9 | 2013 | 9.9 | 2013,2008,2007,2009,2011 |
| MO | Joplin_24_N | 6 | 11.7 | 2013 | 11.7 | 2013,2008,2009,2011,2010 |
| MS | Holly_Springs_4_N | 6 | 14.6 | 2013 | 14.6 | 2013,2008,2009,2012,2010 |
| MT | Wolf_Point_29_ENE | 12 | 1.5 | 2013 | 1.5 | 2013,2002,2011,2008,2009 |
| MT | Wolf_Point_34_NE | 12 | 0.7 | 2013 | 0.7 | 2013,2002,2011,2009,2008 |
| ND | Jamestown_38_WSW | 5 | -1.1 | 2013 | -1.1 | 2013,2009,2011,2012,2010 |
| ND | Medora_7_E | 9 | 1.4 | 2013 | 1.4 | 2013,2011,2009,2007,2008 |
| ND | Northgate_5_ESE | 7 | -3.8 | 2013 | -3.8 | 2013,2011,2009,2008,2007 |
| NE | Harrison_20_SSE | 10 | 3.2 | 2013 | 3.2 | 2013,2009,2008,2011,2007 |
| NE | Lincoln_8_ENE | 12 | 7.9 | 2013 | 7.9 | 2013,2008,2007,2009,2011 |
| NE | Lincoln_11_SW | 12 | 7.9 | 2013 | 7.9 | 2013,2008,2009,2007,2011 |
| NE | Whitman_5_ENE | 9 | 4 | 2013 | 4 | 2013,2008,2011,2009,2007 |
| OK | Goodwell_2_E | 10 | 9.6 | 2013 | 9.6 | 2013,2007,2005,2009,2008 |
| OK | Stillwater_2_W | 12 | 12.5 | 2013 | 12.5 | 2013,2007,2008,2009,2004 |
| OK | Stillwater_5_WNW | 12 | 12.2 | 2013 | 12.2 | 2013,2007,2008,2009,2004 |
| ON | Egbert_1_W | 9 | 4.8 | 2013 | 4.8 | 2013,2007,2012,2011,2009 |
| SD | Aberdeen_35_WNW | 6 | 0.3 | 2013 | 0.3 | 2013,2008,2011,2009,2012 |
| SD | Buffalo_13_ESE | 9 | 2.4 | 2013 | 2.4 | 2013,2009,2008,2011,2007 |
| SD | Pierre_24_S | 7 | 2.9 | 2013 | 2.9 | 2013,2009,2011,2008,2007 |
| SD | Sioux_Falls_14_NNE | 11 | 3.2 | 2013 | 3.2 | 2013,2008,2011,2009,2007 |
| TX | Austin_33_NW | 6 | 17.2 | 2013 | 17.2 | 2013,2010,2009,2008,2012 |
| TX | Port_Aransas_32_NNE | 6 | 19.7 | 2013 | 19.7 | 2013,2010,2008,2009,2012 |
| WI | Necedah_5_WNW | 9 | 4.8 | 2013 | 4.8 | 2013,2011,2007,2008,2009 |
| WY | Lander_11_SSE | 9 | 3.4 | 2013 | 3.4 | 2013,2009,2008,2011,2010 |
| WY | Sundance_8_NNW | 6 | -0.8 | 2013 | -0.8 | 2013,2011,2008,2009,2010 |
Stations with April as Warmest.
| State | Stn | Years of Data | April 2013 AVG in C | Warmest April | Warmest April AVG in C | Warmest 5 Aprils |
| AZ | Yuma_27_ENE | 6 | 23.4 | 2013 | 23.4 | 2013,2012,2008,2011,2009 |
| CA | Fallbrook_5_NE | 6 | 15.2 | 2013 | 15.2 | 2013,2009,2011,2012,2010 |
| CA | Merced_23_WSW | 10 | 16.7 | 2013 | 16.7 | 2013,2004,2007,2012,2009 |
| CA | Redding_12_WNW | 11 | 15.4 | 2013 | 15.4 | 2013,2004,2007,2009,2012 |
| CA | Stovepipe_Wells_1_SW | 9 | 27.1 | 2013 | 27.1 | 2013,2007,2012,2008,2011 |
| CA | Yosemite_Village_12_W | 6 | 8.1 | 2013 | 8.1 | 2013,2012,2008,2009,2011 |
| HI | Hilo_5_S | 8 | 20.8 | 2013 | 20.8 | 2013,2011,2008,2007,2010 |
| NV | Mercury_3_SSW | 10 | 17.8 | 2013 | 17.8 | 2013,2007,2012,2004,2008 |
| OR | Corvallis_10_SSW | 7 | 10.2 | 2013 | 10.2 | 2013,2012,2007,2009,2010 |
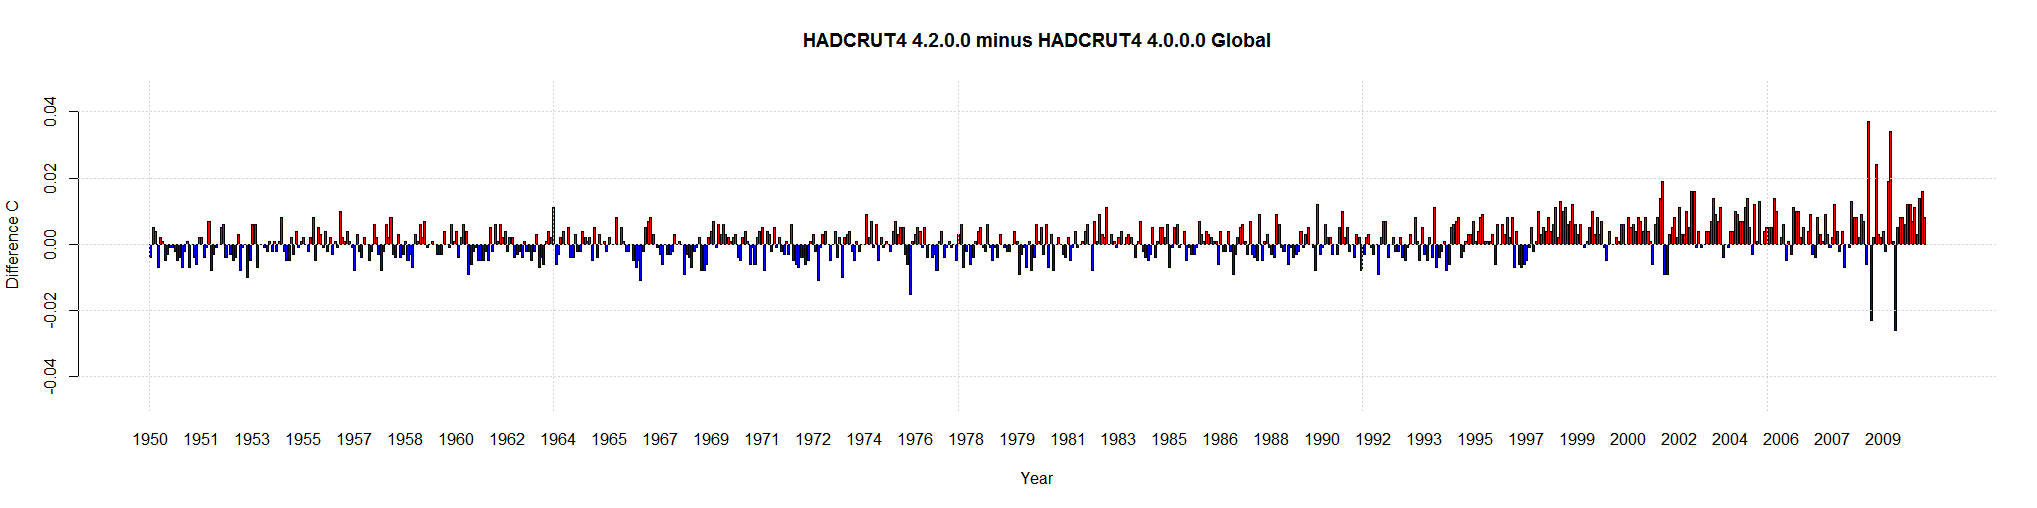
HADCRUT4 is now at its 3rd iteration. It started with version 4.0.0.0 and then version 4.1.1.0 come out. As of the latest data it is at 4.2.0.0.
I thought I would compare them. Here is the difference between them ( 4.2.0.0 monthly anomaly minus 4.0.0.0 monthly anomaly).
If the bar is red, the newest HADCRUT4 is warmer. If blue, then the newest data is cooler.
This is the data from 1950 on. Note that the values are pretty low and relatively evenly divided between blue and red.
Until 1997. Then the values are a little larger (still relatively small). And almost all red.
They are warming the most recent temperatures again! Give them a few years and the pause will disappear.
Click to make bigger.
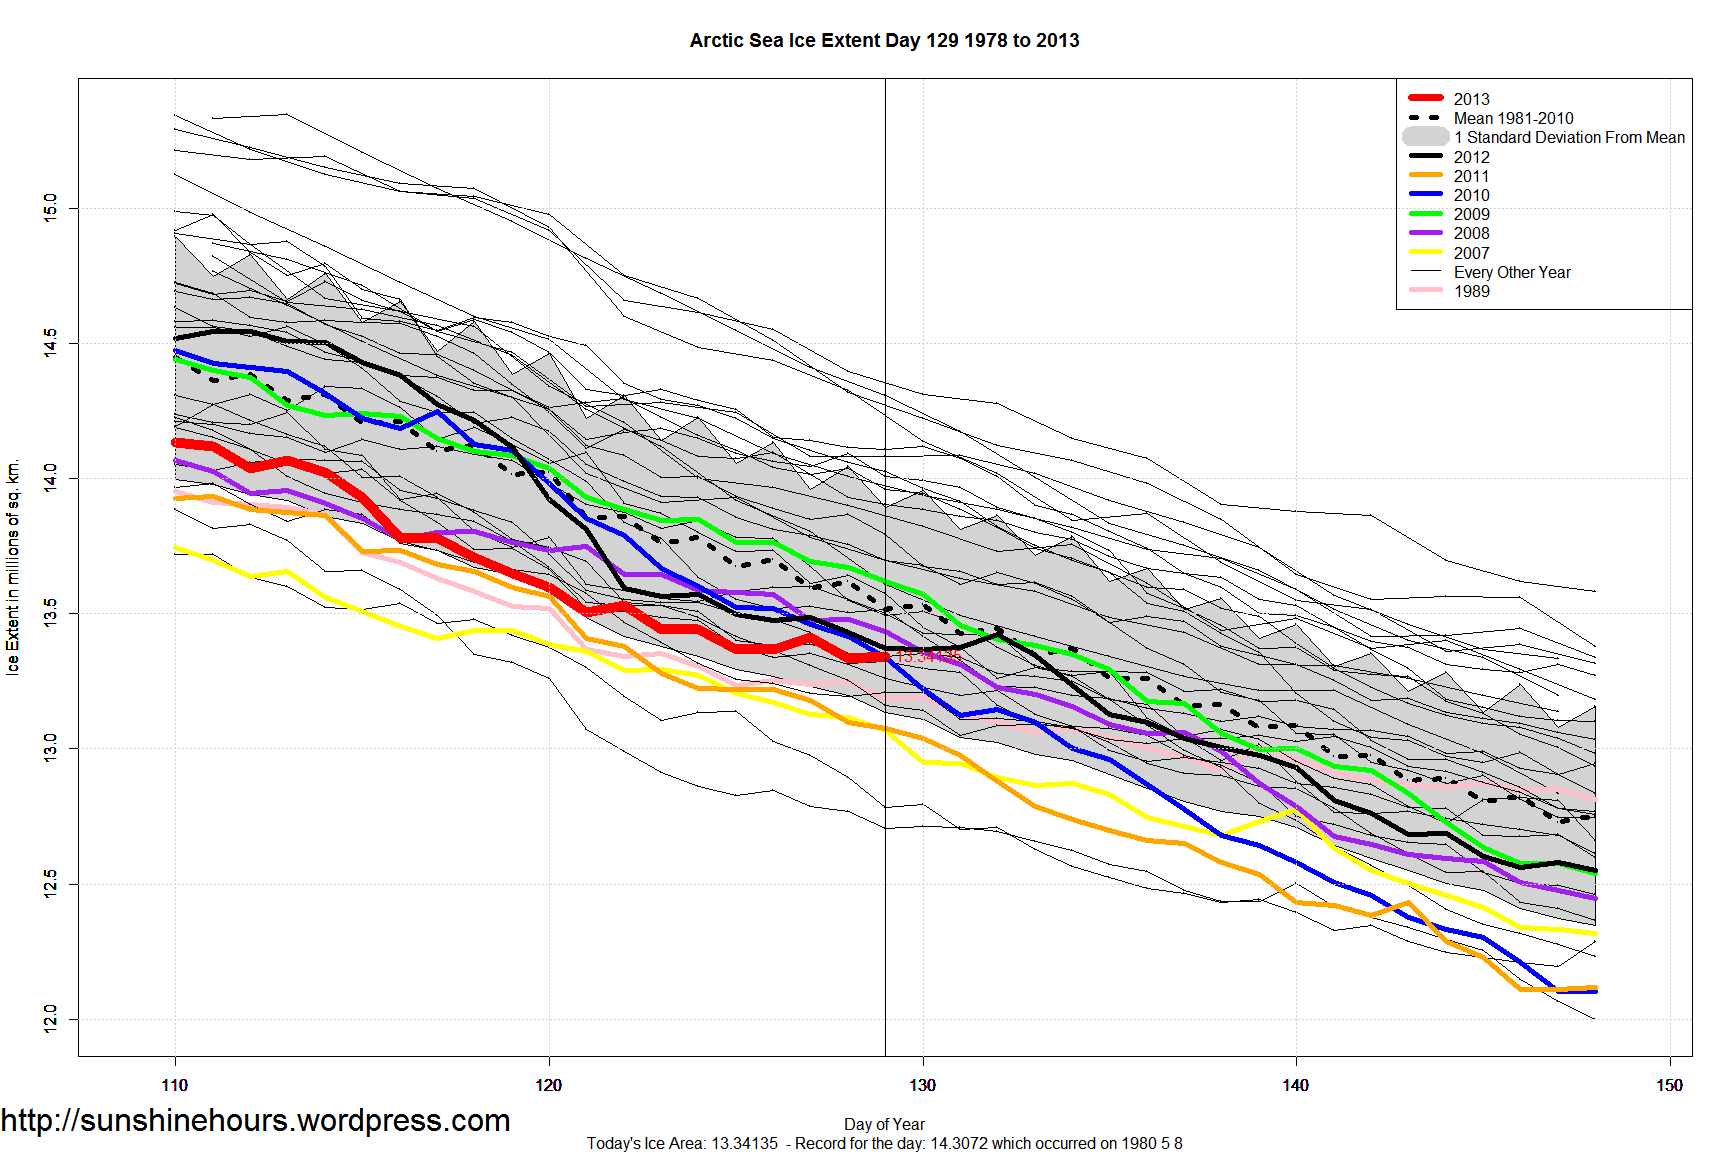
What a strange death spiral for Arctic Sea Ice.
There are 11 years with less ice at this day in the year: 2006, 2004, 2007, 2011, 2003, 1989, 2005, 2002, 1996, 2010 and 1995.
Click for bigger.
UAH for April 2013 is out.
5th coldest April in USA49 history (which is USA 48 + Alaska)
| year | Mo | USA49 |
| 1983 | 4 | -2.68 |
| 1982 | 4 | -1.61 |
| 1984 | 4 | -1.6 |
| 1997 | 4 | -1.5 |
| 2013 | 4 | -0.93 |
| 1998 | 4 | -0.62 |
| 1995 | 4 | -0.61 |
| 1979 | 4 | -0.6 |
| 1993 | 4 | -0.58 |
| 1980 | 4 | -0.56 |
| 1996 | 4 | -0.53 |
| 1985 | 4 | -0.22 |
| 1986 | 4 | -0.16 |
| 2008 | 4 | -0.15 |
| 2009 | 4 | -0.11 |
| 2011 | 4 | -0.1 |
| 1988 | 4 | -0.01 |
| 1999 | 4 | 0.14 |
| 1991 | 4 | 0.21 |
| 2007 | 4 | 0.25 |
| 1992 | 4 | 0.31 |
| 2005 | 4 | 0.44 |
| 2004 | 4 | 0.47 |
| 2003 | 4 | 0.48 |
| 1994 | 4 | 0.5 |
| 2000 | 4 | 0.51 |
| 2001 | 4 | 0.53 |
| 1987 | 4 | 0.57 |
| 2010 | 4 | 0.66 |
| 1989 | 4 | 0.74 |
| 2002 | 4 | 0.82 |
| 1990 | 4 | 0.92 |
| 2006 | 4 | 1.33 |
| 2012 | 4 | 1.48 |
| 1981 | 4 | 1.51 |
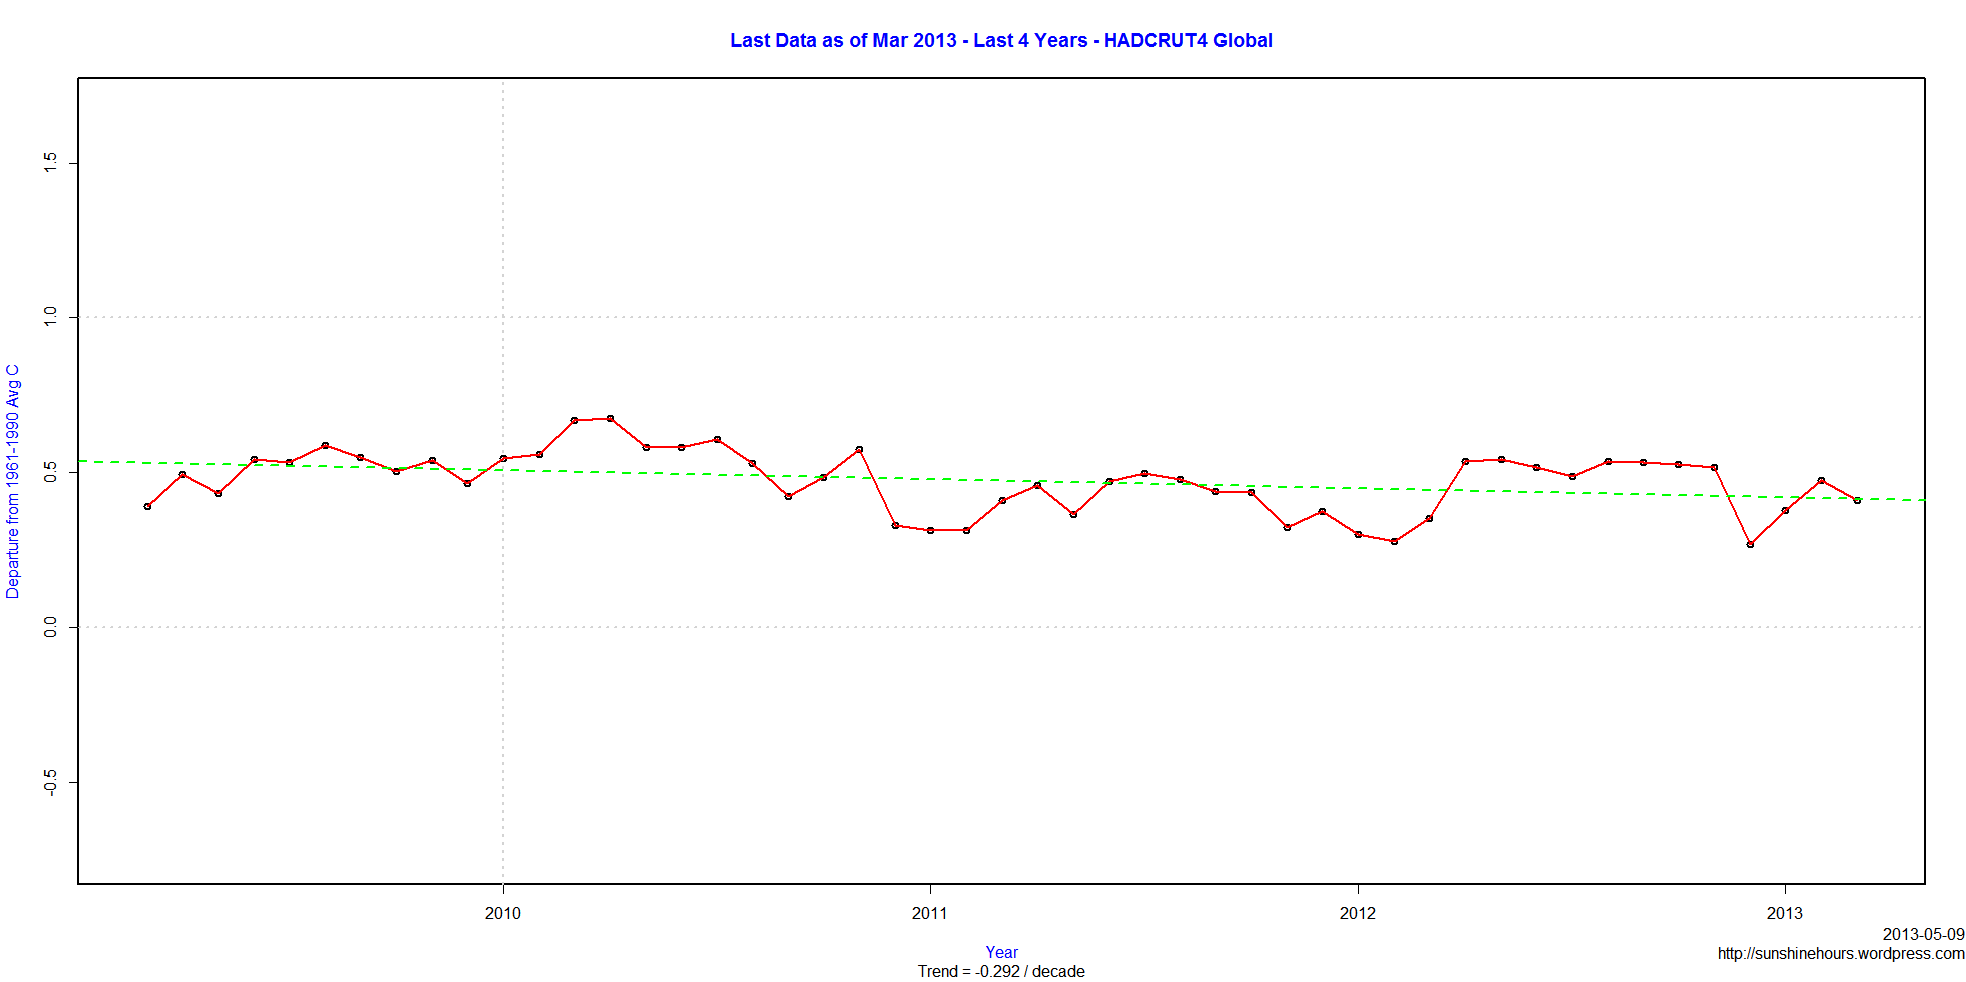
HADCRUT4 March 2013 data is finally available. Remember that the anomaly is the difference from the 1961-1990 average.
The global data shows cooling at -0.292C / Decade for last 4 years. (Click to make bigger)
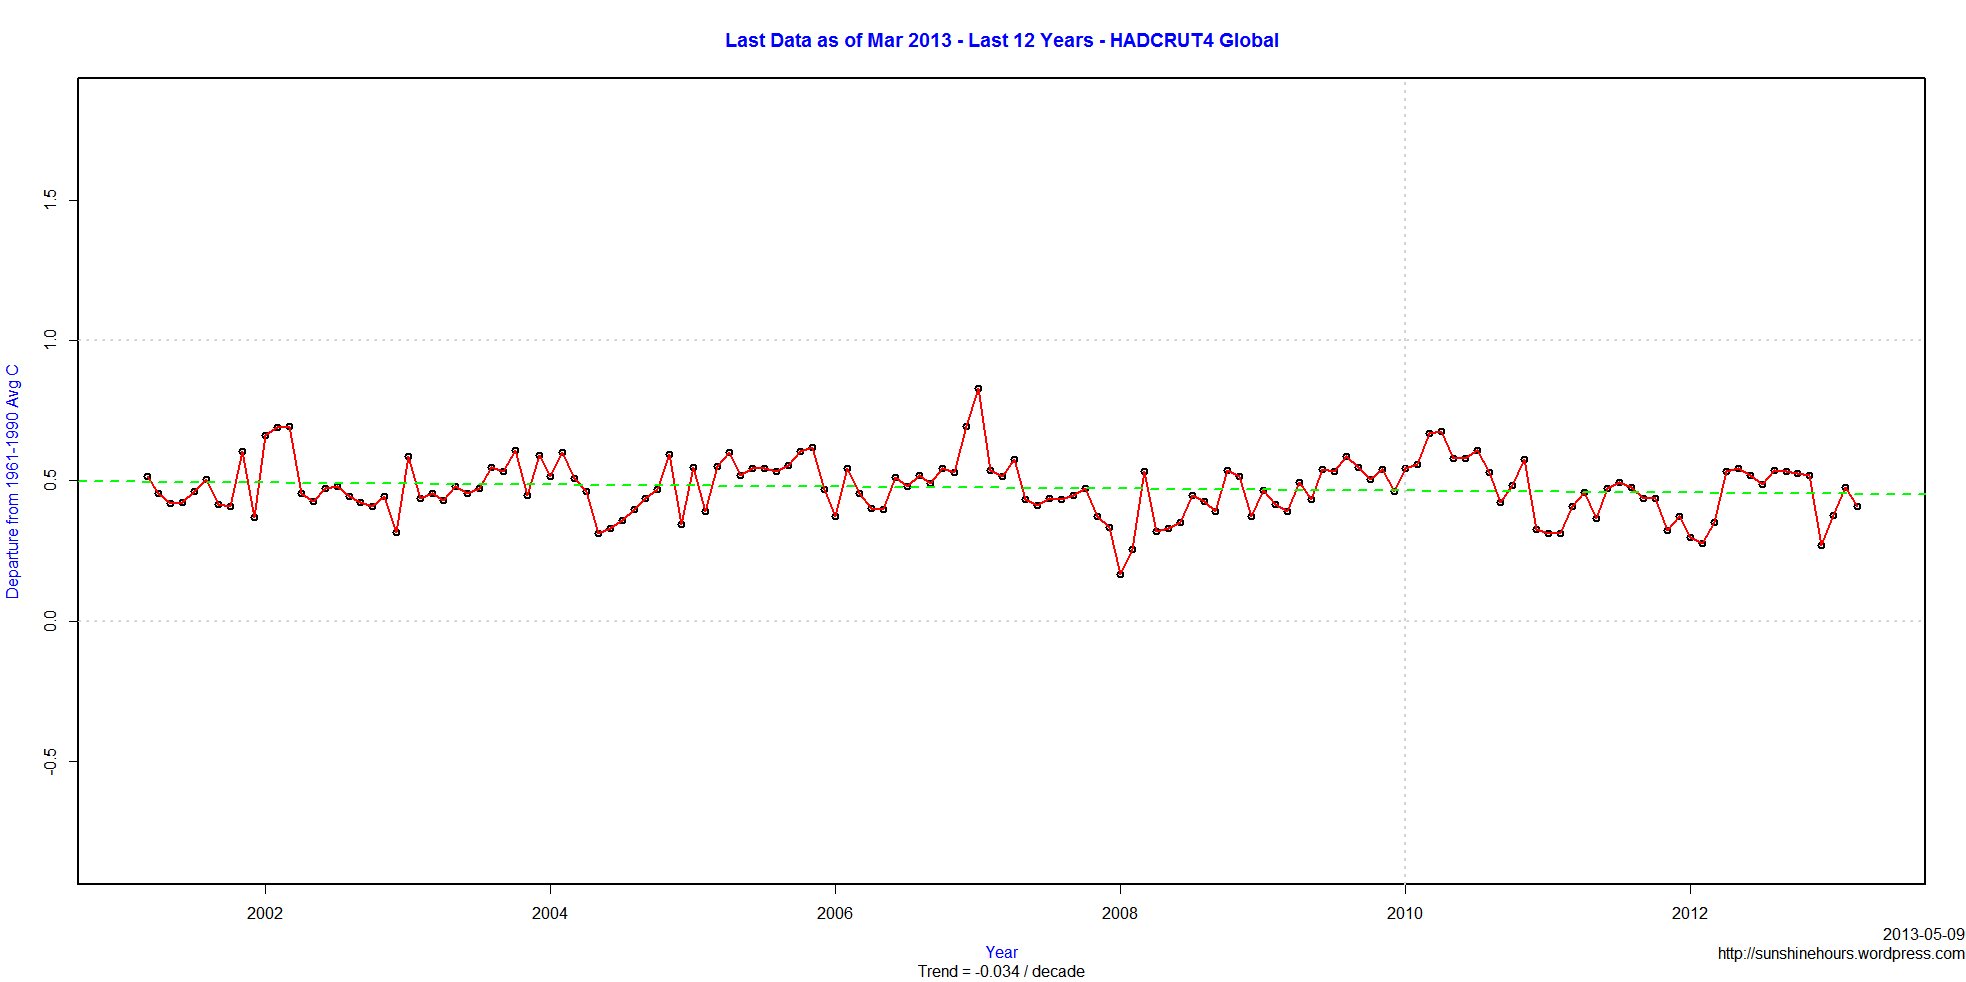
For those who think 4 years is too short, the global data shows cooling at -0.034C / Decade for last 12 years.
2nd UPDATE: UAH is out. My post here.I knew if I complained it would all show up. 🙂
UPDATE: HADCRUT4 for March 2013 is out. My post is here.
Anyone know where the UAH and HADCRUT data is?
While some of the UAH data arrived a few days ago, the downloadable file is still missing April’s data. March’s data arrived April 2.
HADCRUT is usually available by the 28th of the following month. February’s data came out March 28. It is now 10 days late.
Are they having a conference? March and April too cold to explain?
RSS is out. HADCET is out. NCDC is due soon, but not overdue.
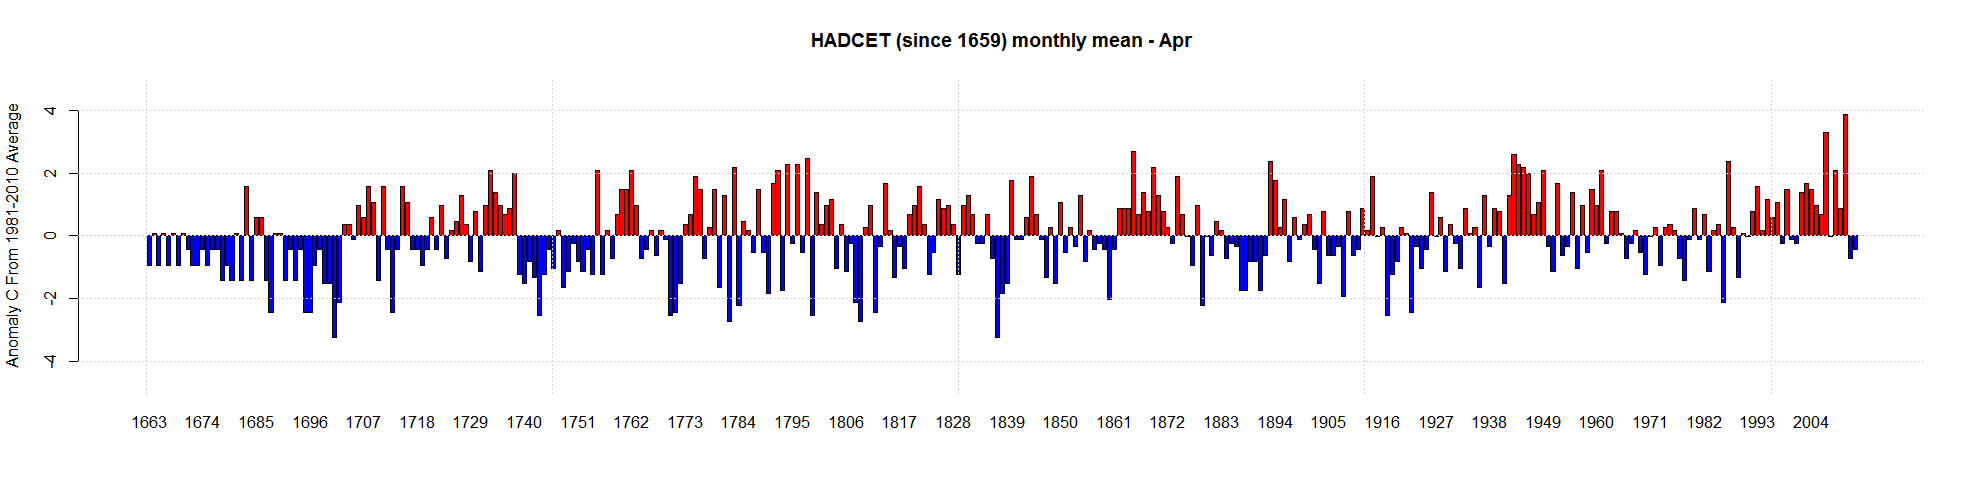
HADCET April 2013 average temperature came in at 7.5C.
2013 was tied with 1671,1674,1676,1677,1692,1694,1698,1712,1714,1717,1718,1720,1722,1745,1753,1765,1857,1859,1861,1902,1911 and 1925.