MASIE May 8 2014 – Arctic Ice Extent By Region As of Day 127

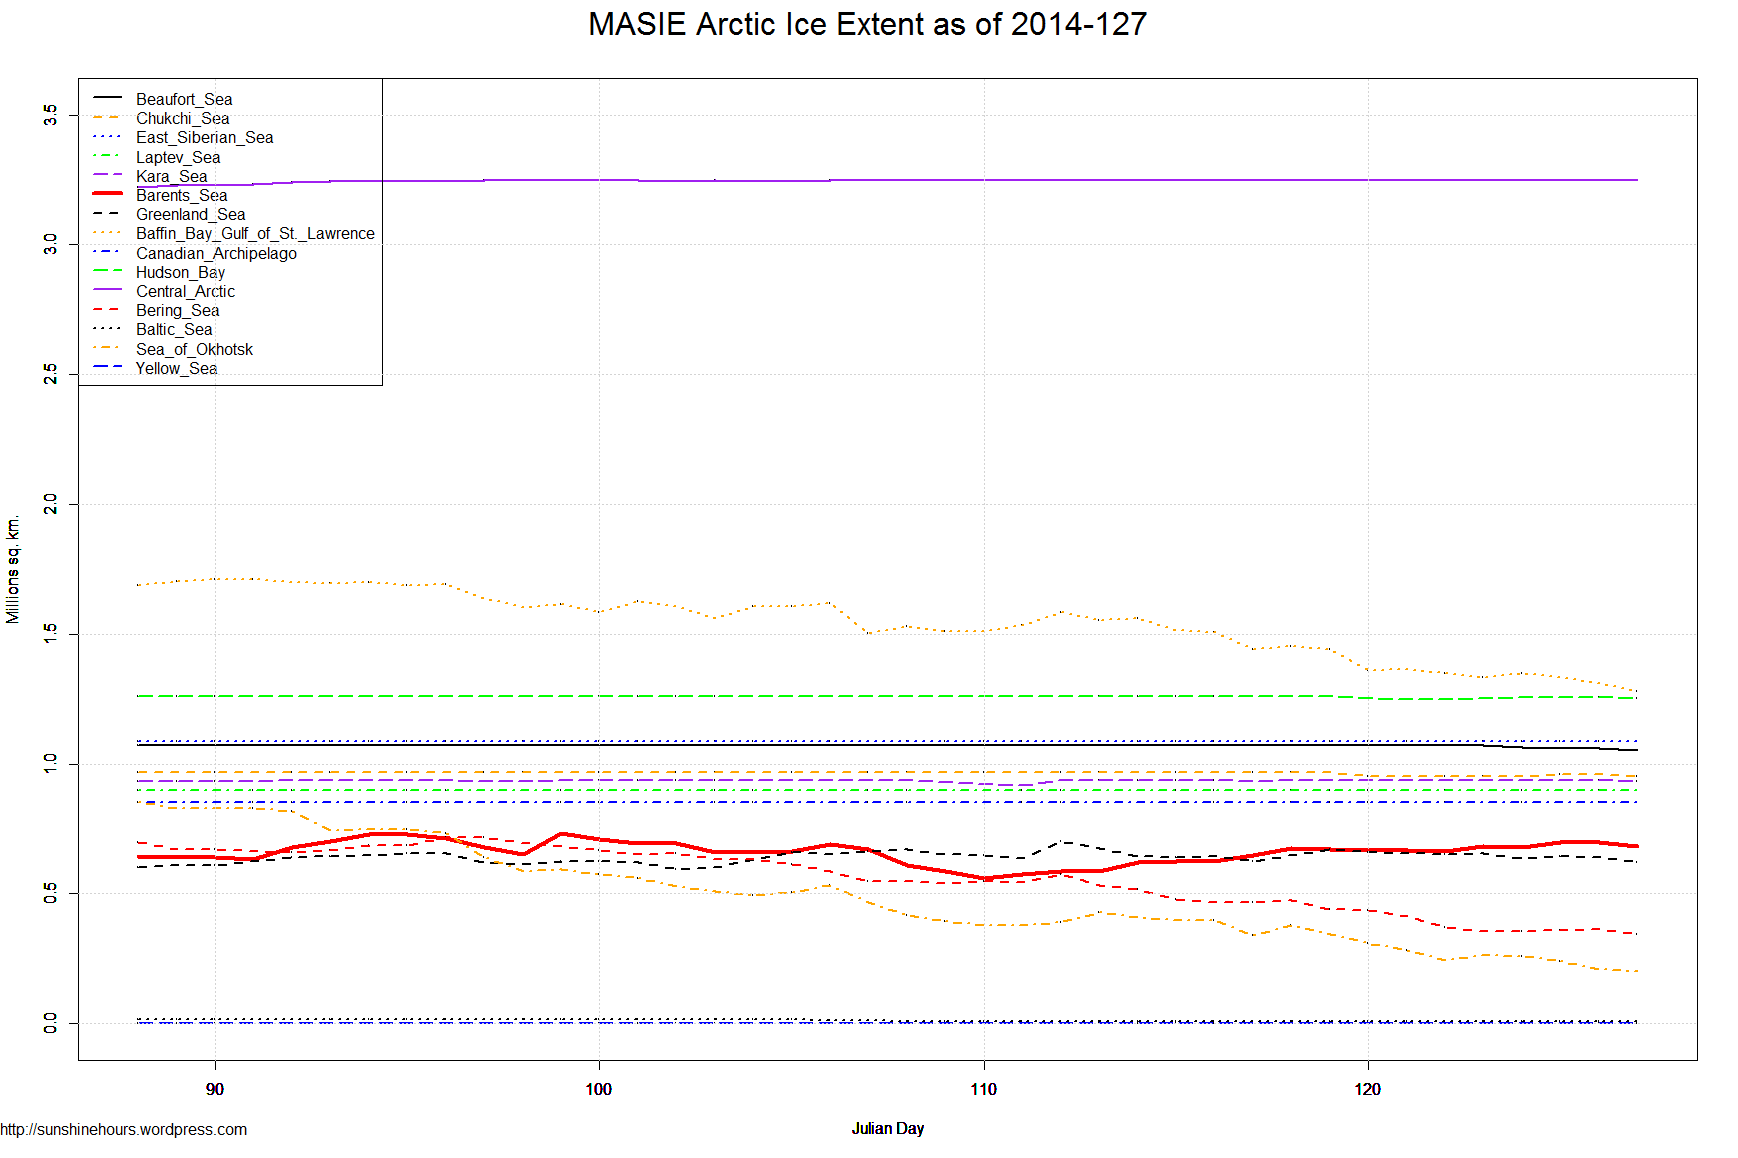
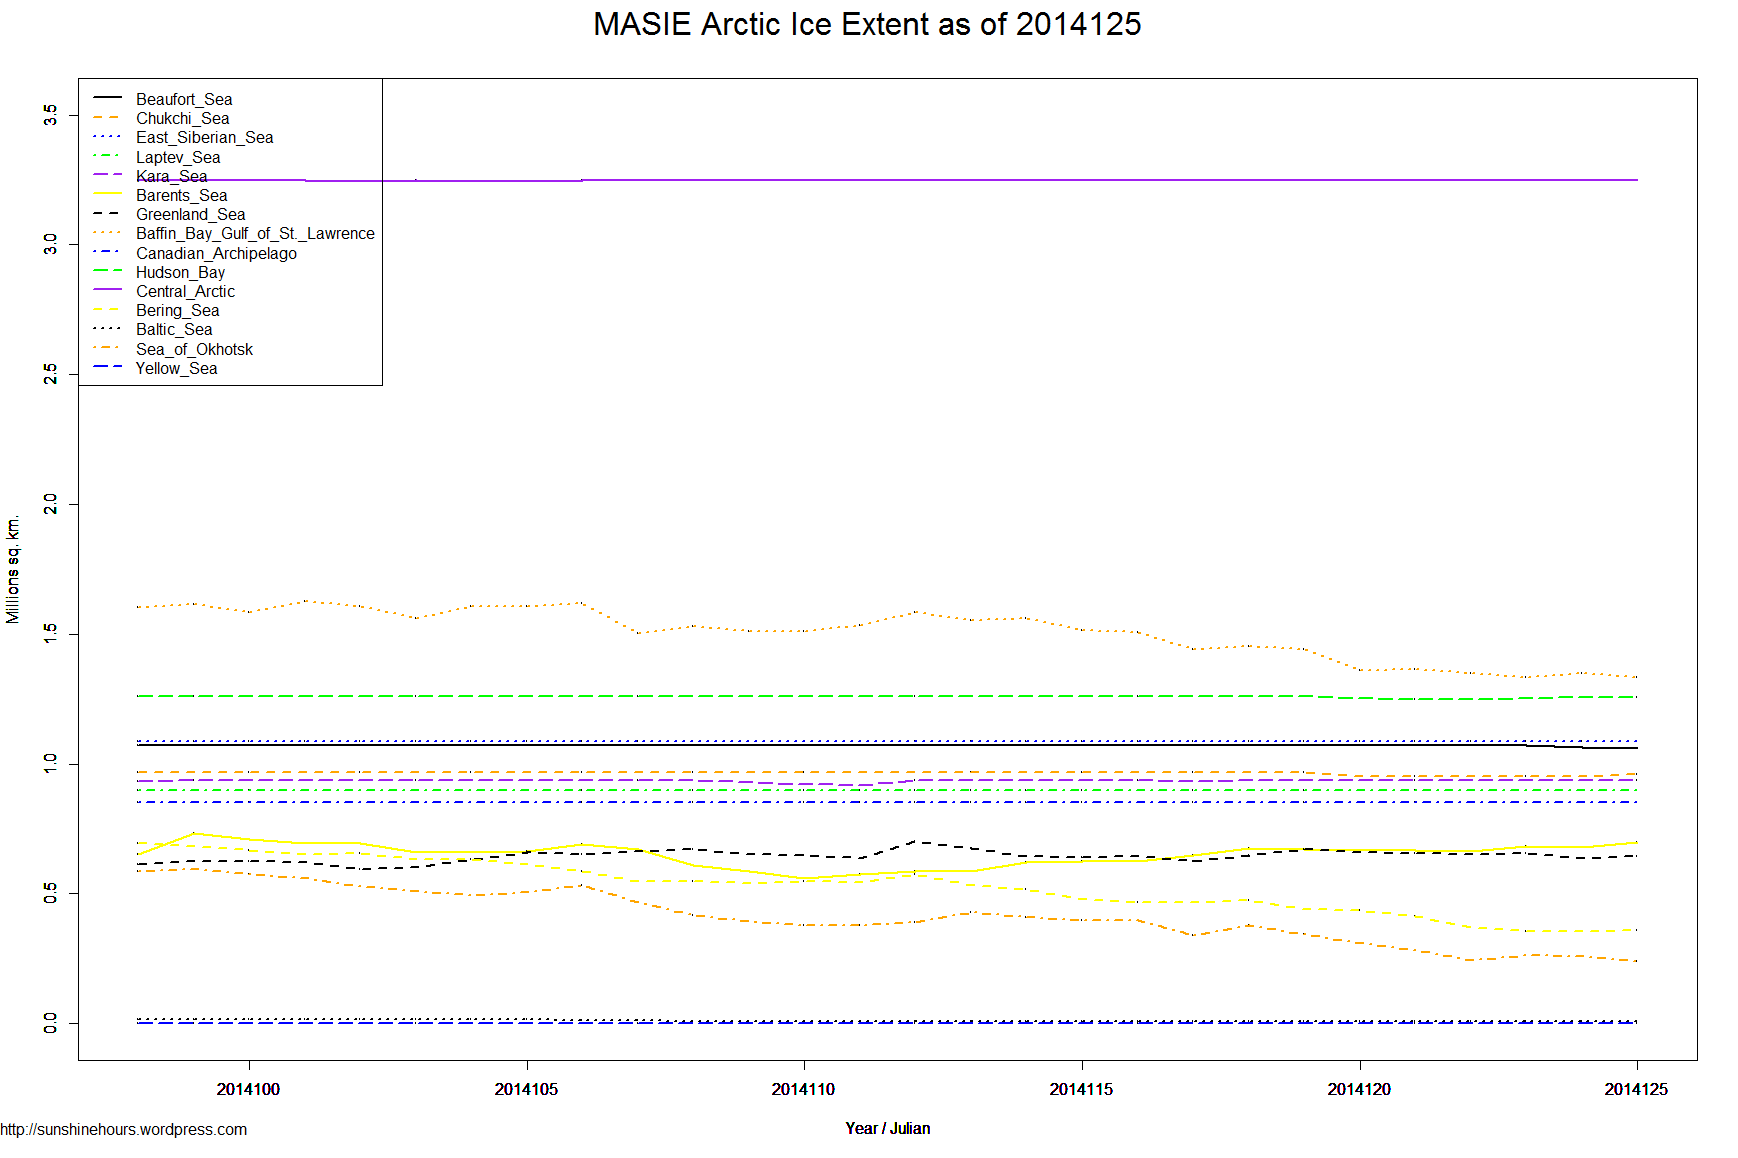
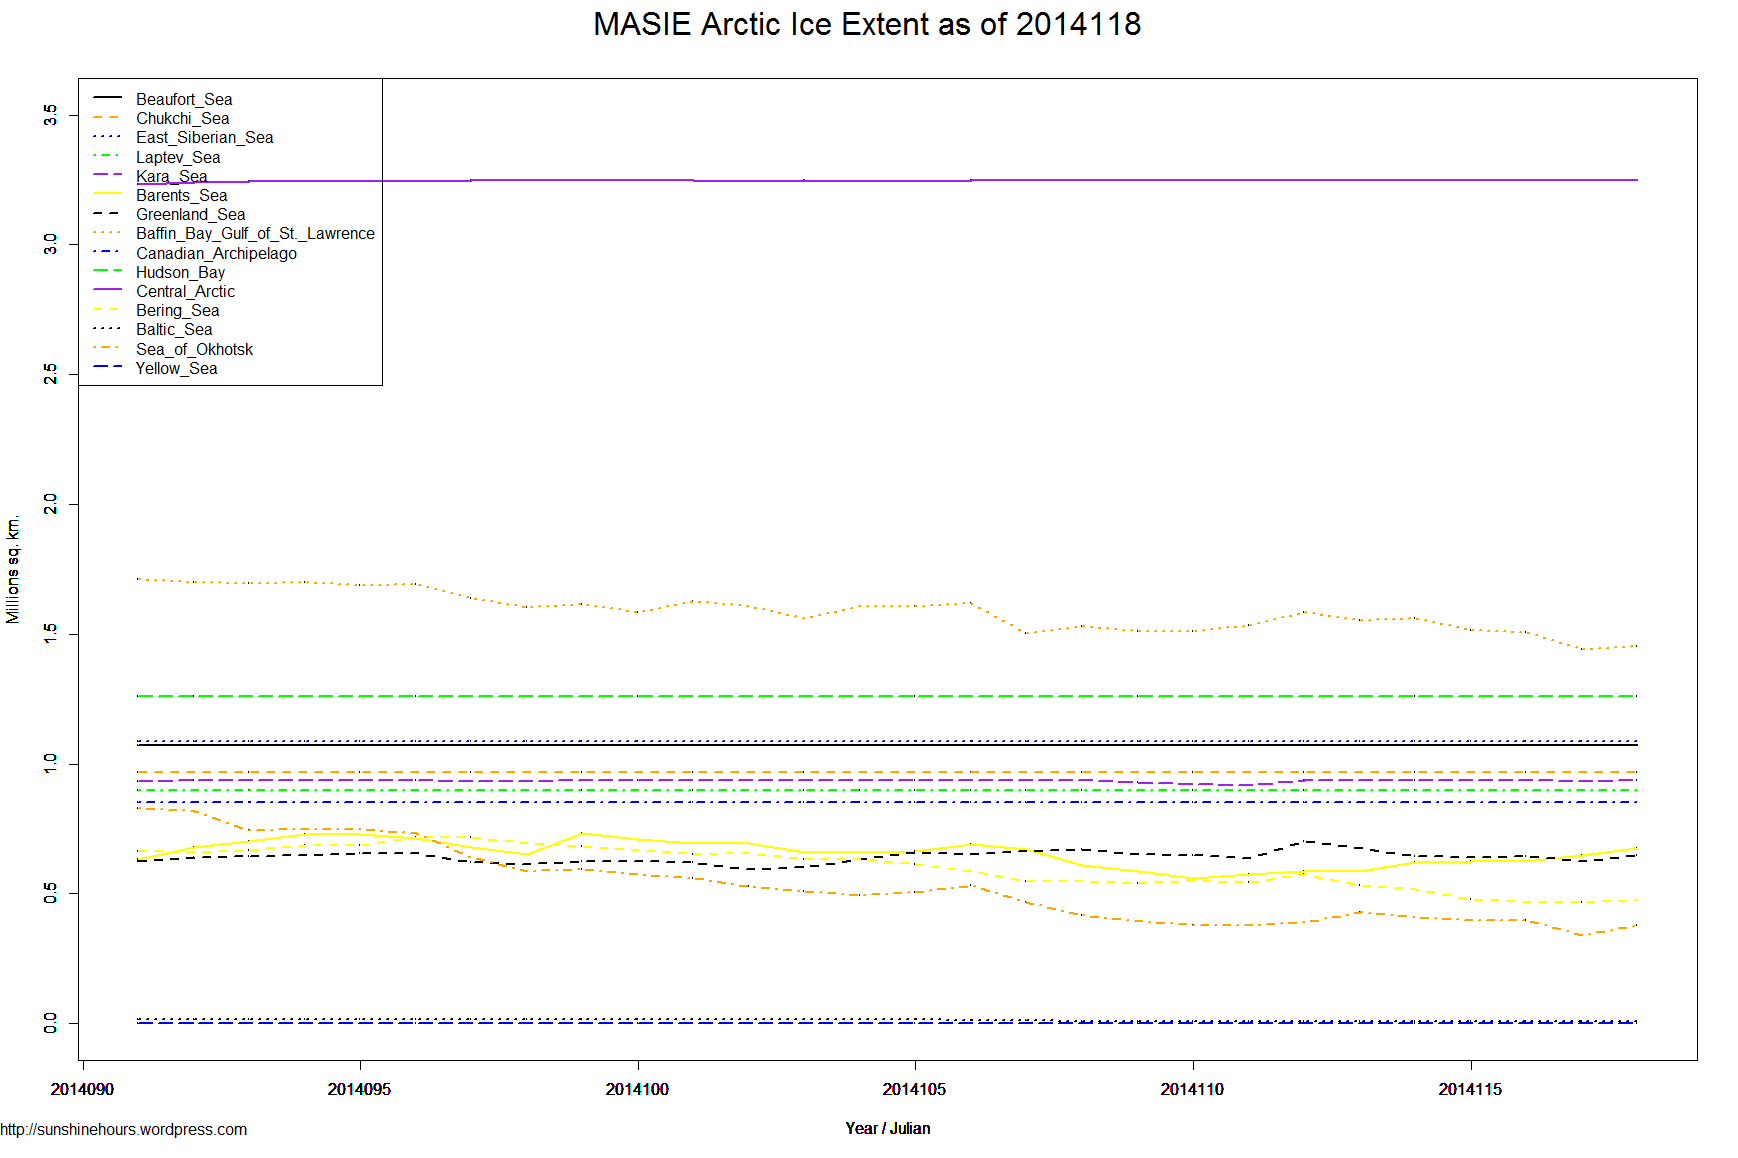
May 8 2014  MASIE Update (Although the dataset from MASIE only has 28 days of data, I have started to save the data allowing the analysis to go further back)

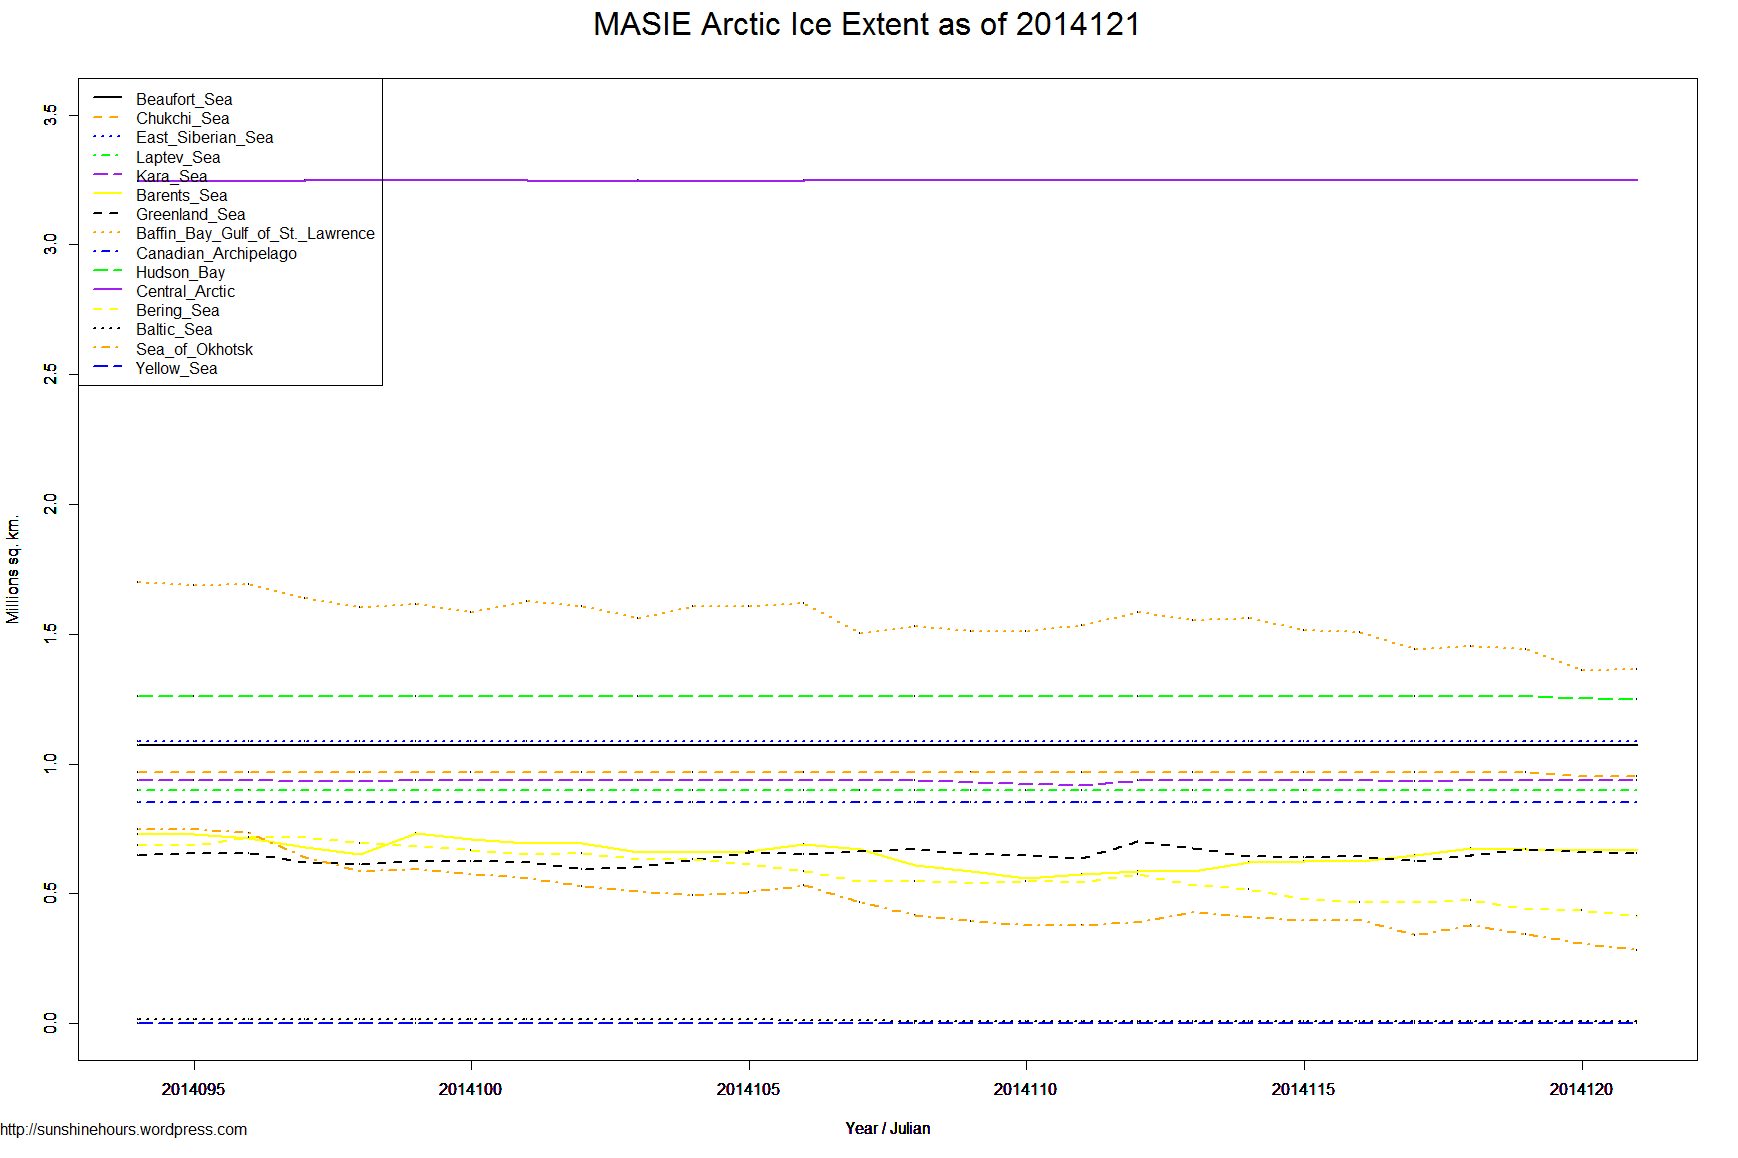
This is the gain/loss from day 88to day 121. Negative = loss. Sorted with biggest loser in last 7 days at top. Northern Hemisphere is the grand total.

Today I added Last 1 day and Last 39 (which will change every time I post). Four of the regions actually gained ice over the last 39 days, but that is dwarfed by losses elsewhere.


Region Start End Last 39 Last 28 Last 14 Last 7 Last 3 Last 1
Sea of Okhotsk 853,240 202,954 -650,286 -390,876 -225,244 -105,804 -57,396 -6,523
Bering Sea 697,324 343,858 -353,465 -339,657 -186,759 -91,668 -11,233 -20,631
Baffin Bay Gulf of St. Lawrence 1,688,530 1,280,204 -408,326 -336,002 -274,332 -81,529 -70,417 -31,659
Greenland Sea 603,416 620,032 16,616 -3,174 -55,151 -37,714 -17,926 -20,800
Beaufort Sea 1,070,445 1,053,016 -17,429 -17,429 -17,429 -17,429 -11,126 -7,107
Chukchi Sea 966,006 952,528 -13,478 -13,478 -13,478 -1,617 1,112 -8,746
Canadian Archipelago 853,214 851,952 -1,262 -1,262 -1,262 -1,262 -1,262 -1,262
Kara Sea 933,859 934,833 973 -191 -191 -191 -191 -191
Baltic Sea 15,337 8,402 -6,935 -7,186 -1,394 -105 184 0
East Siberian Sea 1,087,137 1,087,137 0 0 0 0 0 0
Laptev Sea 897,845 897,845 0 0 0 0 0 0
Central Arctic 3,221,921 3,248,013 26,092 795 0 0 0 0
Yellow Sea 0 0 0 0 0 0 0 0
Hudson Bay 1,260,903 1,251,802 -9,101 -9,101 -9,101 491 -2,890 -5,686
Barents Sea 645,917 683,279 37,362 -50,574 96,138 14,592 3,769 -15,785
Northern Hemisphere (Total) 14,805,115 13,418,045 -1,387,069 -1,170,395 -688,220 -322,253 -167,391 -118,392

MASIE Arctic Ice Extent as of 2014-127

Sea Ice Update May 7 2014 – Antarctic 59th Daily Record of 2014 – Global Sea Ice 861,000 sq km Above Normal

Update: Since March 27 Antarctic Sea Ice Extent has been more than two standard deviations above normal. 82 days out of 126.

A quick update for sea ice extent for day 126 of 2014:

  • Global Sea Ice Extent is 861,000 sq km above the 1981-2010 mean. That is ranked 4 for the day.
  • Antarctic Sea Ice Extent is 1,517,000 sq km above the 1981-2010 mean. That is ranked 1 for the day.  It is also the 59th daily record for 2014.
  • Arctic Sea Ice Extent is -657,000 sq km below the 1981-2010 mean. That is ranked 34 for the day.

NOAA Data here and here here.

Graphs below. (The big view for a change)  Click for bigger.

Global_Sea_Ice_Extent_2014_Day_126_1981-2010 Antarctic_Sea_Ice_Extent_2014_Day_126_1981-2010 Arctic_Sea_Ice_Extent_2014_Day_126_1981-2010

MASIE May 6 2014 – Arctic Ice Extent By Region As of Day 125 – Arctic Up Over Last 3 Days

May 6 2014  MASIE Update (This Arctic Sea Ice dataset from MASIE only has 28 days of data.)

This is the gain/loss from day 94 to day 121. Negative = loss. Sorted with biggest loser in last 7 days at top. Northern Hemisphere is the grand total.

Normally I only show Last 28,14 and 7. Today I added Last 3 days because it was so interesting.

In the last 3 days Northern Hemisphere actually rose 2,503 sq km because Barents Sea rose 34,216 sq km.

Hudson Bay, Baltic and Chukchi Sea also rose. This rise hasn’t shown up on the NOAA dataset.

Region Start End Last 28 Days Last 14 Last 7 Last 3
Sea of Okhotsk 587,542 239,550 -347,992 -136,916 -137,139 -5,462
Baffin Bay Gulf of St. Lawrence 1,602,768 1,335,175 -267,593 -198,696 -119,337 -13,664
Bering Sea 695,431 359,469 -335,961 -185,286 -114,606 -10,071
Beaufort Sea 1,070,445 1,060,123 -10,322 -10,322 -10,322 -10,322
Hudson Bay 1,260,903 1,254,692 -6,211 -6,211 -6,211 4,234
Chukchi Sea 966,006 961,021 -4,985 -4,985 -4,985 8,600
Greenland Sea 613,925 645,689 31,765 9,194 -3,962 -5,195
Baltic Sea 15,566 8,402 -7,163 -976 -323 184
East Siberian Sea 1,087,137 1,087,137 0 0 0 0
Laptev Sea 897,845 897,845 0 0 0 0
Kara Sea 931,339 935,023 3,684 16,849 0 0
Canadian Archipelago 853,214 853,214 0 0 0 0
Central Arctic 3,247,200 3,248,013 813 1,482 0 0
Yellow Sea 0 0 0 0 0 0
Barents Sea 651,565 699,064 47,499 125,742 23,541 34,216
Northern Hemisphere (Total) 14,485,805 13,586,610 -899,195 -390,141 -373,360 2,503

MASIE Arctic Ice Extent as of 2014125

Sea Ice Update May 5 2014 – Antarctic Breaks Old Daily Record By 560,000 sq km – Global Sea Ice 950,000 sq km Above Normal

A quick update for sea ice extent for day 124 of 2014:

  • Global Sea Ice Extent is 950,000 sq km above the 1981-2010 mean.
  • Antarctic Sea Ice Extent is 1,529,000 sq km above the 1981-2010 mean. 57th Daily Record for 2014. Broke the Old Record for the day by 560,000 sq km
  • Arctic Sea Ice Extent is -580,000 sq km below the 1981-2010 mean.

NOAA Data here and here here. Graphs below. Click for bigger.

Global_Sea_Ice_Extent_Zoomed_2014_Day_124_1981-2010 Antarctic_Sea_Ice_Extent_Zoomed_2014_Day_124_1981-2010 Arctic_Sea_Ice_Extent_Zoomed_2014_Day_124_1981-2010

MASIE May 3 2014 – Arctic Ice Extent By Region As of Day 121

May 3 2014  MASIE Update (This Arctic Sea Ice dataset from MASIE only has 28 days of data.)

This is the gain/loss from day 94 to day 121. Negative = loss. Sorted with biggest loser in last 7 days at top. Northern Hemisphere is the grand total.

The bottom 3 have all gained in last 7 days. Including 44,747 in the Barents Sea.

I assume the Chukchi Sea and Hudson Bay only started melting in last few days since the 7 day melt is the same as the 28 day melt.

The melt has resumed in the last 7 days after a small pause in previous 7.

Region Start End Last 28 Last 14 Last 7
Baffin Bay Gulf of St. Lawrence 1,698,291 1,365,547 -332,744 -138,260 -194,971
Sea of Okhotsk 749,260 282,058 -467,202 -184,740 -128,456
Bering Sea 685,870 412,911 -272,959 -134,551 -103,860
Chukchi Sea 966,006 954,145 -11,861 -11,861 -11,861
Hudson Bay 1,260,903 1,249,193 -11,710 -11,710 -11,710
Beaufort Sea 1,070,445 1,070,445 0 0 0
East Siberian Sea 1,087,137 1,087,137 0 0 0
Laptev Sea 897,845 897,845 0 0 0
Kara Sea 935,023 935,023 0 0 0
Canadian Archipelago 853,214 853,214 0 0 0
Central Arctic 3,245,697 3,248,013 2,316 0 0
Yellow Sea 0 0 0 0 0
Baltic Sea 16,117 8,455 -7,662 -2,813 99
Greenland Sea 648,293 656,357 8,064 -7,499 12,608
Barents Sea 729,360 666,212 -63,148 -6,169 44,747
Northern Hemisphere (Total) 14,852,534 13,688,761 -1,163,772 -497,603 -393,405

Here is the MASIE graph. The flat lines at the bottom are regions that have melted and are now  ice free. The completely flat lines elsewhere indicate no melting at all yet. The changing lines indicate melting regions.

Click for bigger.

MASIE Arctic Ice Extent as of 2014121


Joe Bastardi: Arctic sea ice anomaly in the summer is forecast to be near or above normal

Big story:

There is a huge event being forecasted this year by the CFSV2, and I don’t know if anyone else is mentioning this. For the first time in over a decade, the Arctic sea ice anomaly in the summer is forecast to be near or above normal.”

Read here:

Major Arctic Sea Ice Story Lurking, But Is Anyone Watching?


(h/t NorthwestPassage)


Sea Ice Update April 30 2014 – Antarctic Sea Ice 52nd daily record – Global Sea Ice 980,000 sq km Above Normal

A quick update for sea ice extent for day 119 of 2014:

  • Global Sea Ice Extent is 981,000 sq km above the 1981-2010 mean.
  • Antarctic Sea Ice Extent is 1,388,000 sq km above the 1981-2010 mean. That’s the 52nd daily record for 2014.
  • Arctic Sea Ice Extent is -407,000 sq km below the 1981-2010 mean.  Only 190,000 sq km melted in the last 11 days. Last year 600,000 sq km melted in same 11 days.

NOAA Data here and here here. Graphs below. Click for bigger.

Global_Sea_Ice_Extent_Zoomed_2014_Day_119_1981-2010 Antarctic_Sea_Ice_Extent_Zoomed_2014_Day_119_1981-2010 Arctic_Sea_Ice_Extent_Zoomed_2014_Day_119_1981-2010

MASIE April 29 2014 – Arctic Ice Extent By Region As of Day 118

April 29 2014  MASIE Update (This Arctic Sea Ice dataset frm MASIE only has 28 days of data.

This is the gain/loss from day 91 to day 118. Negative = loss. Sorted with biggest loser in last 7 days at top. Northern Hemisphere is the grand total.

Notice that even though the NH shows a 404,000 melt in the last 14 days, only 16,782 melted in last 7 days.

The bottom 5 have all gained in last 7 days. Including 102,200 in the Barents Sea.

Region Start End Last 28 Last 14 Last 7 Days
Northern Hemisphere 14,789,245 13,959,969 -829,276 -404,018 -16,782
Baffin Bay Gulf of St. Lawrence 1,711,230 1,454,513 -256,717 -151,655 -79,359
Bering Sea 664,041 474,076 -189,965 -160,060 -70,680
Baltic Sea 15,337 8,725 -6,612 -7,013 -653
Beaufort Sea 1,070,445 1,070,445 0 0 0
Chukchi Sea 966,006 966,006 0 0 0
East Siberian Sea 1,087,137 1,087,137 0 0 0
Laptev Sea 897,845 897,845 0 0 0
Canadian Archipelago 853,214 853,214 0 0 0
Hudson Bay 1,260,903 1,260,903 0 0 0
Yellow Sea 0 0 0 0 0
Sea of Okhotsk 829,717 376,689 -453,028 -118,565 223
Central Arctic 3,231,886 3,248,013 16,127 4,581 1,482
Greenland Sea 624,163 649,651 25,488 15,511 13,156
Kara Sea 932,891 935,023 2,132 0 16,849
Barents Sea 634,409 675,523 41,114 15,469 102,200


Here is the MASIE graph. The flat lines at the bottom are regions that have melted and are now  ice free. The completely flat lines elsewhere indicate no melting at all yet. The changing lines indicate melting regions.

Click for bigger.

MASIE Arctic Ice Extent as of 2014118


Sea Ice Update April 28 2014 – Antarctic Sea Ice 50% higher than 1980! – Global Sea Ice 1.02 million sq km Above Normal

A quick update for sea ice extent for day 117 of 2014:

  • Global Sea Ice Extent is 1,027,000 sq km above the 1981-2010 mean.
  • Antarctic Sea Ice Extent is 1,461,000 sq km above the 1981-2010 mean. That is the 50th daily record of 2014. For day 117, 2014 Antarctic Sea Ice Extent is is 50% higher than 1980!
  • Arctic Sea Ice Extent is -434,000 sq km below the 1981-2010 mean.

NOAA Data here and here here. Graphs below. Click for bigger.

Antarctic Sea Ice Extent for Day 117 From 1980 (infilled) Global_Sea_Ice_Extent_Zoomed_2014_Day_117_1981-2010 Antarctic_Sea_Ice_Extent_Zoomed_2014_Day_117_1981-2010 Arctic_Sea_Ice_Extent_Zoomed_2014_Day_117_1981-2010