PDO AMO Arctic Antarctic

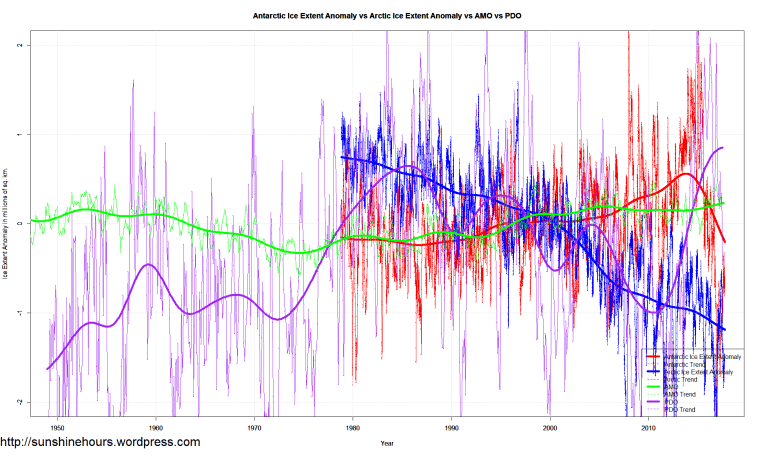
The graphs start from 1950 to show a full 66 year cycle of the PDO and AMO.

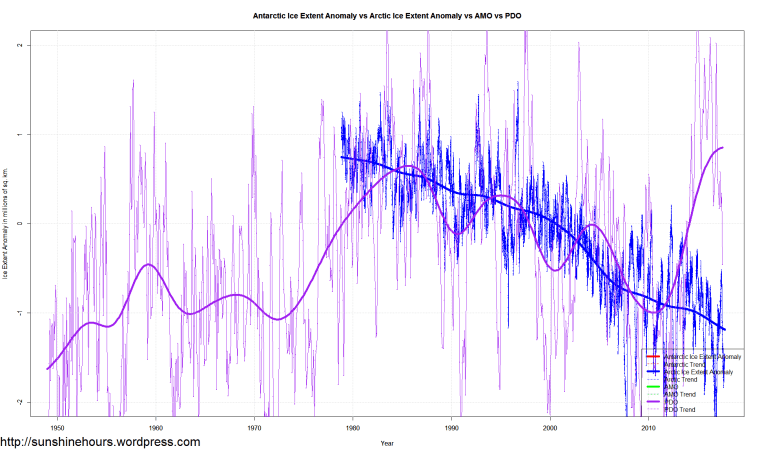
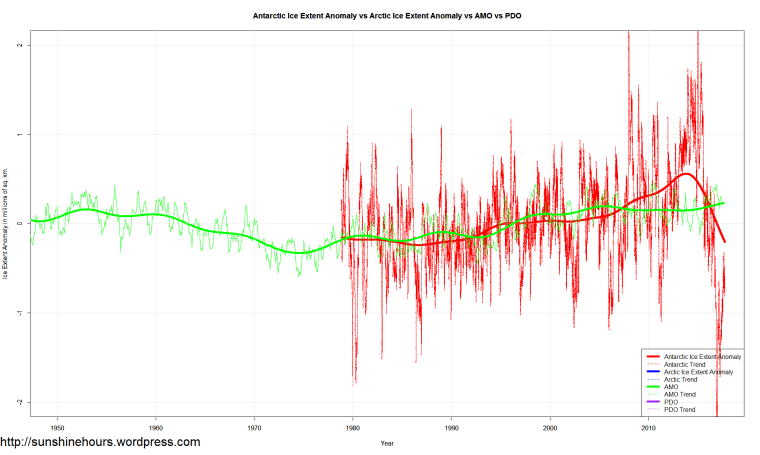
I’m graphing anomalies from the mean for all. Sea Ice is in millions of sq km.

PDO versus Arctic Extent  – note that the satellite record for sea ice starts at peak of PDO

AMO versus Antarctic Extent

Everything

Whatever The Cause – Blame Global Warming – So Says The NY Times

The NY Times is beclowning itself again in this article on drought in California.

Despite the fact that a cool PDO and warm AMO brings drought to California as shown by this post (referencing an article by Roger Pielke Sr. from 2012).

“What may be different about this drought is that, whatever the cause, the effects appear to have been made worse by climatic warming. And in making that case last week, scientists said, the administration was on solid ground.”


What clowns.